

 PDF
PDF ePub
ePub Citation
 Print
Print


INTRODUCTION
Bone tissue has high metabolic activity owing to its constant remodeling (i.e., formation and resorption) throughout one's life. Generally, bone health is assessed using densitometry techniques, including the gold standard of dual-energy X-ray absorptiometry. In children, bone mineral content is commonly used to assess bone mineral deficiency and to estimate fracture risk. However, these are static measures that do not reflect the dynamic nature of bone metabolism.12 In contrast, biochemical bone markers provide a more dynamic representation of the changes that occur during bone growth and modeling.12
Biochemical bone markers are classified according to their representative processes, namely formation and resorption. Bone formation markers are expressed during different phases of osteoblast development and reflect osteoblast function and bone formation. These markers include bone alkaline phosphatase, osteocalcin, and procollagen type I N-terminal propeptide (P1NP). The resorption markers are products of bone type 1 collagen degradation: hydroxyproline, pyridinoline, and deoxypyridinoline are degradation products found in urine, while N-terminal and C-terminal crosslinked peptides can be found in both serum and urine.3
Exhibiting high skeletal growth velocity and rapid bone turnover, growing children and adolescents show higher levels of bone markers than adults. In these young individuals, bone markers can be useful for investigating skeletal disease and monitoring responses to treatment. However, it may be difficult to clinically interpret marker data because of the influence of various factors on natural growth and maturation. While biochemical markers of bone turnover have been well-studied in post-menopausal women to monitor osteoporosis and are widely used in clinical practice,4 they are poorly documented in children and adolescents.5 Therefore, age- and sex-specific references should be established for pediatric populations with similar lifestyles living in comparable environments. To that end, it is necessary to assess the relationships between markers of bone formation/turnover and age/sex among healthy children and adolescents.
Given this background, we investigated the expression levels of the bone formation marker P1NP and the bone turnover marker osteocalcin in an attempt to establish reference values for each as a function of age and sex in healthy children and adolescents in Korea. We also evaluated the assay performance for serum P1NP.
MATERIALS AND METHODS
Study participants
The participants (n=580; 290 boys and 290 girls, age range 0–18 years) were recruited from Korean outpatients visiting our department for blood tests. They comprised children with noncomplicated acute conditions, mostly allergies, excluding sun allergy and respiratory (bronchitis, pharyngitis, and otitis) inflammation. The exclusion criteria were as follows: medication influencing bone metabolism, dietary restrictions, trauma-related fracture within the previous 2 years, and chronic disease affecting growth and physical development. Pediatricians selected children who were judged to be of normal development, not underweight or obese, according to the criteria for the study. Clinical data were obtained from reviewing patient medical records by laboratory physicians.
Measurement of P1NP and osteocalcin
Blood samples were collected from an antecubital vein. The serum was separated by centrifugation and was frozen at −70℃ for subsequent analysis of P1NP and osteocalcin. All analyses were completed within 1 year of collection. Sample collection, transportation, separation, and storage were performed according to standard laboratory procedures.
P1NP was measured using monoclonal mouse antibodies against P1NP (total P1NP, Roche Diagnostics, Mannheim, Germany) by the electrochemiluminescence immunoassay (ECLIA) on an automated Cobas e411 analyzer (Roche Diagnostics, Mannheim, Germany). Osteocalcin measurement was also performed by the ECLIA method using monoclonal mouse antibodies against N-MID osteocalcin (N-Mid Osteocalcin, Roche Diagnostics, Mannheim, Germany).
Evaluation of analytical performance for P1NP
We evaluated the analytical performance of a Cobas e411 instrument for serum P1NP using control materials and patient samples. Precision was determined using PreciControl Varia Level 1 (approximately 35 µg/L) and Level 2 (approximately 220 µg/L) controls (Roche Diagnostics, Mannheim, Germany) according to the Clinical and Laboratory Standards Institute (CLSI) EP05-A3 guidelines.6 The two levels were tested with five replicates per run for 5 consecutive days, with a total of 25 results obtained to determine repeatability and total imprecision. Linearity tests were performed using high- and low-concentration samples within the measuring range provided by the manufacturer according to the CLSI EP06-A guidelines.7 High-concentration and low-concentration samples were mixed at ratios of 4:0, 3:1, 2:2, 1:3, and 0:4 to obtain five testable concentrations. Each sample was measured twice, and linearity was evaluated by regression analysis.
Statistical analysis
The distribution of P1NP was examined for normality using the Kolmogorov-Smirnov Z-test.8 In addition to the exclusion criteria, outliers were further checked and eliminated using the Tukey test.9 The reference intervals for P1NP and osteocalcin were calculated using a non-parametric percentile method according to the CLSI C28-A3 guidelines,9 and results for age groups were presented as upper and lower limits corresponding to the 2.5th and 97.5th percentiles. Two-sample t test or non-parametric Mann-Whitney test was used to compare parameters between boys and girls, while Spearman correlation coefficients expressed the measures of linear association. The chronological age groups were initially used in data partition; the partition criteria were in accordance with the CLSI guidelines.9 Age and sex partitions were determined by first visually inspecting the distribution plots, and then statistically verifying with the Harris and Boyd test.10 Robust reference intervals of the two bone markers were then calculated. Statistical analyses were performed using SPSS 22.0 (IBM Corp., Armonk, NY, USA) and Excel 2010 (Microsoft Corp., Washington DC, WA, USA). p<0.05 was considered statistically significant. For precision studies, both standard deviations and coefficients of variation (CVs) were calculated using LaboStats ver. 1.5.1.0 (Laboratory Medicine Foundation, Seoul, Korea).
RESULTS
Reference intervals for P1NP and osteocalcin by age and sex
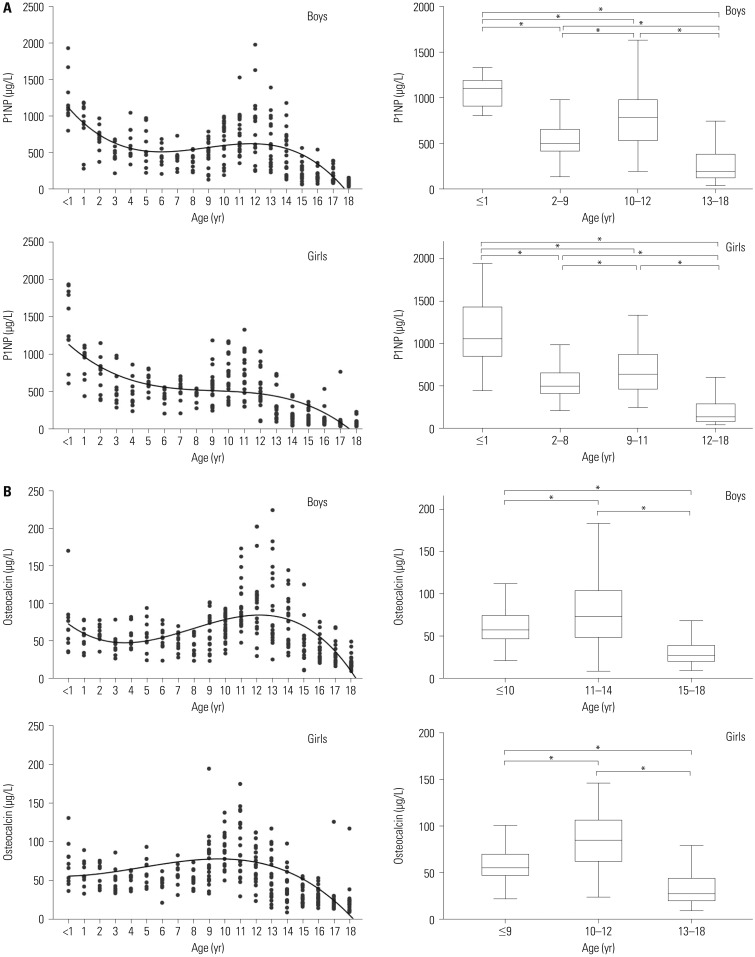
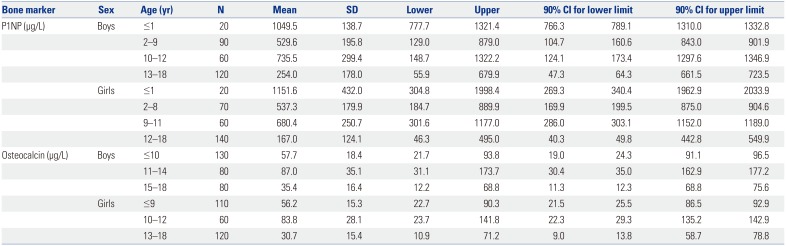
A total of 580 healthy children and adolescents participated in this study and were divided into groups according to age (0–18 years) and analyzed separately for each year of age. Both sexes were also evaluated separately to observe sex-related differences. The characteristics of the study population in relation to both bone markers are shown in Supplementary Table 1 (only online) (P1NP in subjects 0–18 years) and in Supplementary Table 2 (only online) (osteocalcin in subjects 0–18 years). The age- and sex-stratified means, standard deviations, and percentile values for P1NP and osteocalcin concentrations are shown in Table 1 and Fig. 1.
Significant variations with age were observed for laboratory bone markers in both sexes (p<0.001), as were significant differences between boys and girls (p<0.05). The highest levels of P1NP were observed during the first year of life, after which the levels decreased with some fluctuations until puberty (Supplementary Table 1, only online; Fig. 1). The levels of P1NP in boys tended to increase in puberty, but showed gradual changes and declined with age in girls. However, there was no postnatal osteocalcin peak. An increase in osteocalcin levels was observed in both sexes with age, peaking (with some plateauing) at 11–13 years in boys and at 9–12 years in girls (Fig. 1).
Both bone markers increased with pubertal onset, and significant differences were observed between boys and girls, especially those between the ages of 12 and 17 years (Supplementary Tables 1 and 2, only online; Fig. 1). Serum P1NP and osteocalcin were positively correlated (r=0.467, p<0.001).
Analytical performance for serum P1NP
Good precision was achieved when evaluating low- and high-level controls; the repeatability (within-run imprecision) CVs assessed by 25 measurements were 2% and 0.4%, respectively. The total imprecision (within-laboratory imprecision) CVs were 2.1% and 0.5%, respectively. This assay was shown satisfactorily to be linear (R2=0.9999) within the clinically measurable concentration range from 14.6 µg/L to 1005.5 µg/L.
DISCUSSION
Bone markers are specific bone cell-derived molecules that reflect this tissue's remodeling activity. They can be classified into two categories, bone formation and bone resorption markers. All bone markers are products of bone collagen degradation mediated by osteoclasts during bone resorption and are released into the circulation and excreted through the urine, from whence their levels are usually measured. In children, however, it is difficult to reliably collect a 24-hour urine sample. Concentrations of circulating and urinary markers depend on the amount secreted during bone formation and released from the bone during resorption. Hence, their measured levels do not directly reflect the amount of bone gained during growth.5
Type I collagen constitutes approximately 90% of the organic bone matrix, which is synthesized as procollagen containing C- and N-terminal extension peptides. They are removed by specific proteases during the conversion of procollagen to collagen and the latter's embedding into the bone matrix. Serum concentrations of P1NP are directly related to the amount of newly formed collagen laid down in the bone. Thus, P1NP is a genuine bone formation marker. P1NP maintains its stability despite repeated freezing and thawing,11 and its levels are reproducible and independent of the time of sampling, as no circadian rhythm associations have been documented.12 The International Osteoporosis Foundation and International Federation of Clinical Chemistry and Laboratory Medicine Working Group on Bone Marker Standards recommended that serum P1NP be used as the reference marker for bone formation.13
Osteocalcin is synthesized by osteoblasts and is the most abundant non-collagenous protein in the bone matrix. After synthesis, a small amount of osteocalcin is released into the circulation.14 Circulating osteocalcin has a short half-life and is rapidly cleared by the kidneys. It was previously shown that human serum contains intact osteocalcin molecules, as well as several types of fragments. Serum osteocalcin has been shown to be an important marker of bone turnover, rather than bone formation, as it functions to limit bone formation without impairing bone resorption or mineralization.1516 It is also an excellent indicator of the response to growth hormone therapy.1718 However, serum osteocalcin concentrations have significant circadian-related variations, with its concentrations highest in the morning.1819 Thus, blood samples should strictly be acquired in the morning hours for purposes of osteocalcin measurement. This marker is also relatively unstable; its immunoreactivity reportedly decreases by 50–70% after 6–24 hours at room temperature and 40–80% after 2 weeks at 4℃.2021 Repeated freezethaw cycles also reduce osteocalcin values.22 Moreover, the restricted times during which blood samples could be acquired introduce the possibility of diurnal variations. Seasonal variations, diet, and vitamin D3 supplementation, however, do not influence the expression levels of either P1NP or osteocalcin.232425
The reference intervals we determined for P1NP and osteocalcin varied significantly with age and sex, which was expected given the growth and metabolic activity present during childhood and adolescence. The level of P1NP in boys tended to increase in puberty, but gradually changed and declined with age in girls. During puberty, the ranges of the lower- and upper-limit values of P1NP in boys were higher than those in girls (Korean boys: 55.9–1322.2 µg/L vs. girls, 46.3–1177 µg/L). These results are similar to those of a study26 comprised of 356 Canadian children aged 6–18 years, in which the ranges of lower- and upper-limit values of P1NP in boys aged >10 years were higher than those in girls (Canadian boys, 61–1399 ng/mL vs. Canadian girls, 38–1346 ng/mL). Though comparisons under the age of 10 were not possible due to differences in study-included ages and age stratification, the chronological age changes of bone marker levels were also similar in Korean and Canadian children aged 6–18 years. Meanwhile, osteocalcin had no postnatal peak, although the levels of this marker were higher than the adult reference range throughout childhood.
Compared with the reference intervals with Caucasian children aged 0–18 years reported by Bayer,11 the ranges of upper limits (97.5th percentile) of osteocalcin in Korean children were lower in children aged 0–8 years (Caucasian, 85.4–232.5 µg/L. vs. Korean, boys: 67.3–108.8 µg/L; girls: 63.5–113.3 µg/L). For P1NP, the ranges of upper limits in Korean children aged 0–8 years were also lower than Caucasian children (Caucasian, 746.1–4762.8 µg/L vs. Korean, boys: 519.6–1966.9 µg/L; girls: 505.8–2606.7 µg/L). However, the ranges of lower limits (2.5th percentile) of P1NP in both boys and girls aged 9 to 13 years were higher (boys: Caucasian, 45.2–142.5 µg/L vs. Korean, 89.8–249.5 µg/L; girls: Caucasian, 42.7–65.3 µg/L vs. Korean, 93.7–152.3 µg/L).
One of the challenges of establishing reference intervals in children is the difficulty of recruiting a minimum of 120 participants as advised in the CLSI guidelines.9 Since most age groups in our study comprised fewer than 120 individuals, we applied a robust method for calculating the central 95th reference interval percentile as recommended by the guidelines. This involved an iterative process in which observations were down-weighted according their distance from the center, and reliable results were generated, despite the small sample size.27
Biochemical measurements of bone turnover are essential in the study of the pathophysiology of skeletal metabolism and growth. However, the interpretation of results is difficult because such measurements fluctuate depending on age, pubertal stage, growth velocity, mineral accrual, hormonal regulation, nutritional status, circadian variation, day-to-day variation, and specificity for bone tissue, as well as the sensitivity and specificity of the assays.52628 Children of the same sex and chronologic age may yet differ in skeletal age and pubertal stage. As the rates of longitudinal growth and bone remodeling depend on skeletal, chronologic, and pubertal stages, each of these variables must be taken into account when comparing groups of children.2930 Our approach to grouping our participants did not involve classifying them by Tanner stage. The relationship between Tanner stage and chronological age in boys and girls needs to be investigated using a specific tool or self-assessment questionnaire to evaluate the development of pubertal characteristics. However, our data also showed that bone markers vary with pubertal growth, with values being higher during early puberty and declining earlier in girls than in boys. Further studies on other covariates that may also influence bone marker values, including physiological factors, such as the body mass index Z-score and parathyroid hormone levels, should also be considered.
Recent advances in research and development have increased the sensitivity, specificity, and availability of assays to detect and measure circulating serum proteins. Therefore, bone markers can be studied for a variety of important purposes, such as basic bone biology research, defining general physiological phenomena in clinical studies or drug trials, and following the medical states of individual patients. Currently, four assays are commercially available for the measurement of circulating P1NP, including a radioimmunoassay (RIA) for intact P1NP, an automated chemiluminescence immunoassay for intact P1NP, an enzyme-linked immuno-sorbent assay (ELISA) for total P1NP, and an automated ECLIA for total P1NP.31 The assays specified for intact P1NP preferentially measure the larger P1NP antigen in serum, while those labelled for total P1NP are sensitive to both the larger and smaller forms. In this study, we evaluated an automated ECLIA for detecting serum total P1NP with the Cobas e411 instrument and found its analytical performance to be similar to the performances of the Elecsys 2010 automated analyzer (Roche Diagnostics, Mannheim, Germany)3233 and the E170 module immunology analyzer (Roche Diagnostics, Mannheim, Germany).34 The repeatability (within-run imprecision) and total imprecision (within-laboratory imprecision) values of Cobas e411 were <5%, which are lower than the manufacturer's recommended levels. Cobas e411-quantified bone markers may thus be useful for determining bone metabolism indices.
To compare bone marker data from different studies and laboratories, it is important to establish whether the reference ranges of bone markers are affected by the type of assay used. According to a study comparing bone marker measurements between assays (automated vs. manual),33 automated assays appeared to yield lower values than data obtained from manual assays. The type of assay significantly affected the reference intervals obtained for serum cross-linked C-terminal telopeptide of type I collagen and urinary cross-linked N-terminal telopeptides of type I collagen (p<0.001), but not for serum P1NP [automated: total P1NP, Elecsys 2010 systems vs. manual: UniQ PINP RIA (Orion Diagnostica, Espoo, Finland)] (p=0.280). However, RIA has limited routine clinical application because of safety issues.28 Of the two assays for total P1NP, the manual ELISA is the older one; this method has good precision, but a higher CV than the automated ECLIA.31 Fully automated assays allow for rapid and precise determination of bone marker levels.
In summary, to date, there have been no standard Korean reference intervals reported for pediatric bone markers. We determined reference intervals for P1NP and osteocalcin in healthy Korean children living in a similar environment with comparable lifestyles. Achieving reliable laboratory bone marker evaluation can help enhance its use in routine clinical practice with the potential for performing such measurements more frequently than bone densitometry. Our new reference intervals may better reflect bone growth and metabolism in children and adolescents. Appropriate interpretation of bone marker values would allow for the early detection of disease progression or evaluation of therapeutic response sooner than can be achieved using bone densitometry.
 XML Download