

 PDF
PDF ePub
ePub Citation
 Print
Print


INTRODUCTION
Knee osteoarthritis (OA) is a chronic degenerative disease of the joints that is common in older adults, and its incidence increases with aging.1 Reportedly, the total prevalence rate of OA is 15%, with rates of 10–17% in patients over 40 years, 50% in patients over 60 years, and as much as 80% in patients 75 years of age.2 OA can lead to dysfunction and knee pain. Although it is not fatal, OA seriously affects patient quality of life. The pathogenesis of OA is complex, involving cartilaginous aging, bone remodeling, synovial lesions, microvascular lesions, inflammation, and other biological processes.345 Its specific pathological mechanisms, however, have not yet been elucidated.
The pathogenesis of OA mainly involves pathological changes in articular cartilage and chondrocytes. In recent years, molecular biology has played an important role in explaining its disease pathophysiology. Gene regulation has been implicated in driving an imbalance between the expression of catabolic and anabolic factors, leading eventually to osteoarthritic cartilage degeneration. The various stages of disease progression have been described by a complex pattern of transcriptional regulations.6
In the present study, we downloaded the gene expression profile GSE103416 from the Gene Expression Omnibus database (GEO) and conducted bioinformatics analysis to investigate differentially expressed genes (DEGs) between OA knee cartilage and normal knee cartilage in a rat model of OA. In doing so, we hoped that the key target genes and pathways involved in the progression of OA could be identified and that existing molecular mechanisms could be revealed.
MATERIALS AND METHODS
Gene expression microarray data
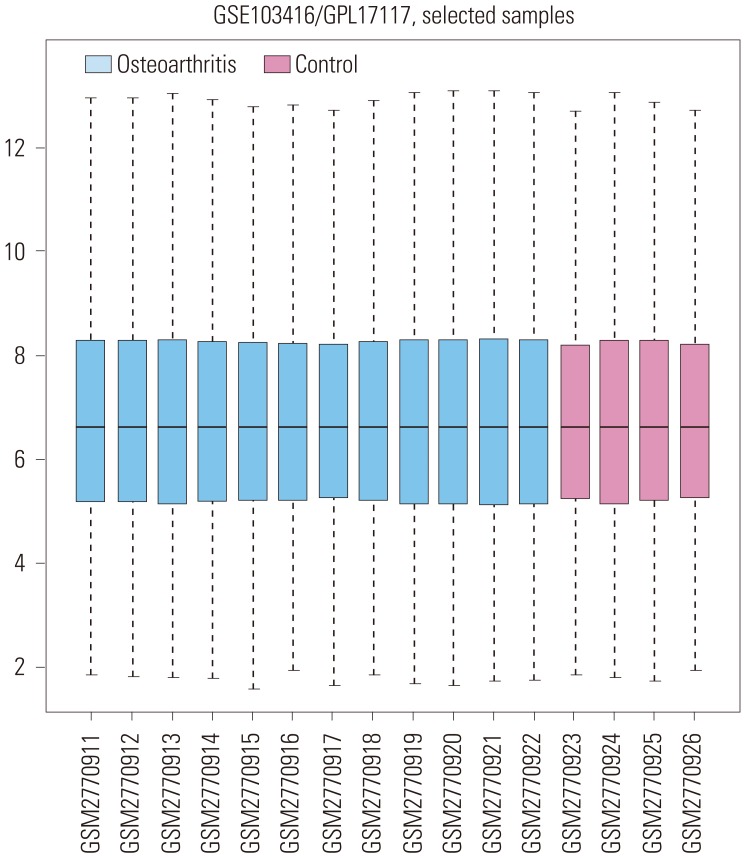
Knee cartilage samples were collected from individual male Wistar rats with monosodium iodoacetate (MIA)-induced OA (0, 2, 14, and 28 days after treatment). MIA-treated (3 mg) animals were compared to intact controls. Four replicate samples were analyzed per experimental group. The gene expression profile GSE103416 was downloaded from the GEO (www.ncbi.nlm.nih.gov/geo/). GSE103416 was based on the Affymetrix Rat Gene 2.0 ST Array GPL17117 platform. The GSE103416 dataset contained 16 samples, including 12 OA knee cartilage samples and four normal control knee cartilage samples. A box plot of the sample data is provided in Fig. 1.
DEGs in OA knee cartilage and control cartilage
The raw data files used for the analysis included TXT files (Affymetrix platform). The analysis was carried out using GEO2R, which can perform comparisons on original submitter-supplied processed data tables using the GEO query and limma R packages from the Bioconductor project. A p-value <0.05, adjusted (adj.) p-value <0.05, and log fold change (FC) >1.0 and log FC <−1.0 were used as cut-off criteria. DEGs with statistical significance between OA knee cartilage and control cartilage were selected and identified.
GO and the KEGG analysis of DEGs
The target gene list was subjected to analysis using Cytoscape software (version 3.4.0) (www.cytoscape.org) and ClueGO (version 2.33, Laboratory of Integrative Cancer Immunology, Bethesda, MD, USA) to identify overrepresented Gene Ontology (GO) categories and pathway categories. GO analysis was used to predict the potential functions of the DEGs in biological processes (BP), molecular functions (MF), and cellular components (CC). Finally, the overrepresented pathway categories with p-value <0.05 were considered statistically significant using the Kyoto Encyclopedia of Genes and Genomes (KEGG) pathway enrichment analysis: KEGG (http://www.genome.jp/) is a knowledge base for systematic analysis of gene functions, linking genomic information with higher-level systemic functions.
Gene interaction network construction
A large number of the DEGs we obtained were potential OA-related-genes, and it was suggested that these DEGs in knee cartilage may participate in the progression of OA. First, the DEGs list was subjected to analysis by the Search Tool for the Retrieval of Interacting Genes (STRING) database (http://www.string-db.org/), and an interaction network chart with a combined score >0.4 was saved and exported. Subsequently, the interaction regulatory network of OA-associated genes was visualized using Cytoscape software (version 3.4.0). Then, the plugin Molecular Complex Detection (MCODE) was applied to screen the modules of the gene interaction network in Cytoscape.
qRT-PCR verification
Six genes were amplified by quantitative real-time polymerase chain reaction (qRT-PCR) with the Bio-Rad CFX96 Real-Time PCR System (Bio-Rad, Invitrogen Corp., Carlsbad, CA, USA). Total RNA was isolated from the MIA-induced OA knee cartilage samples and normal knee cartilage samples using TRIzol reagent (Invitrogen Corp, Carlsbad, CA, USA), and was polyadenylated and reverse-transcribed with a poly(T) adapter into cDNA, following the manufacturer's directions. Real-time PCR was performed using SYBR green dye in a thermal cycler with the following parameters: an initial denaturation step at 95℃ for 30 min; 40 cycles at 95℃ for 5 seconds; and 60℃ for 30 seconds. The complete experimental process was performed for each sample in triplicate. All primers were synthesized by Shanghai Shenggong Inc. (Shanghai, China) and mRNA-specific primers are listed in Supplementary Table 1 (only online). All data were analyzed using the 2−ΔΔCT method to calculate the difference between the threshold cycle (CT) values of the target genes in each sample. All data were analyzed using SPSS statistical software (version 11.5 for Windows, SPSS Inc., Chicago, IL, USA). Statistical analysis was performed using two-tailed Student's t-test, and differences were considered statistically significant at p<0.05.
RESULTS
Identification of DEGs
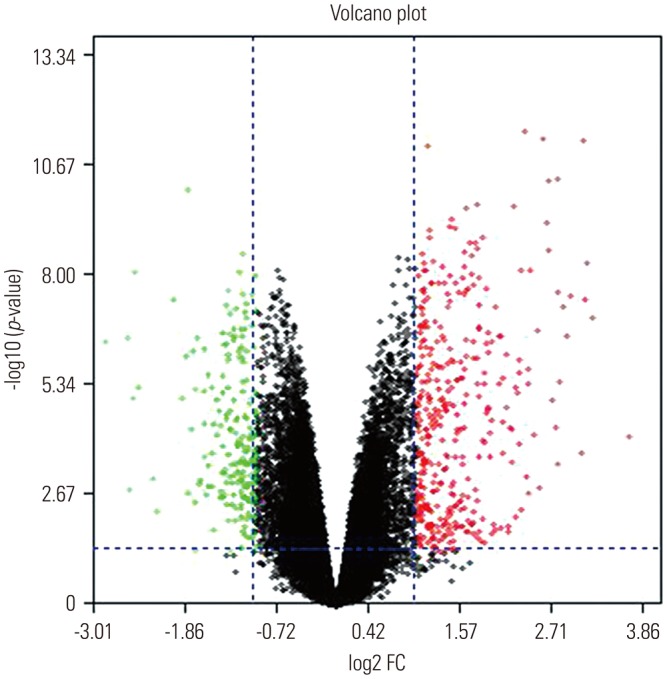
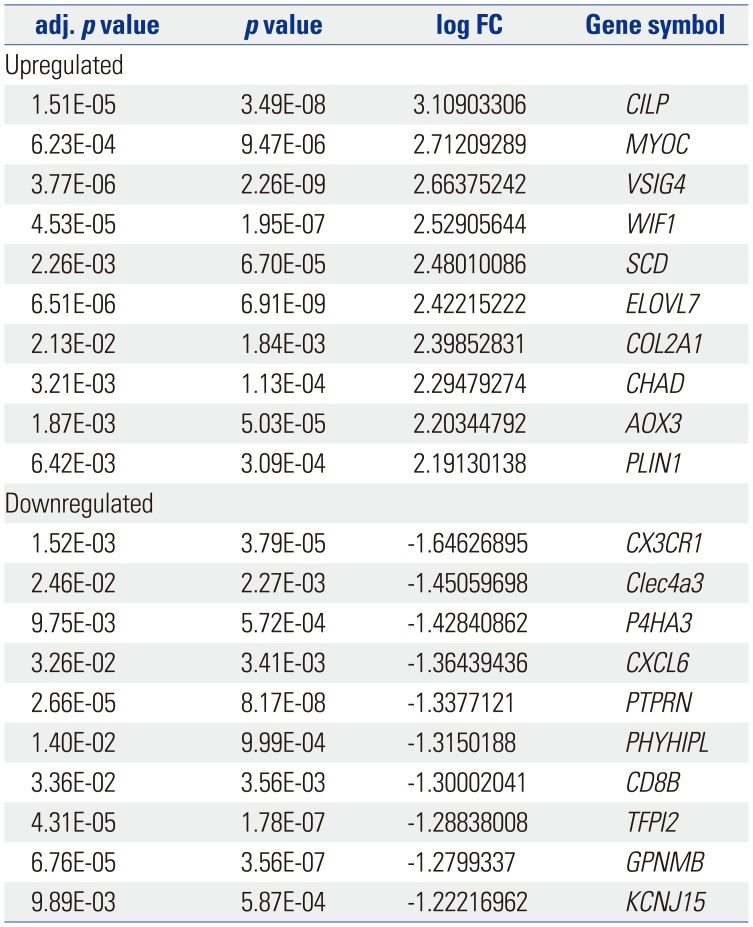
The gene expression profile GSE103416 was downloaded from GEO, and the GEO2R method was used to compare the DEGs in the OA knee cartilage samples with those of the intact controls. In the OA knee cartilage samples, 99 DEGs were identified, including 76 upregulated DEGs and 23 downregulated DEGs, compared with normal knee cartilage samples. The volcano plot and partial list DEGs are shown in Fig. 2 and Table 1, respectively.
GO term enrichment analysis of DEGs
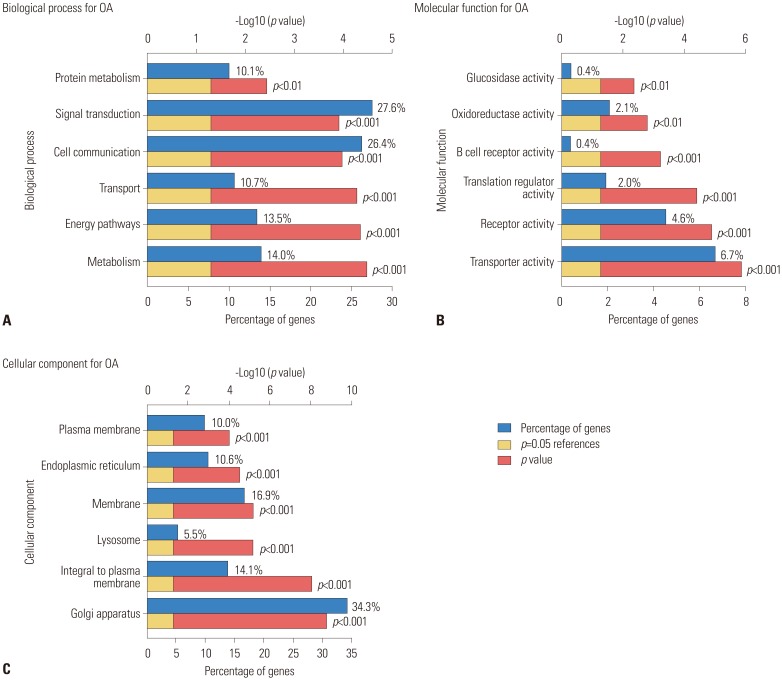
Functional annotation of the 99 DEGs was clarified using the Cytoscape software online tool. GO analysis (Fig. 3) indicated that these DEGs were significantly enriched in protein metabolism, signal transduction, cell communication, transport, energy pathways, metabolism, and other BP. For MF, the DEGs were enriched in activity for glucosidase, oxidoreductase, B cell receptor, and translation regulator activities, as well as activities of other receptors. In addition, GO CC analysis showed that the DEGs were significantly enriched in the Golgi apparatus, integral to the plasma membrane, lysosomal membranes, endoplasmic reticulum, and others.
KEGG pathway analysis of DEGs
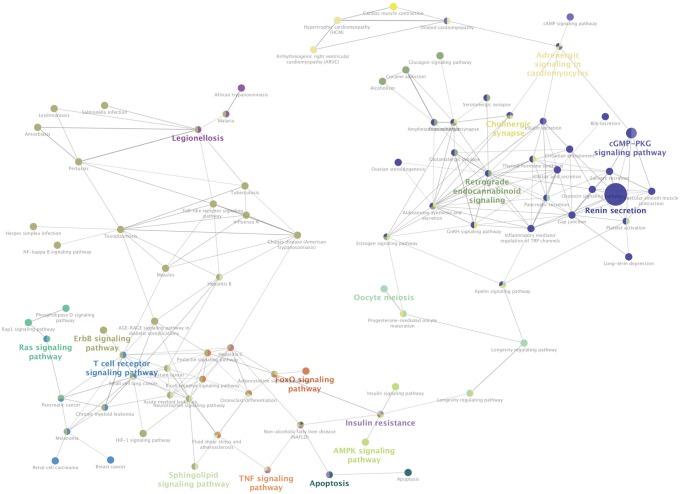
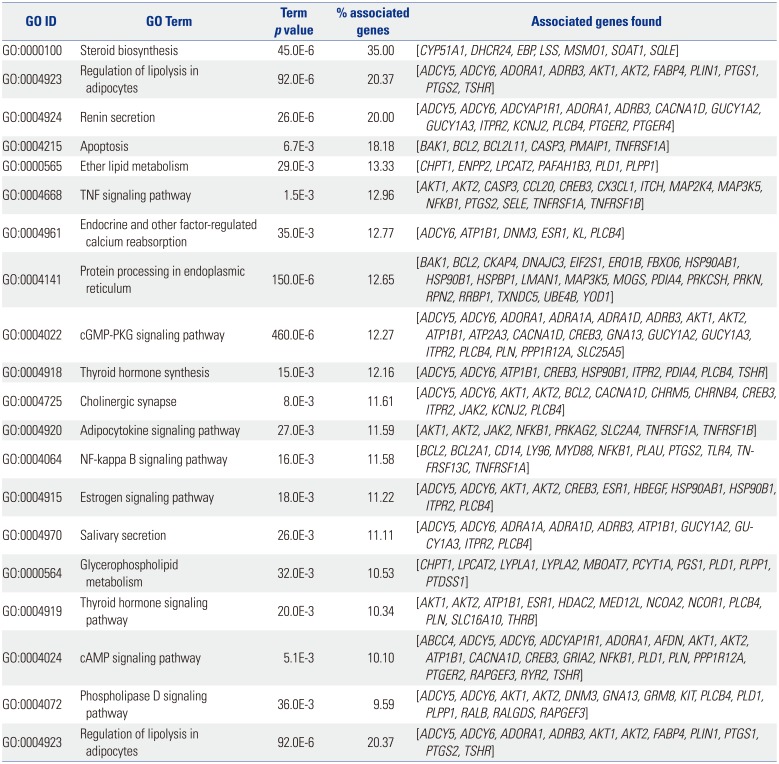
The result of KEGG pathway analysis revealed that target genes were enriched in steroid biosynthesis, regulation of lipolysis in adipocytes, renin secretion, apoptosis, ether lipid metabolism, the TNF signaling pathway, endocrine and other factor-regulated calcium reabsorption, protein processing in the endoplasmic reticulum, the cGMP-PKG signaling pathway, thyroid hormone synthesis, cholinergic synapses, the adipocytokine signaling pathway, the NF-kappa B signaling pathway, the estrogen signaling pathway, salivary secretion, glycerophospholipid metabolism, the thyroid hormone signaling pathway, the cAMP signaling pathway, the phospholipase D signaling pathway, regulation of lipolysis in adipocytes, the PI3K-Akt signaling pathway, and the MAPK signaling pathway. Most of the pathways were not reported in any previous study, and only the NF-kappa B signaling pathway, the PI3K-Akt signaling pathway, and the MAPK signaling pathway would be considered well-known pathways in the development or progression of OA. These key pathways are shown in Fig. 4. These core pathways and their associated genes are summarized in Table 2. The first-ranking steroid biosynthesis signaling pathway accounted for 35% of the associated genes, including CYP51A1, DHCR24, EBP, LSS, MSMO1, SOAT1, and SQLE.
Interaction network of DEGs and core genes in the interaction network
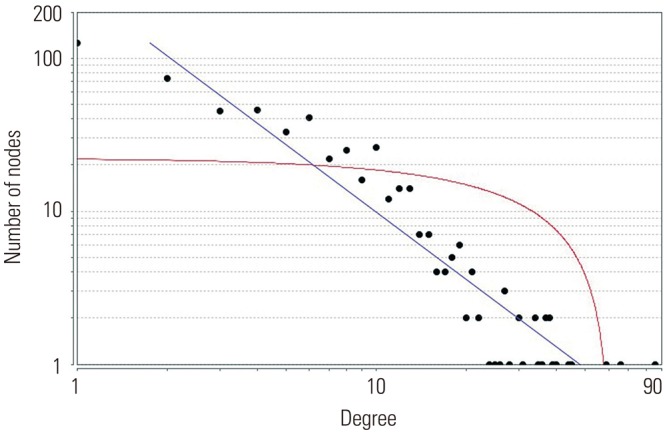
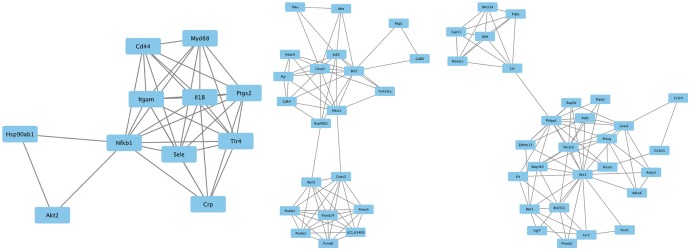
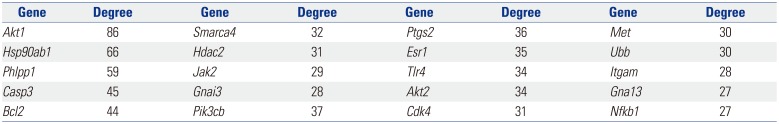
Based on information in the STRING database, the gene interaction network contained 757 nodes and 1947 edges. The nodes indicated the DEGs, and the edges indicated the interactions among the DEGs. NetworkAnalyzer in Cytoscape software was used to analyze these genes, and core genes were ranked according to the predicted scores. The top 20 high-degree hub nodes included AKT1, HSP90AB1, PHLPP1, CASP3, BCL2, SMARCA4, HDAC2, JAK2, GNAI3, PIK3CB, PTGS2, ESR1, TLR4, AKT2, CDK4, MET, UBB, ITGAM, GNA13, and NFKB1. Among these, AKT1, CASP3, BCL2, JAK2, PTGS2, ESR1, TLR4, and AKT2 are well known in the development or progression of OA. AKT1 showed the highest node degree of 86. The core genes and their corresponding degrees are shown in Table 3. The distribution of core genes in the interaction network is shown in Fig. 5. The correlation between data points and corresponding points on the line was approximately 0.893. The R-squared value was 0.887, suggesting relatively high confidence that the underlying model was indeed linear. Then, we used MCODE to screen the modules of the gene interaction network, and the top three modules are shown in Fig. 6.
Genes expression validation by qRT-PCR
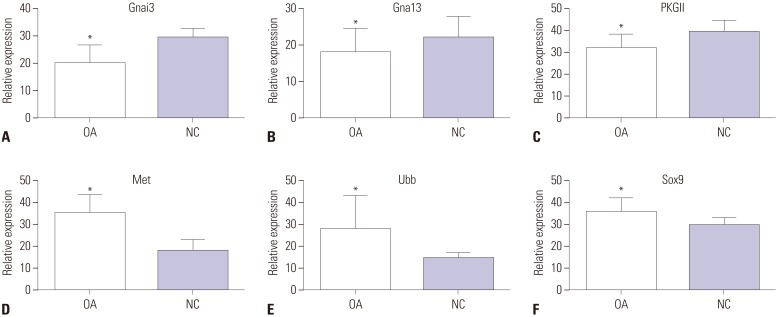
To validate the bioinformatic analysis results, qRT-PCR was used to quantify parts of the explored genes, including two upregulated genes (MET, UBB) and two downregulated genes (GNAI3, GNA13). As shown in Fig. 7, the mRNA expression patterns of Met, Ubb, Gnai3, and Gna13 detected by qRT-PCR significantly accorded with the corresponding gene alteration of microarray data (p<0.05). In addition, mRNA expression levels of PKGII and Sox9 in OA knee cartilage were detected by qRT-PCR: PKGII was downregulated and Sox9 was upregulated in the OA knee cartilage groups, compared with the normal knee cartilage groups (p<0.05).
DISCUSSION
OA is a progressive disease of the joints characterized by the breakdown of the cartilage matrix, chondrocyte hypertrophy, and ectopic growth of bony structures in the joints.78 Chondrocyte apoptosis is largely responsible for cartilage degeneration in OA. In the present study, the gene expression profile of GSE103416 was downloaded and a bioinformatics analysis was performed. The results revealed 99 DEGs in OA knee cartilage samples, compared with normal controls. Furthermore, GO, KEGG pathway, and gene-gene interaction network analysis were performed to identify biomarkers or the major genes related to cytogenetic pathways in cartilage degeneration associated with OA.
To elucidate the underlying differences in molecular mechanisms between OA knee cartilage and normal cartilage, we characterized the possible GO functional terms and signaling pathways of DEGs. Considering the results of GO function analysis, we linked the DEGs with the following processes: protein metabolism, signal transduction, and apoptosis, all of which would likely be important for the development of OA. Similar to what previous articles reported, our KEGG pathway analysis showed that the PI3K-Akt signaling pathway, the NF-kappa B signaling pathway, the MAPK signaling pathway, and others were among the most relevant pathways for OA. Xu, et al.9 found that high expression of Sam68 promoted NF-kappa B signaling activation, catabolic gene expression, and cellular apoptosis in TNF-α-treated chondrocytes, providing insight into the pathophysiology of OA, as well as a potential target for its treatment. He and Cheng10 showed that miR-20 had an important role in the pathogenesis of OA, inhibiting chondrocyte proliferation and autophagy by targeting ATG10 via the PI3K/AKT/mTOR signaling pathway. Li, et al.11 found that low-intensity pulsed ultrasound treatment promoted cartilage repair in OA via downregulation of the MAPK signaling pathway. All these signaling pathways have been reported to play important roles in molecular mechanism of degenerative processes in OA knee cartilage.
Notably, there was abundant evidence of DEGs in OA knee cartilage that have been proven to play important roles during the pathological process of OA. The STRING database revealed the top 20 high-degree hub nodes of DEGs, including AKT1, HSP90AB1, PHLPP1, CASP3, BCL2, SMARCA4, HDAC2, JAK2, GNAI3, PIK3CB, PTGS2, ESR1, TLR4, AKT2, CDK4, MET, UBB, ITGAM, GNA13, and NFKB1. Furthermore, we analyzed the gene interaction network and the top three modules using MCODE, and found that PTGS2, ESR1, TLR4, and AKT2 were the core interaction genes for OA. This finding was in accordance with our STRING database results. Chondrocyte apoptosis is largely responsible for cartilage degeneration in OA. Xue, et al.12 found that lactoferrin triggered CREB1 phosphorylation in IL-1β-induced human articular chondrocyte apoptosis through AKT1 signaling. Bradley, et al.13 showed that Phlpp1 deficiency increased Akt2 activity, diminishing FoxO1 levels and inducing Fgf18 expression to stimulate Erk1/2 activity and chondrocyte proliferation. They also found that Phlpp1 deficiency protected against OA progression, while CpG demethylation and inflammatory responses promoted Phlpp1 expression.14 By histological analysis, TUNEL assay and immunohistochemical analyses of Casp3, Bcl-2, and Bax expression, Zhou, et al.15 found that berberine ameliorated cartilage degeneration and exhibited an anti-apoptotic effect on articular cartilage in a rat OA model. In Culley, et al.'s study,16 inhibition of class I HDACs (HDAC-1, HDAC-2, HDAC-3) by MS-275 or by specific depletion of HDACs repressed cytokine-induced metalloproteinase expression in cartilage cells and bovine nasal cartilage explants, resulting in inhibition of cartilage resorption. This result indicated that specific inhibition of class I HDACs was a possible therapeutic strategy in OA. In addition, Zhang, et al.17 found that leptin induced apoptosis of chondrocytes in an in vitro model of OA via the JAK2/STAT3 signaling pathway. Valdes, et al.18 performed a case-control study of men and women with clinical knee OA genetic associations in 12 candidate genes previously reported to be associated with OA, and found that ESR1 and other genes might be helpful in identifying women who were at high risk of developing knee OA. The expression of TLR4 in cartilage was increased throughout the development of OA, and many TLR4 agonists that have been identified in the joints of patients with OA induced inflammatory responses in ex vivo tissue samples from these patients.19 Schneider, et al.20 found that the promoter variant of the COX-2/PTGS2 gene was associated with a lower risk for end-stage hip and knee OA. CDK4 also correlated with the disease grades of knee OA in Zhu, et al.'s studies.21 Taken together, AKT1, PHLPP1, CASP3, BCL2, HDAC2, JAK2, PTGS2, ESR1, TLR4, and AKT2 genes have been reported to take part in the development of OA.
Similar bioinformatics analysis in mouse models or human cartilage has contributed to further revealing genes important in OA. Using GSE48556 data, Feng and Lian22 found that DEGs, such as PDGFRB, IFNG, EGR1, FASLG, and H3F3B, may be potential targets for OA diagnosis and treatment. Using four gene expression profiling datasets and verification of qRT-PCR, Tian23 found that TWIST1, POU2F1, SMARCA4, and CREBBP may play important roles in OA pathology, and SMARCA4 was also reported in our study. Mi, et al.24 reported that their top 10 hub genes were UBC, RPL23A, mammalian target of rapamycin, HSP90AB1, RPS28, RPL37A, RPS24, RPS4X, RPS18, and UBB. Of these genes, HSP90AB1 and UBB were also reported in our study. In addition, another four bioinformatics analyses identified AGT, CXCL12, KDM2B, VEGFA, JUN, JUNB, PISD, RARRES3, EIF4G1, EPHA3, KIF2C, KIF11, KIF20A, PTTG1, MAP2K6, PPP3CC, and CSNK1E as potentially essential genes associated with the pathogenesis of knee OA.25262728
Bioinformatics analysis alone is insufficient, and corresponding in vitro or in vivo experiments should be added.29 To further validate our results, qRT-PCR was performed for two upregulated genes (MET, UBB) and two downregulated (GNAI3, GNA13), which proved expression changes of these four genes were in accordance with the microarray data. Interestingly, according to the KEGG pathway results, GNA13 was associated with the cGMP-PKG signaling pathway, which has not been reported in research on OA development or progression. Previous reports showed that the cGMP-PKG signaling pathway is related to chondrocyte function, shedding light on a novel role of PKGII as a molecular switch, coupling the cessation of proliferation and the start of hypertrophic differentiation of chondrocytes through the attenuation of Sox9 function.3031 Hence, we detected mRNA expression levels of cGMP-dependent protein kinases type II (PKGII) and Sox9 in OA knee cartilage, and verified decreased PKGII expression and increased Sox9 expression in the OA knee cartilage groups, indicating that the cGMP-PKG signaling pathway may contribute to the development of OA in cartilage. Further validation, however, is required.
In summary, 99 DEGs were identified, including 76 upregulated DEGs and 23 downregulated DEGs, between OA knee cartilage and normal cartilage in a rat model. GO and KEGG pathway analysis provided a series of related key genes and pathways to contribute to the understanding of the molecular mechanisms of OA knee cartilage degeneration or apoptosis, yielding clues suggesting that the genes MET, UBB, GNAI3 and GNA13, as well as the cGMP-PKG signaling pathway, are highly correlated with the development of OA in cartilage.
 XML Download