

 PDF
PDF ePub
ePub Citation
 Print
Print


INTRODUCTION
Hypertension is a major underlying cause of cardio-cerebrovascular diseases, such as myocardial infarction, congestive heart failure, peripheral vascular disease, and stroke.12 The American Heart Association has estimated that about 32.6% of American adults over 20 years of age are hypertensive;2 the Korean Ministry of Health and Welfare determined the recent prevalence of hypertension in Korean adults to be 25.5%.3 Elevated blood pressure (BP) was the leading single risk factor of worldwide economic burden of disease.4 According to a massive-scale observational study in Korean male adults, the population-attributable fraction of hypertension for the risks of cerebrovascular diseases and ischemic cardiovascular diseases were 35% and 21%, respectively.5
Therefore, it is important to recognize BP trends and demographic factors in the general population to promote public health and create health policies. According to a recent study,6 the age-adjusted prevalence of hypertension in US adults was 29.0% in 1999–2000 and 30.5% in 2007–2008; this was not a statistically significant increase. Although the prevalence of hypertension varies widely among different ethnic populations,7 there have been only a few investigations of hypertension prevalence,89 and few have addressed recent trends in BP or hypertension in Korea based on representative data.
The purpose of this study was to investigate the long-term diachronic trends of BP and hypertension prevalence among Korean adults using data from the Korean National Health and Nutrition Examination Survey (KNHANES) I–VI. We examined the same results after stratifying the participants according to anti-hypertensive medication to exclude the treatment effect on the trends in BP.
MATERIALS AND METHODS
Subjects
The KNHANES is a nationally representative, cross-sectional survey that is conducted by the Korean Ministry of Health and Welfare every three or four years: the KNHANES Phase I (1998), II (2001), III (2005), IV (2007–2009), V (2010–2012), and VI (2013–2015) studies. Data from 1998–2014 were included in this study. The KNHANES contains a Health Interview Survey, a Health Behavior Survey, a Health Examination Survey, and a Nutrition Survey. Using household registries, the KNHANES stratified and collected households as sampling units through a multistage, probability-based sampling design based on sex, age, and geographic area.10 To achieve an equal probability of being selected, statistical weights were assigned to each participant, which allows the results to represent the entire Korean population.1011 When this survey was performed, written informed consent to use these data in further analyses was obtained. All participants had the right to refuse to take part in the study, in accordance with the National Health Enhancement Act.
Of the 177056 participants of the KNHANES I–VI, we excluded those who were younger than 30 years (n=69205) and those who did not have full information regarding BP (n=51774). After these exclusions, 56077 participants (23974 men and 32103 women) were included in the final analysis. This study protocol conformed to the ethical guidelines of the 1975 Declaration of Helsinki. The Institutional Review Board of the Korea Centers for Disease Control and Prevention (KCDC) approved this study.
Measurement and definitions of blood pressure and hypertension
In KNHANES, BP was measured by 135 nurses from the Korea Association of Health Promotion and Public Health Centers in phases I to III, and was performed by four nurses in charge of BP measurement in the special investigation department of KCDC starting in phase IV. The BP used in this study was not measured by automatic sphygmomanometer, but by a special investigator using a standard mercury sphygmomanometer (Baumanometer; Baum Co., Inc., Copiague, NY, USA) with the participants in a sitting position after he or she had rested for at least 10 minutes. In all participants, the BP was measured on two separate occasions at 5-minute intervals in a quiet atmosphere. The mean of these two measurements was adopted for the data analysis. The KCDC has been strengthening the quality control of BP measurement since 2011, introducing a certification system and continuously standardizing BP measurement and the survey environment.
The definition of hypertension was based on the Seventh Report of the Joint National Committee (JNC VII) criteria12 as follows: systolic blood pressure (SBP) ≥140 mm Hg, diastolic blood pressure (DBP) ≥90 mm Hg, or use of anti-hypertensive medications. The range of BP was stratified into three categories: 1) less-than-normotensive BP, SBP <120 mm Hg and DBP <80 mm Hg; 2) less-than-hypertensive BP, SBP <140 mm Hg and DBP <90 mm Hg; and 3) hypertensive BP, SBP ≥140 mm Hg or DBP ≥90 mm Hg. It should be noted that a less-than-normotensive BP and a less-than-hypertensive BP were not mutually exclusive.
Measurement of other anthropometric and laboratory data
Well-trained medical staff members obtained the anthropometric measurements following standard procedures that were consistent across every phase of the KNHANES. Participants' body weight and height were measured to the nearest 0.1 kg and 0.1 cm, respectively, while the participants wore light indoor clothing without shoes. The body mass index (BMI) was calculated as the ratio of weight in kilograms to height in squared meters (kg/m2).
Blood samples were collected from the antecubital vein in the morning after an overnight fast. Fasting plasma glucose, total cholesterol, triglyceride (TG), and high-density lipoprotein-cholesterol (HDL-C) levels from all participants were measured enzymatically using a Hitachi 747 chemistry analyzer (Hitachi, Tokyo, Japan) in the 1998 and 2001 studies, using an ADVIA 1650/2400 (Siemens, New York, NY, USA) in the 2005 and 2008, using a Hitachi Automatic Analyzer 7600 (Hitachi, Tokyo, Japan) in the 2008 and 2012, and using a COBAS 8000 C702 (Roche Diagnostics System, Rotkreuz, Switzerland) in the 2013 and 2014 reports.
Health-related lifestyles
Information on health-related lifestyles was obtained from data gathered using the self-reported questionnaire during the interview portion of the survey. Physical activity was assessed using the Korean version of the International Physical Activity Questionnaire (IPAQ).13 In this study, we classified the level of physical activity as “sufficient activity.” An individual who met at least one of the following two criteria was considered a part of the sufficient activity group, and would have originally been categorized in the “moderate activity” group according to the official IPAQ protocol:14 1) three or more days per week of vigorous activity for at least 20 minutes per day or, 2) five or more days per week of moderate-intensity activity or walking for at least 30 minutes per day.
Because the design of the questionnaire was different from other survey periods and because there were no questions to assess walking activity, we used modified criteria that excluded the comment of walking activity on the KNHANES I. Individuals who consumed over more than seven glasses for males and five glasses for females of any alcoholic beverage at least twice per week were categorized into the heavy alcohol-drinking group. Individuals who smoked cigarettes during the relevant survey period were placed into the current smoking group. Individuals who taking diabetes mellitus or lipid-lowering medication were categorized into anti-diabetic or anti-dyslipidemic medication groups. Anti-dyslipidemic medication has only been investigated since 2005.
Measurement of daily total calorie intake and sodium intake
Nutrient intake levels, including the daily calorie and sodium intakes, were assessed using 24-hour dietary recall methods administered by trained interviewers. The dietary questionnaire was conducted during face-to-face interviews, and included the type, amount, and frequency of foods or drinks consumed during the previous day. Data on food items were converted to the form of units of nutrients using the Food Composition Table developed by the National Institute of Agricultural Sciences (7th revision) and the database of the Korea Health Industry Development Institute for instant foods and imported foods.1516
Data management and statistical analysis
To achieve an equal probability of being selected, statistical weights were assigned to each participant, allowing the results of the KNHANES to represent the entire Korean population. Sampling weights were applied to account for the complex sampling method, which included stratification by district in the first step and stratification by sex and age during the second step. Furthermore, to avoid bias from changes in age and sex distributions in each phase, age and sex adjustments were applied to the Korean population distribution in the year 2005.
All data on continuous variables are presented as means±standard errors; one-way analysis of variance was used to compare the mean values of the continuous variables of BMI, SBP, DBP, fasting glucose, total cholesterol, TG, HDL-C level, and sodium intake across the KNHANES phases. Linear regression analyses were adopted to calculate the p for trend. Linear regression analyses for the p for trends and logistic regression analyses for the odds ratios (ORs) were also used. All analyses were conducted using SAS statistical software (version 9.2; SAS Institute Inc., Cary, NC, USA). We used SAS SURVEYREG and SAS SURVEYLOGSTIC to account for the survey design and the complex sampling weights. The ORs for less-than-normotensive or less-than-hypertensive BP of variable factors were determined by multiple logistic regression analyses. All statistical tests were two-sided, and statistical significance was set at a p-value <0.05.
RESULTS
The 56077 participants included in this study were distributed as follows: 6452, 5035, 4812, 14935, 15738, and 9105 from the KNHANES I to VI, respectively.
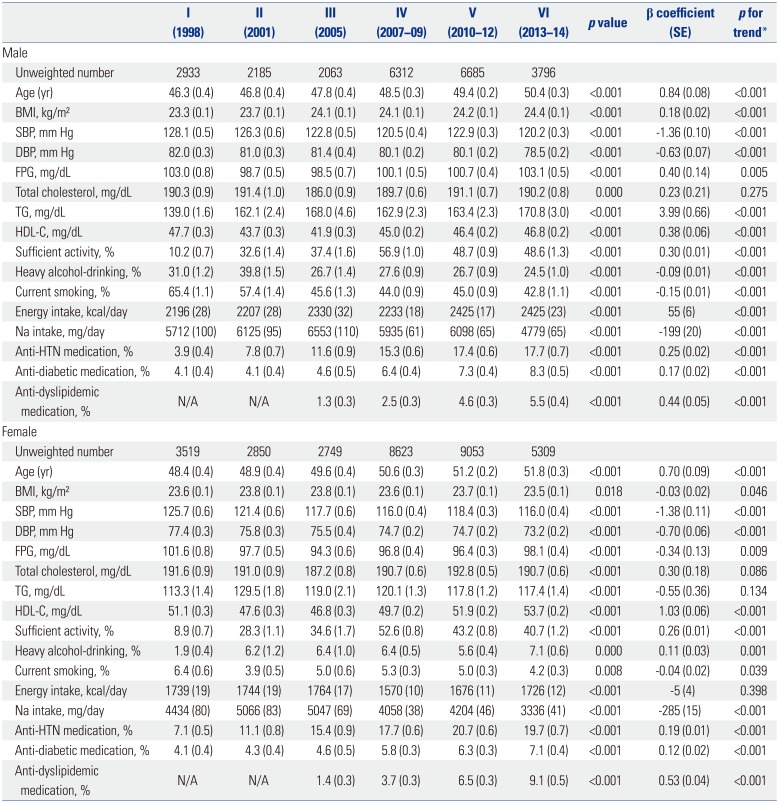
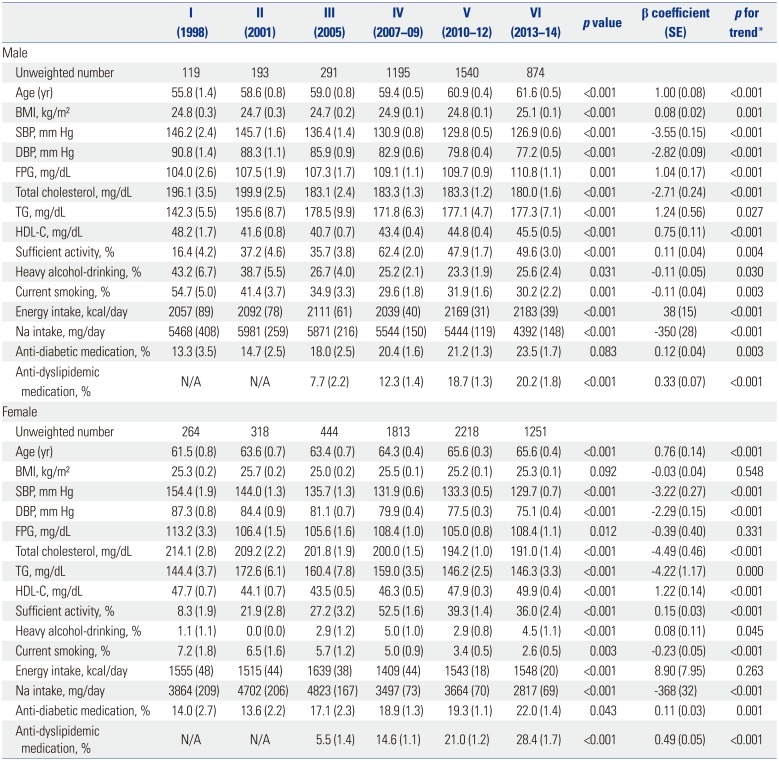
Table 1 shows the diachronic changes of participant characteristics according to KNHANES phase. In men, mean age and BMI increased over time in addition to fasting glucose, TG, and HDL-C levels. In contrast, in females, mean age and HDL-C increased whereas BMI and mean fasting glucose levels decreased. However, in both sexes, the mean SBP and DBP values showed a downward trend from the KNHANES I to VI (SBP in males: 128.1, 126.3, 122.8, 120.5, 122.9, and 120.2 mm Hg and DBP in males: 82.0, 81.0, 81.4, 80.1, 80.1, and 78.5 mm Hg; SBP in females: 125.7, 121.4, 117.7, 116.0, 118.4, and 116.0 mm Hg and DBP in females: 77.4, 75.8, 75.5, 74.7, 74.7, and 73.2 mm Hg from the KNHANES I to VI, respectively; all p-values for trend <0.001). In both sexes, the average amount of daily sodium intake significantly decreased from the KNHANES I to VI (β-coefficient=−199, p for trend <0.001 for men; β-coefficient= −285, p for trend <0.001 for women).
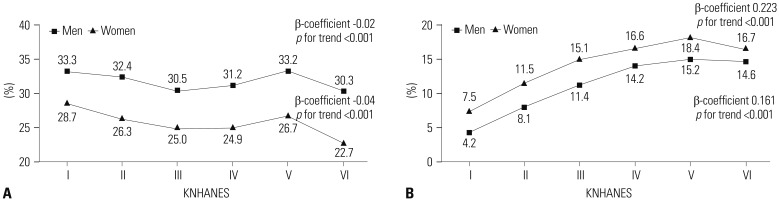
Fig. 1 displays the age-standardized prevalences of hypertension and of anti-hypertensive medication use. In Fig. 1A, the male prevalence of hypertension changed decreased significantly (33.3, 32.4, 30.5, 31.2, 33.2, and 30.3%, β-coefficient=−0.02, p for trend <0.001) and that in females tended to decrease (28.7, 26.3, 25.0, 24.9, 26.7, and 22.7%, β-coefficient=−0.04, p for trend <0.001) from the KNHANES I to VI. The percentage of male participants with anti-hypertensive medication significantly increased (β-coefficient=0.223, p for trend <0.001) (Fig. 1B). The trend for the percentage of female participants with anti-hypertensive drugs was similar to the trend for male participants (β-coefficient=0.161, p for trend <0.001).
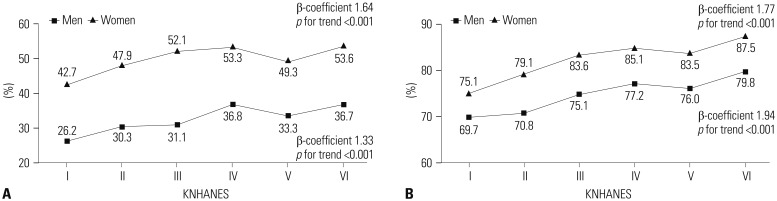
Fig. 2 displays the percentages of participants with less-than-normotensive BP (SBP <120 mm Hg and DBP <80 mm Hg) and less-than-hypertensive BP (SBP <140 mm Hg and DBP <90 mm Hg) irrespective of anti-hypertensive medication according to KNHANES phase. The percentages of less-than-normotensive and less-than-hypertensive BP increased in both sexes: less-than-normotensive BP, 26.2, 30.3, 31.1, 36.8, 33.3, and 36.7% in men (β-coefficient=1.33, p for trend <0.001) and 42.7, 47.9, 52.1, 53.3, 49.3, and 53.6% in women (β-coefficient= 1.64, p for trend <0.001), as shown in Fig. 2A; less-than-hypertensive BP, 69.7, 70.8, 75.1, 77.2, 76.0, and 79.8% in men (β-coefficient=1.94, p for trend <0.001) and 75.1, 79.1, 83.6, 85.1, 83.5, and 87.5% in women (β-coefficient=1.77, p for trend <0.001), as shown in Fig. 2B.
We stratified all participants into two groups (participants taking anti-hypertensive medication and those who do not) to eliminate the effect of anti-hypertensive medication on trends in mean BP. Table 2 shows the diachronic trends of participant characteristics in the population taking anti-hypertensive medication. In men, mean age, BMI, fasting glucose, TG, and HDL-C levels increased, while the mean values of SBP, DBP, and total cholesterol level decreased. In addition, the percentage with sufficient activity also increased. In contrast, the average amount of daily sodium intake and the percentage of heavy alcohol drinkers and current smokers significantly decreased. In females, mean age increased, while mean BMI and fasting glucose did not reveal any significant trends. The mean values of SBP, DBP, total cholesterol, and TG levels were decreased; however, the mean levels of HDL-C increased in females. The fraction with sufficient activity and heavy alcohol drinkers tended to increase, while the rate of current smokers decreased. The average amount of daily sodium intake was also significantly reduced in females as well as in males.
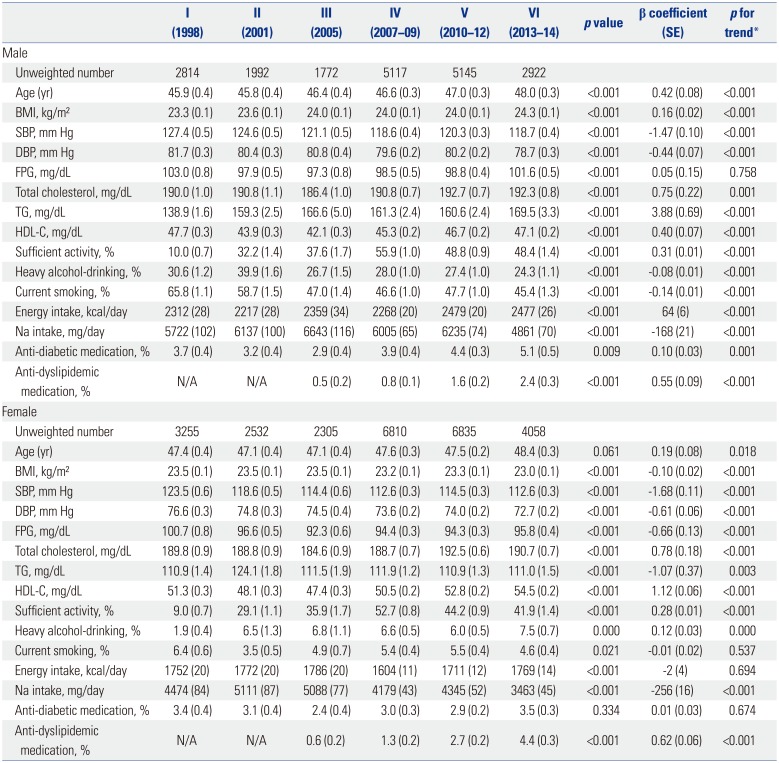
Table 3 outlines diachronic trends of participant characteristics of individuals not taking anti-hypertensive medication. In males, mean age, BMI, total cholesterol, TG, and HDL-C levels increased significantly according to KNHANES phase, while mean SBP and DBP decreased. The average amount of daily sodium intake showed a decrease during the study period. In females, mean age, total cholesterol, and HDL-C level increased according to KNHANES phase, while BMI, fasting glucose, and TG level significantly decreased. Like males, mean SBP and DBP had a tendency to decrease in females. In addition, the average daily sodium intake significantly decreased.
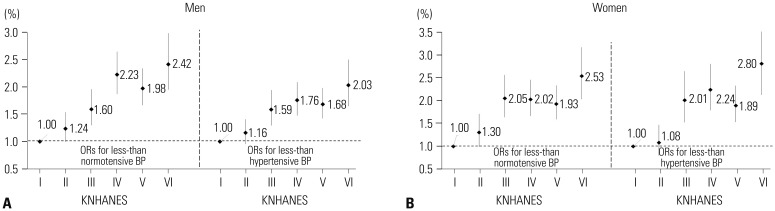
Fig. 3 displays the ORs for each BP category according to KNHANES phase: 1) less-than-normotensive BP and 2) less-than-hypertensive BP, after adjusting for age, BMI, fasting plasma glucose, total cholesterol, sufficient activity, heavy alcohol drinking, smoking status, energy intake, and sodium intake. Compared to the KNHANES I, the ORs (95% CIs) of the KNHANES II to VI for less-than-normotensive and less-than-hypertensive BP increased in both sexes.
Supplementary Table 1 (only online) shows the results of multivariate logistic regression analysis of factors associated with less-than-normotensive or less-than-hypertensive BP. In both sexes, less-than-normotensive or less-than-hypertensive BP were negatively associated with age, BMI, fasting glucose, total cholesterol, and heavy alcohol-drinking, except fasting glucose for women in less-than-hypertensive BP.
DISCUSSION
In this study, we found that the average BP levels in both sexes aged 30 years or older decreased regardless of current use of anti-hypertension medication over 16 years of the KNHANES study. Though the percentage of participants on anti-hypertensive medication increased, hypertension prevalence followed a marked downward trend in both sexes. From 1998 to 2014, the mean SBP and DBP in men decreased by 7.9 mm Hg and 3.5 mm Hg, while those in women decreased by 9.7 mm Hg and 4.2 mm Hg, respectively. This lower pattern of BP was identical after stratification according to use of anti-hypertensive medication in both sexes. Also, less-than-normotensive and less-than-hypertensive BP in both sexes showed increasing trends according to KNHANES phase, regardless of various covariates.
Hypertension is one of the chronic non-communicable diseases that are intricately interrelated with individual, socioeconomic, and environmental factors, in addition to genetic factors. Danaei, et al.17 investigated global trends in SBP with 786 country-years and 5.4 million participants. They reported that there were significant variations across regions and countries: SBP was currently highest in low- and middle-income countries and lowest in high-income countries. At the individual level, excessive fat and carbohydrate intake, obesity, emotional stress, and its biological reactants are well-known risk factors of hypertension.181920 On the other hand, a higher quality of public healthcare and growing interest in the self-management of personal health, such as a low-salt diet, regular physical activity, and smoking cessation, are known as preventive factors of hypertension.21
Downward trends in SBP and DBP were present and hypertension prevalence significantly decreased in both sexes between 1998 and 2014. The proportion of the adult population taking anti-hypertensives significantly increased during the same period. The proper use of anti-hypertensive drugs may contribute to decreasing the mean BP.
This study revealed positive changes in individual lifestyle factors and anti-hypertensive medication. According to a previous study22 on trends of sodium intake in Korea, mean sodium intake did not change significantly between 1998 and 2009 (4.6 vs. 4.7 g per day). In contrast, Tables 1, 2, and 3 in our study using more recent data showed that daily sodium intake significantly decreased in both sexes between 1998 and 2014 (All p for trend <0.001). A low-sodium diet could lower BP not only in hypertensive, but also in normotensive individuals.23 Because the average amount of daily sodium intake by Koreans has reached more than two times the amount recommended by the World Health Organization,24 decreasing sodium consumption in Korean is more important. We noted a pattern of high sodium intake; however, these decreasing trends would have affected decreasing BP trends, despite the non-significant relationship shown in Supplementary Table 1 (only online) of this cross-sectional study. Alcohol-drinking and cigarette-smoking habits in this study were improved in the all male subgroup of participants. The Korean government has made many efforts to reduce alcohol- and cigarette-related conditions by enacting the “National Health Promotion Act” and the “Health Plan 2020.”25 A recent report from the KCDC stated that the numbers of male high-risk drinkers and current smokers have been decreasing annually since 2008.26 However, in the female population, heavy alcohol drinking seemed to increase gradually, and the trend of current smoking rates among participants without anti-hypertensive medication was not significantly changed. A possible explanation for this discrepancy might be that, unlike males, the numbers of female drinkers and smokers remain small in Korea.27 In addition, the increasing trends of female heavy drinkers and current smokers seem to be caused by underestimation in the KNHANES I and II. This study included relatively younger participants who comprise more current smokers and heavy alcohol drinkers, compared to older women. However, young women tend to naturally maintain their BP within the normal range despite unhealthier lifestyles. For these reasons, the increasing patterns in smoking and drinking in women would not significantly affect BP trends, unlike in men. Our results also revealed long-term upward trends in the amount of physical activity in both sexes. This increase in sufficient physical activity might have positively influenced the mean BP. The above-mentioned healthy lifestyle changes might have affected decreasing BP trends in Korean adults.
Some potential limitations should be considered when interpreting these findings. First, our study was a cross-sectional analysis; therefore, the diachronic causal relationships between the trends in this study cannot be guaranteed. Second, many participants (n=50730) were excluded due to missing BP measurement or anthropometric data. As a result, we could not fully exclude the possibility of selection bias. Third, in this study, there may be some errors in BP measurements. The BP values used in this study were not measured by an automatic sphygmomanometer, but by a special investigator using a mercury sphygmomanometer. The KCDC has been strengthening the quality control of BP measurement since 2011, introducing a certification system and continuously standardizing BP measurement and the survey environment. The KCDC plans to replace the standard mercury sphygmomanometer used at the actual health check-up site with an automatic sphygmomanometer in 2020, according to the Minamata Convention on Mercury of United Nations Environment Program. Nevertheless, changes in the screening environment and the BP measurement values may differ depending on the investigators. In addition, the BP readings were obtained on a single visit, so any variability in BP was not documented. BP measurements performed at a single visit usually overestimate the hypertension prevalence and underestimate the control rate,6 so some individuals may have been incorrectly assigned to a hypertension status. Fourth, we could not completely control all of the various factors that affect BP. We could analyze only the variables investigated in KNHANES. In addition, sodium intake was estimated based on the 24-hour dietary recall method. Although well-trained medical staff carefully checked the lifestyle data, such as sodium intake, there might be some errors. Despite the effort to minimize mistakes or errors, measurement errors could affect these findings. Fifth, estimative errors may have occurred due to the nature of the self-reported information in the KNHANES, especially information on the use of anti-hypertensive medication. For the same reasons, the use of a 24-hour recall method to assess dietary energy and sodium intake might not represent actual circumstances. To achieve an appropriate assessment of participants' habitualdiets, Holmes, et al.28 recommended at least four repeat measurements of a 24-hour recall method. However, this methodology was originally designed to estimate group mean dietary intakes, not for surveying individual habitual diets; therefore, it may likely be adequate for estimating long-term trends in diet and nutrition among large survey groups. Sixth, the parameters of lifestyle-related factors, which include drinking, smoking, and physical activity, were not measured over the same relevant phase. For example, the KNHANES I and II assessed the habitual alcohol intake using the number of bottles for the amount and the monthly counts for the frequency, which was an entirely different system than the conventional scales presented as the number of glasses by week in the latter survey periods. Therefore, we adjusted the old data to match the current scales. Finally, because of the limitations of data from KNHANES, we were unable to conduct detailed subanalysis of anti-hypertensive medications or anti-dyslipidemic medications, such as statins, which likely contribute to BP trends.
Despite these limitations, the present study had several strengths. This is the first study to describe long-term trends in BP level and prevalence of hypertension among general Korean adults. In contrast with previous studies, we investigated the cross-sectional data of six consecutive nationwide qualified surveys conducted every three or four years during a 16-year period using a similar methodology. The general trends use representative data with time sequence-weighting and age standardization, which contribute to a greater understanding of the epidemiological situation and establishing effective interventions and public health policies on BP and hypertension in Korea. Our research revealed an ameliorative trend in nationwide health status in Korea for recent years, which has become more similar with other developed countries, driven by improved health habits. This implies that the modified direction of public health policy of Korea toward more weighting individualized and personalized education and encouragements for lifestyle changes, rather than just enhancing medical accessibility.
In summary, the average BP in both sexes and the prevalence of hypertension showed marked downward trends during the 16-year period. Also, less-than-normotensive and less-than-hypertensive BP in both sexes had increasing trends according to KNHANES phase. Constant declines in the mean BP regardless of anti-hypertensive medication along with improvements in several lifestyle factors in both sexes were also noted. A national preventive approach based on lifestyle modifications may also be needed to reduce hypertension in Koreans.
 XML Download