

 PDF
PDF ePub
ePub Citation
 Print
Print


INTRODUCTION
Paraquat is a non-selective herbicide that is widely used in agriculture, because it is fast acting and non-persistent in the environment. However, paraquat is also one of the herbicides commonly used for suicide. Worldwide, paraquat accounts for 20 deaths per million persons. Paraquat has been used in Korea for the past three decades, with an estimated 2000 toxic ingestions annually and an associated 60–70% mortality.1 As there are still no effective therapies to treat paraquat poisoning,2 various measures have been instituted in the effort to reduce the mortality rate thereof. The INTEON formulation, which contains a natural alginate that immediately gels in the gastric pH environment, was developed to reduce the gastrointestinal absorption of paraquat.3 However, this formulation did not significantly improve survival rates.4
There are controversies as to whether the restriction or sales ban of highly toxic pesticides could reduce the mortality from pesticide poisoning. A study conducted in India showed that restriction of pesticide availability and accessibility by non-pesticide management has the potential to reduce suicide attempts.5 However, research in Sri Lanka revealed a propensity to switch to using other pesticides that are often as toxic as the banned agent in agricultural practice.6
In Europe, the sale of paraquat has been banned since 2007. A study in France that analyzed poisoning-related cases that occurred 4.5 years before and after the sales ban revealed only a slight decrease after the sales ban.7 The decrease was found mostly in unintentional poisoning cases. In Korea, the complete ban of paraquat product sales took effect in 2012. The pesticide-related suicide mortality decreased from 5.26 to 2.67 per 100000 population between 2011 and 2013.8 A single-center study showed that the total number of suicide attempts decreased, and the proportion of paraquat- to pesticide-related suicide attempts decreased from 63.4% to 24.5% from 2011 to 2014.9 The purpose of this study was to evaluate the effect of the paraquat ban on the incidence and mortality of herbicide poisonings in Korea.
MATERIALS AND METHODS
Study setting
In Korea, herbicide sales are managed by a notification system and not a licensing system. Since 1999, the Korean government has set restrictions on herbicide handling, such as increasing the required qualifications of sellers and recording the personal information of buyers, to strengthen paraquat management. However, this strategy has proven insufficient.
The paraquat ban was implemented in two stages in Korea. First, the registration of all products containing paraquat was canceled in November 2011; however, the sales and use were permitted for 1 year. Then, a complete sales ban was instituted in November 2012, after which all remaining products were recovered from sellers.
Data collection
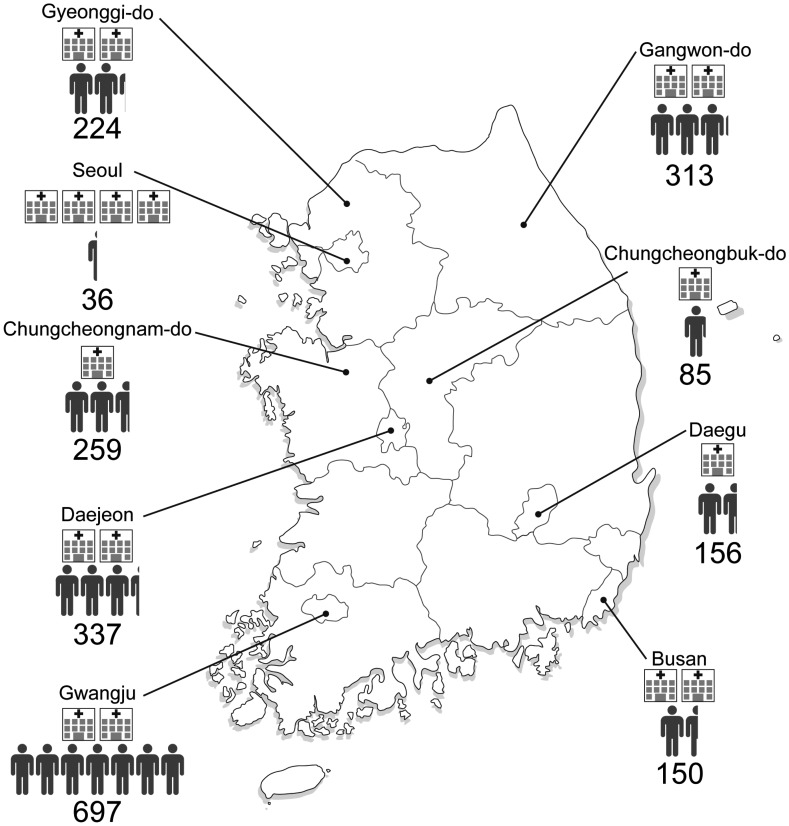
The present study was a multicenter, retrospective, cohort study. From the Korean Society of Clinical Toxicology, the hospital centers were selected after verifying the willingness of the clinical toxicologists in each hospital to participate. We selected 17 hospitals across the country to determine the national distribution of paraquat poisoning: four in Seoul; two each in Gyeonggi-do, Busan, Daejeon, Gwangju, Chungcheong Province (Chungcheongnam-do, Chungcheongbuk-do), and Gangwon-do; and one in Daegu (Fig. 1).
This study was approved by the Institutional Review Board (IRB), which waived the requirement for informed consent (3-2014-0302). In addition, all the hospitals that participated in the study were approved by the IRB. The patient medical records were reviewed by a clinical toxicologist at each hospital in the study, and the data were entered into the study database. The collected data were classified according to the selection criteria by two reviewers.
Subject
Among the patients who visited the emergency departments of the selected hospitals between January 2010 and December 2014, the data for those with herbicide poisoning were electronically retrieved using a final diagnostic code for toxic effects of herbicides and fungicides (ICD-10 code, T60.3). In addition to paraquat, we also collected herbicide poisoning-related information irrespective of age and sex to see if the poisoning by other herbicides increased after the paraquat ban. If the name of the exposure product or ingredient was an herbicide, it was included in the investigation, even if the exposure dose was unknown. All routes of exposure, such as the skin, eye contact, and ingestion, were included. Patients exposed to unknown herbicide products or fungicides, as well as those with unknown outcomes (death or survival), were excluded.
Variables
We reviewed the medical records and extracted personal (admission date, age, and sex), poisoning-related (product name, route of exposure, ingestion amount, and intentionality), and outcome (death or survival) information. If we could not obtain information about survival from the provided medical record, a telephone survey was conducted. Exposure routes were classified into ingestion and other groups. Ingestion amounts were classified as less than 50 mL, 50 mL or more, 100 mL or less, 100 mL or more, and unknown. These measurements were determined from the practice of recording ingestion amounts usually recorded based on the volume of one soju glass, which is 50 mL. Then, to determine the difference in changes among herbicide types, the toxic substances were classified into paraquat, glyphosate, glufosinate, and other groups.
To account for the changes in the quantities sold and used, glyphosate and glufosinate, which are non-selective herbicides similar to paraquat, were included in the herbicide group of substances that can be substituted for paraquat. Furthermore, other substances such as bentazone sodium, 2-methyl-4-chlorophenoxyacetic acid, orthosulfamuron, fenoxaprop-P-ethyl, and mixtures of various agents were grouped together for the analysis since they were few. We defined the period before the paraquat ban as from January 2010 to November 2012 while the period after the ban was defined as December 2012 to 2014.
Statistical analysis
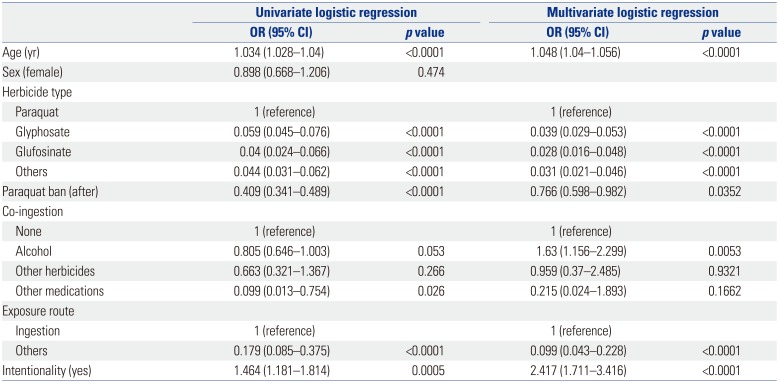
Data are presented as the mean±standard deviation or percentages. The mortality rate during the study period, the sex proportions, intentionality, and percentage of poisoning patients were calculated according to study region. We performed univariate logistic regression analysis to evaluate relationships between the demographic characteristics. Furthermore, we identified independent prognostic factors for death from herbicide intoxication using multivariable logistic regression analysis integrating major covariates (selected here as variables with a p<0.05), as indicated in the univariate analysis. In addition, factors commonly known to affect the prognosis of poisoning patients were included in the multivariate statistical analysis. The results are expressed as odds ratios (ORs) and 95% confidence interval.
Statistical Analysis Software (SAS) version 9.2 (SAS Institute, Cary, NC, USA) was used for all data analyses. Based on the mortality rates calculated for each drug type, a chi-square test was performed and a p value<0.05 was considered statistically significant. To determine any changes in the characteristics before and after the paraquat sales ban, a chi-square test and independent two-sample t-test were performed. A p value<0.05 was considered as statistically significant. To determine any significant changes in the mortality rates before and after the paraquat sales ban and their time points, R software, version 3.0.3 (package, bcp) was used to perform a Bayesian change point analysis, which divides time intervals to calculate the probability of change at each point. The Bayesian approach assumes prior distributions of the means in each block of the division, and then it estimates the probability of a change point and updates the posterior means based on the data, probabilities, and division blocks. The choice of a cut-off for the posterior probabilities can be subjective.1011
RESULTS
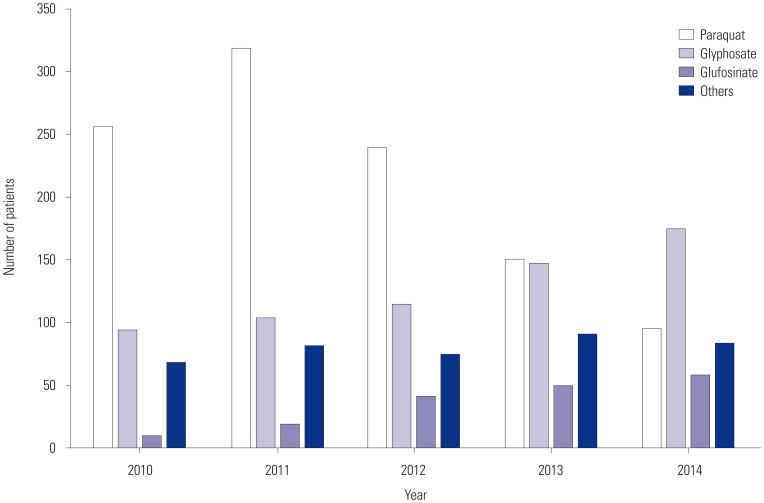
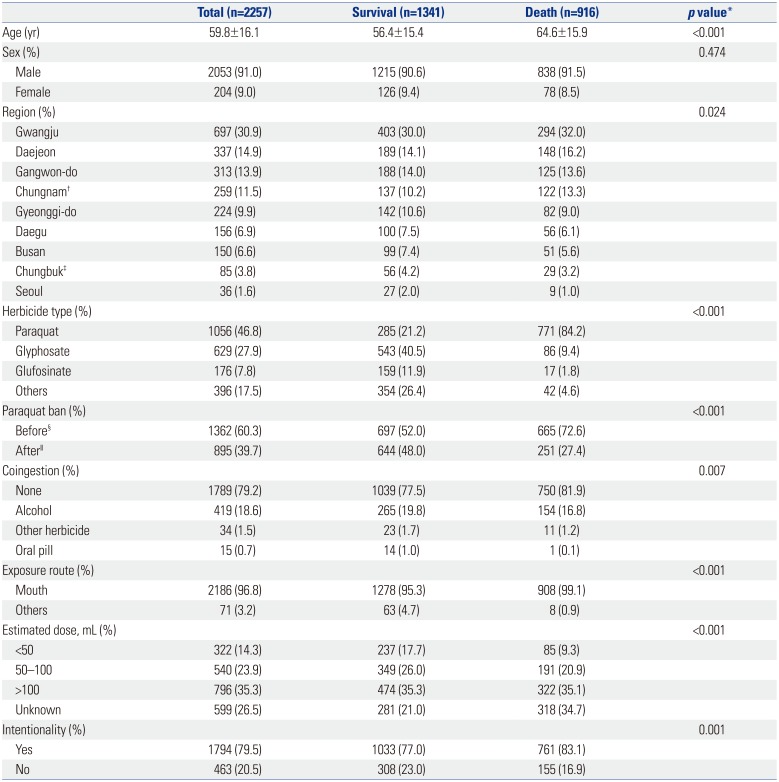
We enrolled 2257 patients with a mean age of 59.8±16.1 years; there was a higher number of male (90.9%) than female patients. Among the patients, 1794 (79.4%) intentionally ingested herbicides, and the number of poisoning cases was highest in Gwangju, followed by Daejeon and Gangwon Province in that order (Fig. 1). The products that patients were exposed to were paraquat 1056 (46.8%), glyphosate 629 (27.9%), glufosinate 176 (7.8%), and other agents 366 cases (16.2%), including 30 mixed poisonings. The study period was analyzed by separating each year to evaluate the changes in each herbicide poisoning (Fig. 2). Then, 60% of the patients were classified in the period “before paraquat ban.” The average patient mortality rate was 40.6%; the mortality rates for each herbicide were 73.0%, 13.8%, and 9.6%, for paraquat, glyphosate, and glufosinate, respectively.
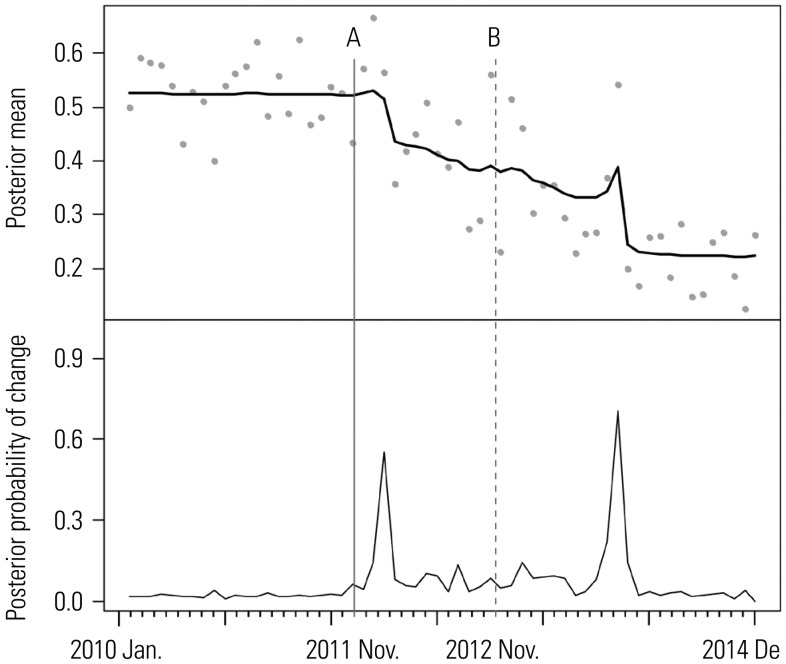
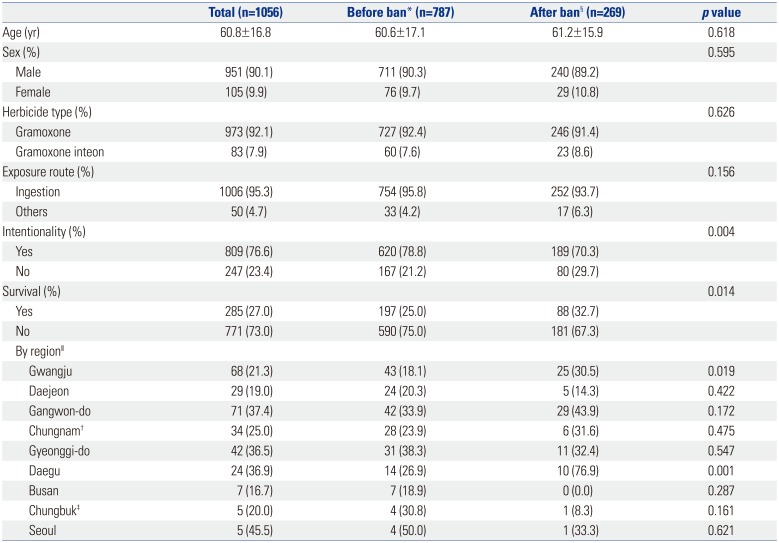
Among patients with paraquat poisoning, the mortality rate decreased from 74.9% before the ban to 67.3% in the period after it was instituted (p=0.014) (Table 1). The proportion of intentional poisonings significantly decreased after the paraquat ban (78.8% vs. 70.3%, p=0.004) (Table 1). There were significant differences in age, region, herbicide type, period, coingestion, exposure route, estimated dose, and intentionality between the survival and the mortality groups (Table 2). Multivariate logistic regression analysis confirmed that the period “after paraquat ban” was associated with lower herbicide mortality (OR=0.738, p=0.035) (Table 3). In the Bayesian change point analysis, a major increase in the change rate of herbicide mortality was observed in February 2012, approximately 3 months after the paraquat ban was enforced, which correlated with a prominent decrease in the mortality rate. Subsequently, the mortality rate decreased slightly and then stabilized until November 2013, when it dropped by a wide margin. This resulted in another major increase in the change rate that was higher than the previous change, which occurred approximately 1 year after the complete sales ban (Fig. 3).
DISCUSSION
Paraquat is widely used because it has a faster effect and is cheaper than other herbicides. The paraquat ban has limited the choice of herbicides available to farmers, which had the following confirmed effect: The number of paraquat poisonings gradually but distinctly decreased, while that of glyphosate, glufosinate, and other agents increased slightly (Fig. 2). Similar results were previously reported by Lee, et al.,9 who discovered a significant trend of increased annual number of suicides and proportion of suicides induced by glyphosates and glufosinates versus total herbicide. In addition, in this study, there was a significant difference in intentionality (p=0.004) and mortality (p=0.014) (Table 1). Another previous study revealed there was only a slight decrease in paraquat-related mortalities after its sale was banned in Europe from July 2007.7 Unlike the studies mentioned above, this study revealed that the epidemiology of herbicide poisonings changed after the paraquat ban. Since the ban would limit both accidental and intentional exposure, it was possible to objectively analyze the effects of the ban in that context. Our results suggest that the mortality rate changed according to the herbicide used, as data for accidental ingestion, as well as suicide, was included. These results seem to reflect the fact that the ban on toxic drugs alone has some limitations on reducing mortality.
A previous study by Cha, et al.8 reported that the ban on paraquat lowered the pesticide suicide rate from 2011–2012. That study had limitations, such as a short study period and the enrollment of only patients who attempted suicide, although the results were similar to those of the present study. According to the multivariate logistic regression analysis in this study, intentionality and herbicide type were expected to affect the death rate from herbicide poisoning. Intentional ingestion was reduced from 78.8% to 70.3% after the sales ban, suggesting that intentionality affected the mortality rate of paraquat. We also confirmed that the number of intentional suicides dropped after the paraquat ban. It is evident that the paraquat ban contributed to a decline in the total number of suicides, although the proportion of cases of herbicide poisonings out of the total suicide cases was relatively small. The multivariate logistic regression model revealed that the paraquat ban was associated with herbicide-related mortality (p=0.035). This observation suggests that, in addition to the decreased suicide rate observed in previous studies, the paraquat ban affected mortality. Therefore, it appears that after the paraquat ban the mortality rate tended to decline (Table 3).
A previous study by Myung, et al.12 reported a marked decrease with time in the number of suicides related to poisoning with herbicide after the paraquat ban. In the present study, a Bayesian change point analysis was performed to determine when the statistically significant changes in herbicide-related mortality occurred, not just suicide.1113 There were two time points with a wide amplitude change in posterior probability, which can be considered as a significant change point of the herbicide-related mortality. The first change point was between December 2011 and February 2012, which was approximately 3 months after the ban on production. After the mortality rate had dropped, it was maintained at that level and a period of stabilization was observed. The changes in mortality rate at this point may be attributable to low accessibility to paraquat, because production was banned, but existing inventory was still on sale. Therefore, depending on the inventory consumed on small farms, the accessibility of paraquat reduced with time. However, the existing stock in certain sales outlets was still being used and, hence, the mortality rate did not attain the level seen in the latter parts. The second change point was in November 2013, which was approximately 1 year after the implementation of the sales ban. At this point, another drop in mortality rate was observed, followed by a period of stabilization. We believe most of the paraquat that had been on hand since the production ban was used, which drastically decreased its availability, and relatively less toxic substances were used as substitutes. This resulted in a drop in herbicide-related mortality, which remained at a low level. However, these mortality rate results appear to be higher than the average results of other herbicides (except paraquat), and it has been suggested that the ban on toxic substances has a limited contribution to mortality reduction.
The present study has several limitations that are worth mentioning. First, this was a retrospective study and some information provided by the patients, such as intentionality or estimated ingestion dose, might have been inaccurate or insufficient. Second, although it was a study on mortality, it was not possible to standardize and reflect the past medical history and health status of the individual patients. Third, this study was a multicenter study, and therefore, regional and institutional differences may have influenced the results.
In conclusion, this study suggests that the paraquat ban is associated with a reduced mortality rate of herbicide poisoning. After the paraquat ban, the number of associated poisonings decreased, while that of the other less toxic herbicides poisonings increased. It may also have resulted from decreased intentional ingestion. Furthermore, a certain period may be required for the effect of regulatory measures to reduce the mortality.
 XML Download