

 PDF
PDF ePub
ePub Citation
 Print
Print


INTRODUCTION
Cardiovascular disease (CVD) is among the main causes of death in the Korean adult population. A study on causes of death in 2015, carried out by the Korean national statistical office, showed that cardiac disorder (10.3%) and cerebrovascular diseases (8.9%) were second only to cancer (27.9%) as primary causes of death.1 Dyslipidemia, hypertension, and diabetes are risk factors of CVD, as well as preceding diseases.234 Thus, improving the management of such diseases can be an effective measure to prevent CVD.
Dyslipidemia includes not only hypercholesterolemia, but also hypertriglyceridemia, hyper-low-density lipoprotein (LDL)-cholesterolemia, and hypo-high-density lipoprotein (HDL)-cholesterolemia. According to a 2015 report from the Korean Society of Lipidology and Atherosclerosis, 47.8% of Korean adults aged 30 years old and older were diagnosed with dyslipidemia.5 Considering the rates of hypertension (30%) and diabetes (10%) diagnosed in the same group,6 the prevalence of dyslipidemia is the highest of the three. However, awareness and treatment rates of dyslipidemia are reported to be lower than those for hypertension and diabetes. According to the Korea Health Statistics of 2012, the awareness of hypercholesterolemia remained at 47.4% with a treatment rate of 37.3%. In the same period, awareness of hypertension and diabetes reached 65.9% and 72.7%, with treatment rates of 60.7% and 63.9%, respectively.7 Analyses of the Korea National Health and Nutrition Examination Survey (KNHANES) data (Roh, et al.)8 showed that only 13.7% of those diagnosed with dyslipidemia had awareness of their disease, and the treatment rate remained at 7.4%.
The National Health Insurance benefit criteria, which decides the actual form of treatment, designates dyslipidemia as hypercholesterolemia, and its application is limited to hyper-LDL-cholesterolemia and hypertriglyceridemia only.9 In 2014, the National Health Insurance benefit criteria shifted its standard from its original total cholesterol basis to an LDL cholesterol basis, because LDL cholesterol is the primary target of therapy for dyslipidemia.10 The treatment guidelines for dyslipidemia categorize patients into four CVD risk categories according to number of present risk factors, and applies a graded LDL cholesterol cut-off (160, 130, 100, and 70 mg/dL) for each category.11 The National Health Insurance benefit criteria agrees with the National Cholesterol Education Program Adult Treatment Panel III (updated NCEP-ATP III).11 For triglycerides, the number of risk factors and the presence or absence of diabetes decide which of the two graded cut-offs (200 or 500 mg/dL) is applied.10
The Korea National Health Screening Program (KNHSP) accepts the term dyslipidemia, and its diagnostic criteria are total cholesterol ≥240 mg/dL, LDL cholesterol ≥160 mg/dL, HDL cholesterol <40 mg/dL, or triglycerides ≥200 mg/dL.12 However, CVD risk factors and their levels are not applied in the diagnostic criteria of the KNHSP. Consequently, the diagnostic criteria do not agree with treatment guidelines that take CVD risk factors and levels thereof into account, and this vagueness causes confusion for health care providers in both diagnosis and treatment. As a result, patient awareness and treatment rates of dyslipidemia remain considerably low.
The objective of this study was to utilize the results of the KNHANES, which are representative of the general population of adults in Korea, in order to understand the prevalence and management status of CVD risk factors (dyslipidemia, hypertension, and diabetes) for dyslipidemia and to propose policy changes. Notably, the prevalence and management status of dyslipidemia was analyzed not by the diagnostic criteria of the KNHSP, but by treatment guidelines (i.e., the National Health Insurance benefit criteria). For this reason, the prevalence, awareness, treatment rate, and control rates of dyslipidemia were calculated and evaluated by sex and risk category. The relative influence of risk factors such as hypertension and diabetes on the occurrence of hyper-LDL-cholesterolemia was also evaluated.
MATERIALS AND METHODS
Study participants
This study is a secondary data analysis from phase 5 of the KNHANES from 2010 to 2012. The KNHANES is a nationwide cross-sectional survey carried out annually by Korea Centers for Disease Control and Prevention (KCDC). Subjects are hierarchically extracted to represent the population of Korea. For the fourth and fifth phases, rolling survey sampling was employed in order to extract similar subjects yearly. Of the health behavior investigation, examination investigation, and nutrition examination that are included in the survey, this study employed the materials from health surveys and examination surveys, accordingly to KCDC regulations regarding the disclosure and use of raw data. In order to increase the number of samples, we included data collected during all three years (2010–2012) of the phase 5 survey. We included only data on the 12229 adults (M: 5020, F: 7209) aged 30 years old and older who had no missing values for any of the research variables we examined. The yearly composition of samples from the survey was 4053 (M: 1677, F: 2376) in 2010, 4202 (M: 1714, F: 2488) in 2011, and 3974 (M: 1629, F: 2345) in 2012.
Measurement of variables and definitions
Body measurement and blood specimen/pressure tests
Weight, height, and waist measurements were taken into account. Height and weight were measured in lightweight clothing by the Seca 225 (Seca Deutchland, Hamburg, Germany) and the GL-6000-20 scale (CAS-Korea, Seoul, Korea). Waist circumference was measured at the midpoint between the bottom of the rib cage and above the top of the iliac crest during minimal respiration. Body mass index (BMI) was calculated as the weight (kilograms) divided by the square of the height (meters squared).
Blood pressure was found through the average value of two separate measurements using a mercury sphygmomanometer (Baumanometer, W.A., Baum Company, Copiague, NY, USA) of diastolic and systolic blood pressure, each after 10 minutes of relaxation. Blood tests were taken with the Hitachi Automatic Analyzer 7600 (Hitachi, Tokyo, Japan) after 12 hours of fasting to measure fasting blood glucose, total cholesterol, LDL cholesterol, HDL cholesterol, and triglycerides. On the occasions that triglycerides measurements were found to be below 400 mg/dL, LDL cholesterol was calculated using the Friedewald formula, as follows: LDL cholesterol=total cholesterol-HDL cholesterol-(triglycerides/5). If triglycerides measurements were over 400 mg/dL, the actual measurement of the LDL cholesterol was taken into account.
Diagnosis of obesity, hypertension, and diabetes
Obesity was defined as BMI ≥25 kg/m2 according to the WHO's cut-off points for Asian populations.13 Central obesity was defined as over 90 cm in waist circumference for males and over 85 cm for females. Hypertension was defined by systolic blood pressure ≥140 mm Hg, diastolic blood pressure ≥90 mm Hg, a doctor's diagnosis, or the use of hypertension medicines. Following the current WHO guidelines,14 diabetes was defined as a fasting blood glucose ≥126 mg/dL, a doctor's diagnosis, or the use of diabetes medications or insulin injections.
CVD risk factors and categories
Risk level was classified into very high, high, moderate, and low risk categories following dyslipidemia treatment guidelines15 revised in 2015. Individuals with a clinical history of CVD (cerebral infarction, myocardial infarction, or angina) were classified into the very high risk category, while diabetes patients were categorized into the high risk category. Information on clinical history of carotid artery disease or abdominal aortic aneurysm had not been collected by the KNHANES, and thus only patients with diabetes were included in the high-risk category. The following risk factors were evaluated in order to define the moderate risk category (presence of two or more factors) and low risk category (presence of none or one factor): smoking, hypertension, low HDL cholesterol (<40 mg/dL), age (M: over 45, F: over 55), and clinical history of CVD among family members (history of cerebral infraction, myocardial infarction, or angina in a direct family member, that is, aparent or sibling). High HDL cholesterol (≥60 mg/dL) was deemed to be a protective factor, reducing the number of pertinent risk factors by one.
Diagnosis of dyslipidemia according to treatment criteria
The primary goal of dyslipidemia treatment is to lower LDL cholesterol levels below a target level. The target LDL cholesterol levels by risk categories were as follows: very high risk <70 mg/dL; high risk <100 mg/dL; moderate risk <130 mg/dL; and low risk <160 mg/dL. Thus, hyper-LDL-cholesterolemia was defined as an LDL cholesterol level above the target level of the relevant risk category, a doctor's diagnosis, or use of cholesterol lowering agents. For those deemed low risk, hypertriglyceridemia was defined as when triglycerides ≥500 mg/dL and for the group who had one or more risk factors, triglycerides ≥200 mg/dL. Dyslipidemia was defined as hyper-LDL-cholesterolemia or hypertriglyceridemia following the NCEP ATP III.
Awareness, treatment rate, and control rate
Awareness of dyslipidemia, hypertension, and diabetes were measured as a percentage of those who have answered “yes” to the question “Have you ever been diagnosed with this disease by a doctor?” Treatment rate was measured as a percentage of those using medication among patients. For dyslipidemia patients, those who were taking cholesterol-lowering agents for more than 20 days per month were taken into account. Patients whose cholesterol, dyslipidemia, blood pressure, and/ or HbA1c had been controlled under the diagnostic standards were accounted for in the proportion classified into the controlled group. Rather than evaluating fasting blood glucose to determine whether diabetes was “controlled,” it was defined by an HbA1c level under 6.5%.
Diagnosis of the metabolic syndrome
In accordance with the standards of the NCEP-ATP III from the 2011 U.S. NCEP,10 diagnosis of the metabolic syndrome was made when three or more of the following indices were relevant: central obesity: waist circumference ≥90 cm (M), ≥85 cm (F); diabetes: fasting blood glucose ≥100 mg/dL or history of diabetes; hypertension: systolic/diastolic blood pressure ≥130/85 mm Hg or history of hypertension; hypertriglyceridemia: triglycerides ≥150 mg/dL; and hypo-HDL-cholesterolemia: HDL cholesterol <40 mg/dL (M), <50 mg/dL (F).
Analysis
Data were analyzed using IBM SPSS Statistics for Windows (version 21.0; IBM Corp., Armonk, NY, USA). All statistical outcomes were based on two-sided tests, and a p value less than 0.05 was considered statistically significant. Data are presented as means and standard deviations for continuous variables and frequencies and percentages for categorical variables. To compare the difference between men and women, a t test for two independent samples was used for continuous variables, and Fisher's exact test was used for categorical variables. The age-standardized prevalence, awareness, treatment, and control rates were calculated using the age- and sex-specific structures of estimated population based on the 2010 Korea Census (Supplementary Table 1, only online). Fisher's exact test was conducted to examine differences in age-standardized rates between men and women. One-way analysis of variance was performed for multiple comparison of the mean risk factors among the risk categories. The chi-square test for trend was carried out to evaluate differences in the prevalence and management of dyslipidemia among the risk levels for CVD. To assess the relative influence of risk factors on hyper-LDL-cholesterolemia, logistic regression analysis was performed by sex.
RESULTS
Characteristics of cardiovascular risk factors of research subjects
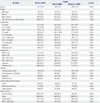
The characteristics of each risk factor of CVD and their differences by sex are shown in Table 1. The average age of the 12229 subjects, who were all 30 years old and over, was 54.1 years. The average total cholesterol, LDL cholesterol, HDL cholesterol, and triglyceride levels were 192.2 mg/dL, 117.4 mg/dL, 49.0 mg/dL, and 130.5 mg/dL, respectively. The average total cholesterol, LDL cholesterol, and HDL cholesterol levels were found to be higher in females than in males, while the average triglyceride levels were higher in males than in females. The average systolic and diastolic blood pressure levels were 121.4 mm Hg and 76.6 mm Hg, respectively; and both were higher in males than in females. Average fasting blood glucose was 98.8 mg/dL, with males averaging higher than females.
Prevalence and management of dyslipidemia
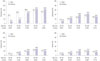
The age-standardized prevalence of the adults, who were 30 years of age and older, was 39.6%, and the awareness, treatment, and control rates of a diagnosed patient were 27.9, 15.7, and 13.2%, respectively. The control rate was 59.3% among treated individuals (Table 2). Prevalence was higher in the male population (M: 45.6% vs. F: 33.9%), although awareness, treatment, and control rates were lower (M: 21.3% vs. F: 34.1%, M: 11.3% vs. F: 19.7%, and M: 8.9% vs. F: 17.1%, respectively). The control rate among the treated was also found to be lower in males than females (53.2% vs. 65.0%).
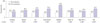
Fig. 1 illustrates sex differences in prevalence, awareness, treatment, and control rates among age groups. For those in their 30's, 40's, and 50's, the prevalence in the male population was higher than in females; prevalence in the female population rapidly rose after their 50's. In the 60's and 70's age groups, the prevalence of dyslipidemia was higher in the female population. Awareness was higher in females than in males across all age groups, and the difference was significant in all groups, except those in their 30's. In the 50's and 60's age groups, treatment rates were significantly higher in females, and control rates in the female group were significantly higher than in the males in the 40's and 50's age groups.
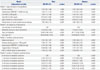
The distribution and average of the number of risk factors per risk category are shown in Table 3. Therein, 3.4% of the very high risk category and 6.1% of the high risk category were without any risk factors. The average number of risk factors was largest in the moderate risk category (2.45), followed by the very high risk category (2.26), high risk category (2.13), and low risk category (0.37). The differences among the group averages were all significant, with the high risk category showing an especially large standard deviation.
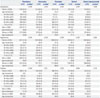
Table 4 lists the prevalence, awareness, treatment rate, and control rate of each risk category. Both sexes showed higher prevalence in the higher risk categories, and in all risk categories, excluding the low risk category, prevalence was higher in females than in males. Prevalence in the very high risk category, high risk category, moderate risk category, and low risk category for males was 89.5, 78.8, 54.6, and 20.0%, respectively, while for females, it was 94.9, 86.5, 64.6, and 17.7%, respectively. Awareness among the patients was found to be higher in those in higher risk categories for males, but for females, there were no significant trends among risk categories. Unawareness of dyslipidemia in the very high risk category and high risk category reached two-thirds in the study population.
Treatment rates were significantly higher in higher risk categories for both sexes, and across all risk categories, males showed lower treatment rates than females. The treatment rates of the very high risk category, high risk category, moderate risk category, and lower risk category for males were 27.1, 17.7, 8.5, and 9.5%, while for females, they were 28.4, 27.8, 18.9, and 15.7%, respectively. Control rates were significantly lower in the higher risk categories, while in all risk categories, excluding the very high risk category, males showed a lower control rate than females. Control rates in the very high risk category, high risk category, moderate risk category, and low risk category were 7.9, 9.6, 8.7, and 16.0% in males and 4.7, 15.6, 16.5, and 24.6% in females, respectively.
Prevalence and management of hypertension
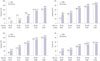
The age-standardized prevalence of hypertension in the adult population of individuals 30 years and over was 32.8%, and the awareness, treatment, and control rates of patients was 64.5, 57.3, and 39.7%, respectively. The control rate among the treated was 64.2% (Table 2). The prevalence of hypertension was significantly higher in males than in females (36.2% vs. 29.7%), although awareness, treatment, and control rates were significantly lower (54.7% vs. 73.7%, 47.1% vs. 66.9%, and 33.0% vs. 45.9%, respectively). The control rate among the treated did not show a significant difference between sexes (64.6% vs. 63.8%).
Fig. 2 illustrates the sex differences in the prevalence, awareness, treatment, and control rates across all age groups. For the groups of those in their 30's and 40's, the prevalence of hypertension in the male population was significantly higher than that in females, although it evened out during their 50's. Beginning in the 60's, the prevalence of hypertension was higher in the female population. Awareness among patients was higher in females than in males across all age groups. The treatment rate of hypertension was higher in females across all age groups, and the differences were all significant, except in the 50's. The control rate was higher in females in their 30–50's, and beginning in their 60's, there was no significant difference between the sexes.
Prevalence and management of diabetes
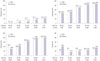
The age-standardized prevalence of diabetes in the adult population of individuals 30 years and over was 9.8%, and the awareness, treatment rate, and control rates thereof were, respectively, 75.4, 66.5, and 26.1%. The control rate among the treated was 22.1% (Table 2). The control rate among the treated was lower than that among diabetes patients. This phenomenon could be explained by the inclusion of mild diabetic patients who were newly diagnosed by fasting blood glucose in this survey. The prevalence of diabetes was significantly higher in males than in females (11.3% vs. 9.6%), while awareness and treatment rates were significantly lower (72.3% vs. 78.2% and 62.6% vs. 70.1%, respectively). There were significant sex differences in control rates among both the diagnosed (with/without treatment) and treatment alone groups.
Fig. 3 illustrates sex differences in prevalence, awareness, treatment, and control rates among age groups. Male prevalence was significantly higher throughout the 30's to 60's; there was no significant difference between the sexes in the groups in their 70's and over. Male prevalence rapidly rose beginning with individuals in their 50's. Female prevalence rose rapidly beginning with individuals in their 60's, catching up with the males and showing no significant difference by their 70's. Higher age groups showed higher treatment rates among the patients, and there were no significant differences in any of the age groups, except the 60's. There was no specific trend in the control rate among patients across all age groups in both sexes, and no significant sex differences either.
Risk factors, metabolic syndrome, and hyper-LDL-cholesterolemia
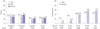
Fig. 4 illustrates the prevalence, awareness, treatment, and control rates of hyper-LDL-cholesterolemia. The age-standardized prevalence was 30.9%, and the awareness, treatment, and control rates were 34.1, 18.8, and 20.8%, respectively, in the adult population 30 years and over. Males showed significantly higher prevalence than females (32.3% vs. 29.5%), although awareness, treatment, and control rates were significantly lower (29.2% vs. 38.7%, 15.2% vs. 22.2%, and 18.0% vs. 23.4%, respectively). In the 30's and 40's age groups, prevalence was significantly higher in males, but in the 50's, no significant sex differences were found, and female prevalence rose significantly higher than in males beginning with subjects in their 60's.
Fig. 5 compares the prevalence of hyper-LDL-cholesterolemia according to the presence of risk factors of CVD. Smoking showed no significant difference in prevalence, although the presence of other risk factors showed a higher prevalence. The prevalence of hypertension was 52.8%, and the prevalence of diabetes patients was 76.0%. Those without the metabolic syndrome showed a prevalence of 26.3%, while those with metabolic syndrome showed a prevalence of 53.1%.
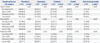
Table 5 compares the logistic regression analysis results by sex in order to understand the relative influence of risk factors according to the presence of hyper-LDL-cholesterolemia. Model 1 used the risk factors of dyslipidemia as independent variables. The odds ratio (OR) of high HDL cholesterol (≥60 mg/ dL), which is a protective factor, was significantly lower than 1 in both sexes, while the ORs of all other risk factors were significantly greater than 1. When compared with males, the OR of age in males was 2.54, while that of females was 4.94, which was approximately two-fold more. Model 2 used the classification of risk categories as independent variables, and showed the relative risk of hyper-LDL-cholesterolemia among other risk categories when the OR of the low risk category was designated as 1. The ORs of the moderate risk category, high risk category, and very high risk category in males were 4.53, 15.84, and 49.30, respectively. Females showed higher scores at 7.10, 24.11, and 78.59 across all risk categories. Model 3 used the five risk factors that designate metabolic syndrome as independent variables, and illustrated that females show larger ORs for all risk factors, excluding low-HDL-cholesterolemia (M: <40 mg/ dL, F: 50 mg/dL), compared to males. Model 4 used the number of risk factors of metabolic syndrome that are present as an independent variable, and illustrated changes in relative risk with an increase in the number of risk factors. In all occasions where there was more than one risk factor, females showed a larger OR than males, and in the metabolic syndrome group, where there were three or more risk factors, the OR of females was about three times larger than that for males.
DISCUSSION
This study utilized the raw data of 12229 adults aged 30 years old and older from the KNHANES (2010–2012), which is representative of the general population of Korea, to investigate the prevalence and management status of dyslipidemia, hypertension, and diabetes.
The prevalence of dyslipidemia was not analyzed by diagnostic criteria, but by the National Health Insurance benefit criteria, which designates the actual form of treatment. The main results can be summarized as follows: 1) The age-standardized prevalence was highest in dyslipidemia, at 39.6%, followed by hypertension at 32.8%, and diabetes at 9.8%. 2) Awareness among patients was highest for diabetes, at 75.4%, followed by hypertension at 64.5% and dyslipidemia at 27.9%. 3) The treatment rate among patients was 66.5% for diabetes, 57.3% for hypertension, and only 15.7% for dyslipidemia. 4) The control rate among the treated was highest for hypertension, at 64.2%, followed by dyslipidemia at 59.3% and diabetes at 22.1%. 5) The male population showed a higher prevalence of diabetes, hypertension, and dyslipidemia, but lower awareness and treatment rates. 6) Finally, females showed a lower prevalence of high-LDL-cholesterolemia than males, but a higher relative risk level based on risk factors.
Studies on the prevalence and management of dyslipidemia have been based on different diagnostic criteria. The National Health Statistics, published by the Republic of Korea's Centers for Disease Control and Prevention, is an analysis of the data of the KNHANES, where they classify dyslipidemia into hypercholesterolemia and hypertriglyceridemia. Ahn, et al.,16 which used KNHSP data from 2003 to 2010 in order to analyze treatment rates, focused on hypercholesterolemia. It can be assumed that this was because the customary standard at that time was to use total cholesterol and triglycerides and the consequent ease of obtaining relevant data for these measures. The dyslipidemia treatment guidelines,15 revised by the Korean Society of Lipidology and Atherosclerosis in 2015, recommends that the diagnostic criteria for dyslipidemia are total cholesterol ≥240 mg/dL, LDL cholesterol ≥160 mg/dL, HDL cholesterol <40 mg/dL, or triglycerides ≥200 mg/dL. However, in a study of prevalence rates published in 2015 by the Korean Society of Lipidology and Atherosclerosis,5 total cholesterol was not used as a diagnostic criterion for dyslipidemia. Debate is ongoing about whether total cholesterol can be an appropriate diagnostic criterion for dyslipidemia, because high HDL cholesterol, which is a protective factor, can result in a finding of hypercholesterolemia as well.17 Other studies8 have applied triglycerides ≥150 mg/dL or HDL cholesterol <40 mg/dL (M)/<50 mg/dL (F) as the diagnostic criteria for dyslipidemia. This is because the NCEP-ATP III guideline published in 2001 designates LDL cholesterol as the primary aim of dyslipidemia treatment, and suggests controlling the level of triglycerides and HDL cholesterol based on the criteria for the metabolic syndrome.
Unlike its diagnostic criteria, the treatment guidelines for dyslipidemi are commend that a graded treatment aim for LDL cholesterol be applied by different risk categories, depending on the evaluation of CVD risk factors and their levels.15 This study analyzed the prevalence and management status of dyslipidemia (hyper-LDL-cholesterolemia or hypertriglyceridemia) found in adults aged 30 years old and older by applying the National Health Insurance benefit criteria as the treatment criteria. The age-standardized prevalence was 39.6%, highlighting a significant difference from the studies that apply diagnostic criteria for their analysis. According to a report in 2015 by the Korean Society of Lipidology and Atherosclerosis, the prevalence (hyper-LDL-cholesterolemia, hypertriglyceridemia, or hypo-HDL-cholesterolemia) found in adults aged 30 years old and older was 47.8%.5 The 2012 National Health Statistics,7 which analyzed only hypercholesterolemia (≥240 mg/dL or use of cholesterol lowering agents), suggested that the prevalence in adults 30 and over was 14.5% in 2012. In the present study, the awareness, treatment, and control rates among patients were 27.9, 15.7, and 13.2, respectively. Considering the awareness, treatment, and control rates of hypercholesterolemia patients among adults over 30, which were 44.8, 34.1, and 27.0% in 2012, the management indices of dyslipidemia derived by this study were significantly lower. The control rate among the treated was 59.5%, which is significantly different than the 77.6% control rate among those who were treated for hypercholesterolemia, as suggested by the 2012 National Health Statistics. Lee, et al.,18 which also employed the LDL cholesterol treatment guidelines, analyzed the data of adults 20 years and over from the KNHANES of 2008–2010, and showed a 23.2% prevalence, 13.2% awareness, and 10.2% treatment rate for hyper-LDL-cholesterolemia. However, our study analyzed hyper-LDL-cholesterolemia found in adults 30 years and over using the data from the KNHANES of 2010–2012. The prevalence was 30.9%, and the awareness, treatment, and control rates among the patients were 34.1, 18.8, and 20.8%, respectively. These differences can be assumed to be attributed to the different subjects and time of the research. In addition, this study analyzed dyslipidemia (hyper-LDL-cholesterolemia and hypertriglyceridemia) and compared the prevalence, awareness, treatment rate, and control rate with those of hypertension and diabetes, which are some of the main factors that contribute to CVD. The prevalence of dyslipidemia was 39.6%, ranking highest among the risk factors of CVD, although its awareness and treatment rate were the lowest. Its control rate among the treated was 59.5%, following hypertension. Prevalence was higher in middle-aged (in their 30's, 40's, and 50's) men than in women. However, awareness, treatment, and control rates were lower in men than in women. These sex-difference patterns in prevalence and management of dyslipidemia were also reported in other Asian countries.192021 Mentend to have unhealthy lifestyles, such as alcohol intake, cigarettes smoking, and an unhealthy diet, especially in those under the age of 50 years.20
The age-standardized prevalence of hypertension found in adults 30 years and over was 32.8%, and the prevalence of males was significantly higher than that of females (36.2% vs. 29.7%). In this study, the awareness, treatment rate, and control rate among patients with hypertension was found to be 64.5, 57.4, and 39.7%, respectively. Males showed a significantly lower awareness, treatment, and control rates than females. The control rate among the treated found in this study was 64.2%, and there was no significant difference between the sexes (M: 64.6% vs. F: 63.8%).
The age-standardized prevalence of diabetes found in adults aged 30 years old and older in this study was 9.8%, and male prevalence was significantly higher than that of females (11.3% vs. 8.3%). In the present study, the awareness, treatment, and control rate of diabetes patients were 75.4, 66.5, and 26.1%, respectively. Males showed a significantly lower awareness and treatment rate than females, although the control rate showed no significant difference. The control rate among those who were treated for diabetes was found in our study to be 22.1%, with no significant sex difference (21.5% vs. 22.7%). This implies that regardless of sex, four out of five treated patients are not able to control their blood glucose levels.
Dyslipidemia, hypertension, and diabetes are risk factors of CVD, as well as preceding diseases.234 In this study, the prevalence of dyslipidemia was higher than that of both hypertension and diabetes. On the other hand, its awareness, treatment, and control rates were found to be lower. Subjects in higher risk categories in particular showed a higher prevalence regardless of sex, although the control rate in both patients and treated was found to be the lowest. The control rates found in the very high risk category, high risk category, moderate risk category, and low risk category were M: 7.9, 9.6, 8.7, and 16.0% and F: 4.7, 15.6, 16.5, and 24.6%, respectively. The fact that higher risk categories show lower control rates implies that the management of dyslipidemia with a focus on the risk level is not being properly handled. The prevalence of dyslipidemia found in diabetes patients was 82.6%, and the awareness, treatment, and control rates among the diagnosed patients were 34.0, 23.0, and 12.7%, respectively. This implies that eight out of 10 diabetes patients have dyslipidemia, and only one out of 10 patients with diagnosis of both diseases have lipid control as their treatment aim.
The limitations of this study are as follows. First, LDL cholesterol was measured by the Friedewald formula, instead of actual measurements for the subjects with triglycerides below 400 mg/dL. This method is used in the current system of the KNHSP, but the Friedewald equation is known to produce some error, compared to actual measurements. Second, the current treatment guidelines were not fully taken into account in evaluating the risk factors and levels of CVD. In particular, the ages of premature CVD prevalence were not taken into consideration as a risk factor in evaluating the clinical history of the family of the subjects. The high risk category only accounted for diabetes patients, and the very high risk category, only those who had a clinical history of CVD. Third, the awareness and treatment rate found in this study relied on self-reported questionnaire data collected in the KNHANES, and may thus be erroneous. Fourth, the incidence and risk of CVD is much lower than that observed in Western countries. However, there is little evidence available for CV risk estimation and treatment target determination for dyslipidemia in Korea. This study applied the 2015 Korean Society of Lipidology and Atherosclerosis guideline compatible with the updated NCEP-ATP III guidelines for CV risk estimation and risk-based LDL cholesterol targets. Therefore, our study results should be cautiously interpreted with the acknowledgement of overestimation of CV risk and prevalence in dyslipidemia.
This study is significant in that it analyzed the prevalence and management status of dyslipidemia in Korean adults aged 30 years old and older on the basis of a treatment guidelines graded by risk level, instead of more general diagnostic criteria. The prevalence of dyslipidemia was higher relative to that of hypertension and diabetes. However, its awareness, treatment, and control rates were the lowest. Seven out of 10 dyslipidemia patients were not aware of their disease, and eight or more patients were not receiving any treatment. The control rate among the treated was found to be the lowest for diabetes, at 22.1%, followed by dyslipidemia at 59.3% and hypertension at 64.2%. These results suggest that a nationwide effort aimed at raising awareness and the treatment rate of dyslipidemia, as well as raising the control rate of those who are being treated for diabetes, is needed.
Thus, this paper proposes the following steps in order to improve upon the current protocols of the KNHSP. First, the diagnosis-based examination system of dyslipidemia must be shifted to one that is centered around the treatment and management of patients. In the current system of the KNHSP, additional examinations for those who are suspected to have dyslipidemia in the initial examination are not being carried out, and consequently, the patients are lacking post-management. Thus, subjects of additional examination should include not only suspected hypertension and diabetes patients, but also those suspected to have dyslipidemia in order to designate a risk category, provide relevant education, and decide on the administration of medication. If this were to cause a financial burden on the National Health Insurance, it can be suggested that at least the patients belonging to the very high or high risk categories, such as diabetes patients, are examined for dyslipidemia and treated with post-management thereon. Second, the diagnostic criteria for dyslipidemia in the KNHSP must be reconciled with treatment guidelines. This requires a meticulous evaluation of the number of risk factors and their levels, which should be recorded with the examination results. In addition, graded diagnostic criteria should be applied by risk category to suggest differential treatment goals by LDL cholesterol level. Third, an improvement of the questionnaires in the KNHSP is required. In order to implement a graded application of the diagnostic criteria for hyper-LDL-cholesterolemia by risk category, the questions on the risk factors for CVD must be more specific and systematic to achieve measurability. For example, in the domain of “family history of premature prevalence of coronary artery disease,” the risk factor is specifically the “prevalence of coronary artery diseases in direct family members before the age of M: 55 and F: 65”. However, the item in the questionnaire of the current KNHSP survey, which only mentions “family history of coronary artery disease,” is not specific enough to obtain this information.
In conclusion, we analyzed the prevalence and management status of CVD risk factors for dyslipidemia on the basis of treatment guidelines graded by CV risk level, because the low rate of awareness and treatment might be caused by disagreement between diagnostic criteria and treatment guidelines on dyslipidemia. The prevalence of dyslipidemia was highest relative to that of hypertension and diabetes. Its awareness, treatment, and control rates were found to be the lowest, however. Nonetheless, the control rate among treated individuals was higher than that of diabetes. We also observed that the higher CVD-risk categories show lower control rates of dyslipidemia. In order to improve the awareness and control rates of dyslipidemia, it should be defined according to the treatment criteria based on CV risk rather than the diagnostic criteria in Korea. However, there is little evidence available on CV risk estimation and treatment target determination for dyslipidemia in Korea. To assess the exact CV risk in Korean population, large-scale cohort studies should be implemented in the future.

 XML Download