

 PDF
PDF ePub
ePub Citation
 Print
Print


INTRODUCTION
End-stage renal disease (ESRD) patients often suffer from various cardiovascular (CV) diseases, which account for considerable morbidity and mortality.12 In addition, diabetes mellitus (DM), which comprises the most common cause of ESRD,3 is a major risk factor for CV diseases. Thus, it can be reasonably hypothesized that DM would play an additive role in the generation and advancement of CV diseases in ESRD patients compared to patients with ESRD due to other etiologies (non-DM ESRD). With recent advances in diagnostic modalities for CV diseases and our enhanced knowledge of the CV system, we currently have better screening protocols for CV system even in subclinical stage patients. However, comprehensive investigation of the prevalence and features of CV system in ESRD patients with and without DM has not yet been performed. In this study, we assessed various structural and functional abnormalities in the CV system in ESRD patients and explored additive impact of DM on subclinical CV damage.
MATERIALS AND METHODS
The current study used the Cardiovascular and Metabolic disease Etiology Research Center-HIgh risk cohort (CMERC-HI) data, which is a prospective cohort study aimed at developing individual prevention strategies for patients with high risks of CV disease (clinicaltrial.gov NCT02003781). The CMERC-HI cohort enrolls patients who are 20 to 80 years old and meet at least one of the following inclusion criteria: high-risk hypertension patients [estimated glomerular filtration rate (eGFR) >60 mL/min with target organ damage or eGFR ≤60 mL/min]; DM patients with albuminuria; anuric ESRD patients on dialysis (urine output less than 200 mL/day); and relatives of acute myocardial infarction patients who were less than 55 years old for men or 65 years old for women. Exclusion criteria were a history of acute coronary syndrome, symptomatic coronary artery disease (CAD), symptomatic peripheral artery disease, heart failure, life expectancy less than 6 months due to non-CV disease, women who were pregnant or nursing, and a history of contrast allergy and related side effects. Finally, 1017 patients were enrolled between November 2013 and January 2015 at the Severance Hospital in Seoul, Republic of Korea. This study was performed in a subgroup of ESRD patients with anuria. The Institutional Review Board of the Yonsei University Health System Clinical Trial Center approved the study protocol, and the written informed consent was obtained from all participants.
Twenty-four hour ambulatory blood pressure monitoring (ABPM) was performed using a Takeda TM-2430 instrument (A&D Medical, Tokyo, Japan) with readings taken every 30 min. ABPM measurements were done on the arm without the arteriovenous fistula. Daytime and nighttime periods were defined according to information provided by the patient. Ambulatory blood pressure (BP) readings were averaged for 24 hours, daytime, and nighttime. Patients were classified according to dipping pattern as follows: dippers (nighttime BP decrease >10%), non-dippers (nighttime BP decrease <10% and >0%) and reverse dippers (nighttime BP > daytime BP).
Central hemodynamics were evaluated in the sitting position after 10 min of rest using the SphygmoCor system (AtCor Medical, Sydney, Australia). A high-fidelity micromanometer (Millar Instruments, Houston, TX, USA) was used to record peripheral pressure waveforms from the radial arteries as reported previously.45 Radial artery waveforms were obtained from the arm without the arteriovenous fistula. The Sphygmo-Cor system obtains the ascending aortic pressure waveform from the radial artery waveform using its validated mathematical transfer function. Central systolic BP, diastolic BP, pulse pressure, augmentation pressure, forward wave amplitude, and augmentation index (AI) were acquired from the aortic pressure waveform analyses. Pulse pressure was calculated as the difference between systolic and diastolic pressures. Augmentation pressure is the difference between the second and first systolic peak pressures, and AI was defined as the ratio of augmentation pressure to aortic pulse pressure. The pulse wave velocity (PWV) was measured as specified previously.6 Briefly, electrocardiogram and carotid/femoral pulse waves were obtained simultaneously to calculate the transit time using the foot-to-foot method. The distance traveled by the pulse wave was calculated by subtracting the sternal notch-right carotid site from right femoral site-sternal notch distances.6
In each patient, standard 2-dimensional transthoracic echocardiography was performed following The American Society of Echocardiography guidelines.7 Left ventricular (LV) end-diastolic dimension (LVEDD) and LV end-systolic dimension (LVESD), end-diastolic interventricular septum (IVSd), and LV posterior wall thickness (PWd) were measured. LV mass was calculated using the formula 0.8 [1.04 (IVSd+LVEDD+PWd)3-LVEDD3]+0.6 (g) indexed to the body surface area. The LV ejection fraction (EF) was obtained using the modified Simpson’s method. Left atrial (LA) volume was measured using the biplane area-length method indexed to the body surface area [left atrial volume index (LAVI)]. Using Doppler, peak velocities of early (E) and late diastolic mitral inflow were measured. Early (E’) and late diastolic mitral annulus velocity were determined at the septal corner of the mitral annulus using tissue Doppler imaging. The ratio of E/E’, which reflects LV filling pressure,8 was calculated. Two experienced echocardiologists who were unaware of the patient’s clinical information analyzed the echocardiographic data.
All testing, data acquisition, and image post-processing for coronary computed tomography angiogram (CCTA) were in accordance with the Society of Cardiovascular Computed Tomography guidelines on CCTA acquisition.910 CCTA was performed with multi-detector row computed tomography scanners of 64 rows or greater (Aquilion ONE; Toshiba Medical Systems, Tokyo, Japan). Coronary arteries were evaluated according to a 16-segment coronary artery model modified from the American Heart Association classification.11 Atherosclerotic plaques were defined as any structure >1 mm2 within the vessel lumen or adjacent to the vessel lumen that could be clearly distinguished from the lumen and neighboring pericardial tissue or epicardial fat. CAD was defined as the presence of atherosclerotic plaques in each coronary artery segment. Minimal CAD was defined as coronary artery segments exhibiting plaques with <50% luminal narrowing, whereas significant CAD was defined as ≥50% luminal narrowing. The extent of significant CAD was categorized into 1-vessel disease (VD), 2-VD, and 3-VD. In addition, coronary artery calcium score (CACS) was measured in analyzable patients according to the scoring system described by Agatston, et al.12 and Nakazato, et al.13
Continuous variables are expressed as mean±standard deviation after normality tests were performed for each parameter to assess whether a data set was normally distributed. Categorical variables were expressed as numbers and percentages. Variables of the two groups were compared using two-sample t-tests for continuous variables and chi-squared tests and Fisher’s exact tests for categorical variables. In subgroup analyses for evaluating impact of dialysis modality, variables were compared by using the Mann-Whitney U test. Linear regression analyses and binary logistic regression analyses were performed to test the independent impact of DM on dependent variables. p<0.05 was considered statistically significant.
RESULTS
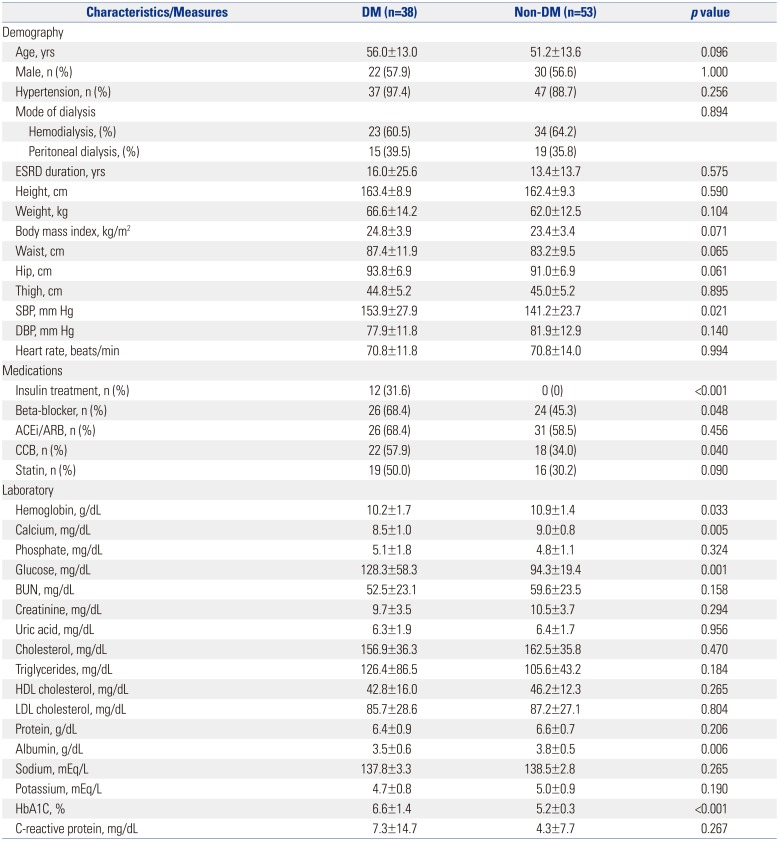
The baseline clinical characteristics of patients are summarized in Table 1. Patients in the DM group had higher systolic BP, and therefore, they took more antihypertensive medications such as beta-blocker and calcium channel blocker than patients in non-DM group. Other demographic findings were similar between the DM and non-DM groups. In laboratory findings, the DM group had higher fasting glucose and glycosylated hemoglobin levels. In addition, there were statistical differences in hemoglobin, serum calcium, and albumin between the groups. However, uric acid levels and lipid profiles, which are well-known risk factors for CV diseases, did not differ between the two groups.
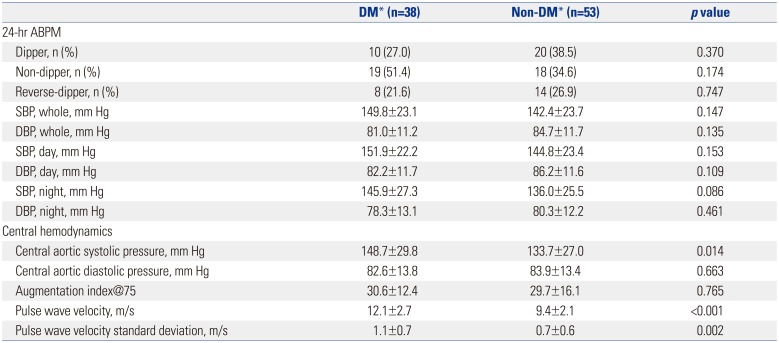
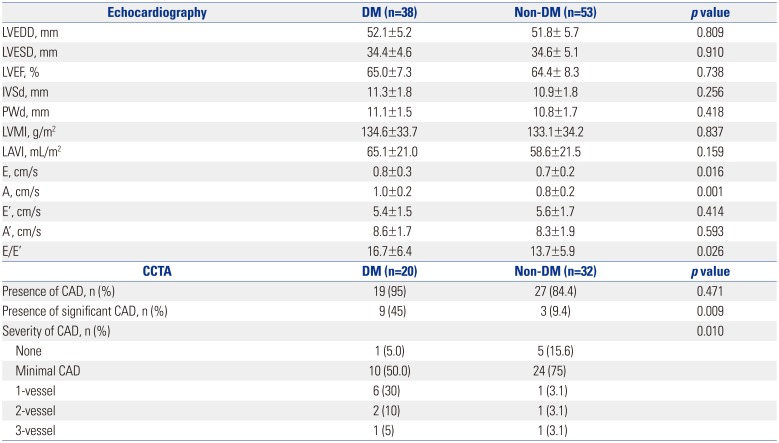
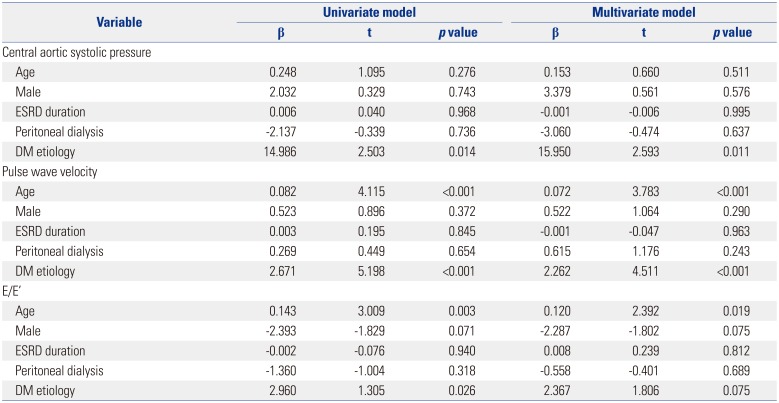
Data from 24-h ABPM, central hemodynamics, and PWV are shown in Table 2. Results from the 24-h ABPM were similar between the two groups. However, central aortic systolic pressure and PWV were significantly higher in DM patients compared to non-DM subjects (p<0.05). Table 3 provides the data from echocardiography and CCTA examinations. In DM patients, E/E’ was significantly higher despite similar LV EF, indicating that DM patients have higher LV filling pressure than non-DM patients.
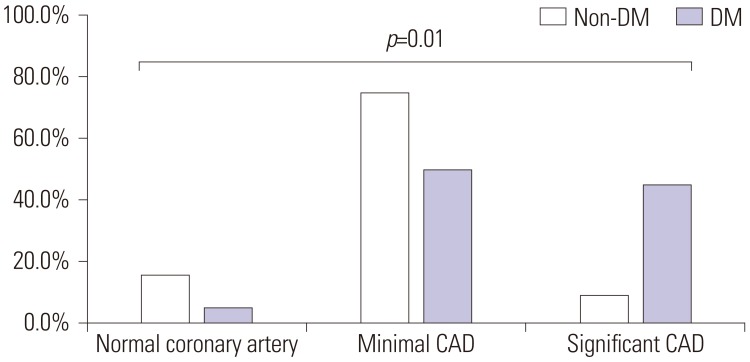
CCTA was performed in 52 patients, and the presence of atherosclerotic plaques in each coronary artery segment was not different between the DM and non-DM groups (95% vs. 84.4%; p=0.471) (Table 3). However, the prevalence of significant CAD was 23.1% (n=12); and it was higher in the DM group (45%) than the DM group (9.4%). As shown in Fig. 1, it is noted that the prevalence of significant CAD (the presence of ≥50% stenosis in any major coronary artery) was greater in the DM group (p=0.010). However, CACS, evaluated in analyzable patients (20 non-DM patients and 19 DM patients), was not different between the groups (non-DM group, 129.4±263.8; DM group, 360.3±678.7; p=0.703).
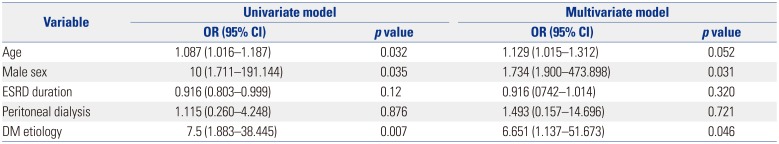
We performed statistical analyses to determine the association of clinical variables and the independent impact of DM on various vascular biomarkers. These data are provided in Table 4 and 5. The presence of DM independently determined central aortic pressure, PWV (Table 4), and the presence of CAD (Table 5) in both univariate and multivariate analyses. The presence of DM had significant association with E/E’ in univariate analysis, however, it was not independent determinant for E/E’ after adjustment with other variables (Table 4).
DISCUSSION
The core findings of this study are: 1) despite similar demography, DM patients had higher central aortic systolic pressure and faster PWV; and 2) DM ESRD patients have more CAD and suffered from more severe CAD than non-DM ESRD patients. These results can be interpreted to indicate that DM ESRD patients have more advanced arteriosclerosis and more severe CAD than non-DM ESRD subjects. To the best of our knowledge, the current research is the first to assess the additive impact of DM on CV damage profile using a comprehensive screening protocol in ESRD patients who have a high risk of CV diseases. Based on the current data, we guardedly propose that more aggressive diagnostic work-ups and tailored management may be helpful for DM ESRD patients.
Although data from 24-h ABPM did not differ, DM ESRD patients had significantly higher central aortic systolic pressure, which is a robust prognosticator for CV outcomes and is superior to conventional brachial BP.14 One potential explanation for this finding is more advanced arteriosclerosis in the DM ESRD group. This is further supported by our observation of faster PWV in these patients than non-DM ESRD subjects, despite similar clinical characteristics. In fact, the presence of DM, along with age, was an independent determinant for PWV in our cohort. Studies have shown that hyperglycemia and hyperinsulinemia accelerate arteriosclerosis through increased accumulation of advanced glycation end products and endothelial dysfunction.1516 In a study by Tomiyama, et al.,15 increased BP and increased plasma glucose levels synergistically accelerated the progression of arterial stiffness in 2080 Japanese men. In the current investigation, we observed that the presence of DM independently correlated with more advanced arterial stiffness even in ESRD patients. This is clinically important because aortic stiffness is a strong independent predictor of CV mortality in subjects with end stage renal disease.17
In echocardiography examinations, however, the association between DM and E/E’ showed marginal significance in multi-variate analysis, and DM patients seemed to have higher E/E’, which represents increased LV filling pressure.8 This result suggests that: 1) DM ESRD patients might be prone to pulmonary congestion and/or heart failure symptoms during cardiac volume/pressure overload despite normal LV EF; and thus, 2) more aggressive LV unloading by renal replacement therapy and/or anti-heart failure medications should be considered in the setting of ESRD and DM.
Unexpectedly, E’ and LA volumes did not differ between the DM and non-DM ESRD groups. E’ reflects early diastolic LV longitudinal relaxation, which is more vulnerable and is an earlier manifestation of cardiac dysfunction than LV radial motion, which is commonly expressed by LV EF in various diseases affecting the heart.18 It is well known that DM patients have blunted LV long-axis performances at rest19 and during exercise.20 As previously reported, diastolic dysfunction is more advanced in patients with DM192021 and ESRD;22 however, our data failed to show any difference in LV relaxation properties between the two groups. In addition, LAVI, reflecting chronicity and severity of diastolic function, was not different between the two groups. Those results are plausibly explained by: 1) the longer duration of ESRD in the non-DM group, 2) characteristic chronic volume overload status which overwhelms slight difference of myocardial dysfunction in ESRD patients, and 3) E’ might be too rough to be used as a parameter to detect subtle differences in LV mechanics between the two groups. Thus, further studies are warranted using a more well-balanced and larger study sample and newer echocardiographic technologies, such as strain analysis, for better evaluation of myocardial function.
Although the overall prevalence of CAD (i.e., subclinical CAD) was modest (23.1%) in analyzable patients based on CCTA, the prevalence was apparently higher in the DM group (45%) than non-DM group (9.4%). Our data support the notion that DM may have a more negative impact on CV system even in ESRD patients, even though ESRD itself is a powerful risk factor for CV diseases and should be regarded as a ‘CAD equivalent’ condition. In DM ESRD patients, it is known that vascular calcification, chronic inflammation, and insulin resistance are kidney related CV risk factors.23 However, the current study showed no difference of CACS and C-reactive protein levels between the groups. This observation suggests that different pathophysiologic mechanisms such as insulin resistance might have roles in generation and progression of CAD between ESRD patients with and without DM. ESRD has a strong relationship with the development of CV diseases, including atherosclerosis, due to the effects of uremia, volume/pressure overload of the heart and vessels, oxidative stress, and altered metabolism.2425 The clinical implication of our investigation is that when DM, which induces oxidative stress and inflammation, 21 is superimposed on ESRD, it affects the CV system in these patients.26 Therefore, we carefully suggest a thorough diagnostic work-up for the detection and characterization of each patient’s CV disease profile even in subclinical stages.
This study has some limitations. First, our small cohort limits the power of statistical analyses. Second, this is a single center study and included patients referred to a tertiary center. Thus, the current study group might not represent the entire population of patients with ESRD. Third, because of its cross-sectional design, we do not have CV outcome data in this cohort, and only observational data analyses were possible. In addition, baseline clinical characteristics were not matched between the DM and non-DM groups, although the differences were not statistically significant. Further investigations with larger ESRD population and long-term clinical outcome are needed to explore whether the comprehensive CV screening protocol could help prevent future CV event in DM ESRD patients.
 XML Download