

 PDF
PDF ePub
ePub Citation
 Print
Print


INTRODUCTION
Diabetes characterized by hyperglycemia results from defects in insulin secretion, insulin action, or both. Globally, the prevalence of diabetes is increasing, and the same trend is occurring in Korea.1 This increase is largely explained by the obesity epidemic: the expected prevalence of overweight [body mass index (BMI) of 25–30 kg/m2] or obese (BMI of ≥30 kg/m2) individuals will be 57.8% in 2030 in the global adult population.2 Although the detailed mechanisms remain unclear, numerous studies have emphasized the link between overall and abdominal obesity and the increased risk of metabolic conditions such as diabetes.345
Obesity indicators include BMI, waist circumference, and the waist-to-height, waist-to-hip, and waist-to-thigh ratios. These indicators reflect different aspects of body composition: BMI represents the total body mass, and waist circumference and waist-to-height ratio reflect abdominal obesity. Interestingly, a larger hip and thigh circumference is associated with a lower risk of diabetes, due to the protective effects of the muscle mass in those areas.67 A meta-analysis showed that waist circumference and waist-to-height ratio were more strongly correlated with the development of diabetes than BMI, although the additional benefits of measuring height in addition to waist circumference remain controversial.8
There is increasing evidence that the type of excess fat is an important predictor of disease risk. Visceral fat is more dangerous than subcutaneous fat because visceral fat cells release proteins that contribute to inflammation, atherosclerosis, dyslipidemia, and hypertension. Consequently, visceral adipose tissue may be more closely associated with type 2 diabetes than other indices of obesity.91011 Although computed tomography (CT) is currently considered the gold standard for quantifying visceral fat, dual-energy X-ray absorptiometry (DXA) can also be used to accurately measure visceral fat.1213 However, which of these predictors is more closely associated with diabetes and prediabetes states remains controversial.
We compared the associations of diabetes and prediabetes with anthropometric obesity indicators, such as waist circumference, as well as visceral fat mass (measured using DXA). We also determined which of the indices has the strongest correlation with diabetes and prediabetes.
MATERIALS AND METHODS
Study design and participants
Participants were recruited from a multicenter population-based prospective cohort study called the Cardiovascular and Metabolic Diseases Etiology Research Center, established in 2013 to improve models predicting cardiovascular and metabolic disease, discover new risk factors and biomarkers, consider new preventative strategies, and collect direct evidence relevant to the prevention of cardiovascular and metabolic diseases. The details of the study design and procedures have been described previously.14
The study was a cross-sectional analysis of baseline data collected for an ongoing prospective cohort study that included participants who completed baseline health examinations (adults aged 30–64 years residing in Suwon, Yongin, and Hwa-seong, Korea) between December 2013 and May 2015. These subjects had no history of malignant tumors, myocardial infarction, stroke, or other cardiovascular disease. Written informed consent was obtained from all participants, and the study was approved by the Ajou University Institutional Review Board (IRB; No. AJIRB-BMR-SUR-13-272).
For this analysis, we excluded one man in whom visceral fat mass was not measured using DXA from the 1604 participants, leaving 1603 subjects (611 males, 992 females) in the study.
Measurements
Trained interviewers ascertained basic demographic data, medical history, and information about personal habits, such as smoking status, alcohol consumption, and physical activity. For these analyses, the level of education was classified into high school graduates or lower and college graduates or higher. Smoking status was classified into three categories: smokers, former smokers, and non-smokers. Alcohol consumption was calculated in grams per day, as the sum of the average alcohol content per type of alcoholic beverage consumed multiplied by the daily number of drinks. Physical exercise was divided into three categories based on standard scoring criteria using the international physical activity questionnaire short form instrument: low, moderate, and high physical activity. Subjects who answered "yes" or "no" to the question "Do you menstruate?" were allotted to premenopausal and postmenopausal groups, respectively.
Anthropometric measures were obtained using a standardized protocol. Height (cm) and weight (kg) were measured on an automatic height-weight scale (BSM330; InBody, Seoul, Korea). BMI was calculated using the formula weight/height2 (kg/m2). A measuring tape (seca, Hamburg, Germany) was used to measure the waist, hip, and thigh circumferences to the nearest 0.1 cm. Waist circumference (cm) was measured midway between the bottom edge of the last rib and the iliac crest in the mid-axillary plane. Hip circumference (cm) was measured at the level of the widest circumference over the buttocks. Thigh circumference (cm) was measured at mid-thigh on the right side, defined as the midpoint between the superior ridge of the patella and the crease of the groin. Waist-height, waist-hip, and waist-thigh ratios were calculated as the waist circumference divided by height, hip circumference, and thigh circumference, respectively.
Whole-body DXA scans were acquired using a Lunar iDXA (GE Healthcare, Madison, WI, USA) and analyzed with enCORE software (GE Healthcare, Madison, WI, USA). Daily quality-control scans were obtained during the study period. All subjects were scanned using standard methods by trained operators. Visceral adipose tissue mass was computed automatically for the DXA android region-of-interest, with the caudal limit at the top of the iliac crest and the cephalad limit at 20% of the distance from the iliac crest to the base of the skull.15 Fat mass data were transformed into CT adipose tissue volume using a constant correction factor (0.94 g/cm3).12
Blood pressure was measured three times at 2-min intervals using an automated blood pressure monitor (HEM-7080IC; Omron Healthcare, Lake Forest, IL, USA) with the participants sitting; the last two of the three measurements were averaged.
All blood samples were obtained in the morning after an 8-h overnight fast, and biochemical assays were performed at a central laboratory (Seoul Clinical Laboratories, Seoul, Korea). For an accurate diagnosis of diabetes, an oral glucose tolerance test (OGTT) was performed after sampling the blood. The levels of glucose in serum while fasting and after a glucose load were obtained using a colorimetric method; total cholesterol, high-density lipoprotein cholesterol, and triglyceride levels in serum were determined using enzymatic methods; and high-sensitivity C-reactive protein was obtained using a turbidimetric immunoassay method with an autoanalyzer (ADVIA 1800 Auto Analyzer; Siemens Medical Solutions, Malvern, PA, USA). The insulin level in serum was obtained using a radioimmunoassay (SR 300; STRATEC, Birkenfeld, Germany), and HbA1c levels were determined using high-performance liquid chromatography with a Variant II Turbo analyzer (Bio-Rad, Hercules, CA, USA).
Diabetes status was defined using the criteria in the American Diabetes Association 2015 guidelines: diabetes [fasting glucose ≥126 mg/dL (7.0 mmol/L), 2-h glucose ≥200 mg/dL (11.1 mmol/L) during the OGTT (75 g), HbA1c level ≥6.5%, or use of hypoglycemic medication], prediabetes [fasting glucose 100–125 mg/dL (5.6–6.9 mmol/L), 2-h glucose 140–199 mg/dL (7.8–11.0 mmol/L), or HbA1c levels of 5.7–6.4%], and normal glucose tolerance [fasting glucose <100 mg/dL (5.6 mmol/L), 2-h glucose <140 mg/dL (7.8 mmol/L), and HbA1c level <5.7%].16
Statistical analyses
Normally distributed data are presented as mean±standard deviation; non-normally distributed data were log-transformed and are presented as median and interquartile range. Data for diabetes status, smoking status, physical exercise, menopause status, and education were categorized.
Using multivariate logistic regression, we quantified the association between adiposity indices (BMI, waist circumference, waist-to-height ratio, waist-to-hip ratio, waist-thigh ratio, and visceral fat mass) and the risk of having diabetes or prediabetes. This model compared risk across gender-specific adiposity indices for 10 quantiles. Our primary model was adjusted for age, and the multivariate model was adjusted for the primary model plus smoking, alcohol consumption, physical activity, education, and menopause status (for females).
A receiver operating characteristic (ROC) curve analysis was used to assess the accuracy of predictions for diabetes or prediabetes. The accuracy was measured using the area under the ROC curve (AUC) with the 95% confidence interval (CI) and the sensitivity and specificity of each adiposity index as a predictor of diabetes or prediabetes. To determine the appropriate gender-specific cut-off point for each adiposity index, the score with the highest combination of sensitivity and specificity (Youden's index, sensitivity+specificity-1) was considered the optimal cut-off score.
The analyses were carried out using SAS ver. 9.2 (SAS Institute, Cary, NC, USA), SPSS ver. 22.0 (SPSS Inc., Chicago, IL, USA), and MedCalc Statistical Software ver. 13.2.0 (MedCalc Software, Ostend, Belgium; http://www.medcalc.org; 2014).
RESULTS
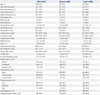
Table 1 summarizes the baseline characteristics and anthropometric indices of the subjects. Of the 1603 participants, 611 (38.1%) were men and 992 (61.9%) were women, and the mean age was 49.3±8.3 years. Overall, 625 (39.0%) participants were classified as having prediabetes and 159 (9.9%) as being diabetic.
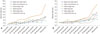
Fig. 1 shows the risk of diabetes or prediabetes for the 10th percentile of adiposity indices in men and women. In the multivariate model [including age, smoking, alcohol consumption, physical activity, education, and menopause status (for females)] the odds ratios (ORs) tended to increase with the values of these indices. Of note, among men, those with a high visceral fat mass had by far the highest association (OR=15.9, 95% CI=6.4–39.2). In contrast, a high waist-to-thigh ratio showed a lower association compared to the values of the other indices (OR=3.7, 95% CI=1.7–8.2) (Supplementary Table 1, only online). In women, similar to the results for men, those with a high visceral fat mass had by far the highest association (OR=6.9, 95% CI=3.5–13.7), whereas having a high waist-to-thigh ratio had a relatively low OR compared to the values for the other indices (OR=2.0, 95% CI=1.1–3.7) (Supplementary Table 2, only online).
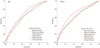
Fig. 2 compares the accuracy of the six adiposity indices for predicting diabetes or prediabetes. All of the adiposity indices were positively correlated with diabetes and prediabetes, although visceral fat mass was by far the strongest predictor of diabetes or prediabetes for both men and women.
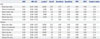
Table 2 summarizes the ability of the six indices to predict diabetes or prediabetes. In men and women, visceral fat mass again had the highest AUC value (0.69, 95% CI=0.64–0.73 and 0.70, 95% CI=0.67–0.74, respectively). In both men and women, BMI had lower AUC values than the other adiposity indices. The cut-off values of visceral fat mass were 0.8 and 0.5 kg for men and women, respectively.
DISCUSSION
This study attempted to clarify which measurement of obesity correlates best with diabetes and prediabetes, by assessing the predictive value of numerous adiposity indices, including visceral fat mass measured by DXA. We showed the superiority of visceral fat mass measured by DXA as a predictor of diabetes and prediabetes over traditional anthropometric measurements of obesity, such as waist circumference and waist-to-height ratio. We also established cut-off values for the risk stratification of diabetes and prediabetes for each of the adiposity indices and for visceral fat mass for Korean men and women in particular.
Adiposity indices such as BMI, waist circumference, and waist-to-hip ratio are correlated with diabetes and prediabetes, although it is not clear which measurement correlates the best.1718 Although there are reports that the association between BMI and type 2 diabetes may be stronger than that of other adiposity indices, a recent meta-analysis indicated that waist-to-height ratio and waist circumference were more strongly associated with the development of diabetes than BMI or waist-to hip ratio.8192021 This is probably due to the fact that waist circumference and waist-to-height ratio correlate more closely with abdominal obesity than does BMI. It has long been assumed that diabetes is associated with abdominal obesity and anthropometric measurements such as waist circumference that correlate with regional body fat distribution more so than BMI. This is more obvious in some racial groups, especially Asians. Rajpathak and Wylie-Rosett22 reported a high prevalence of diabetes and impaired fasting glucose among Chinese immigrants with a normal BMI, especially among those with larger waist circumferences.
Many recent studies have suggested that the waist-to-height ratio is the best measure of obesity, compared to anthropometric measures, as this ratio corrects the waist circumference for the height of the individual.23,24 However, it is controversial as to whether height affects the relationship between waist circumference and visceral fat.825
The correlation of intra-abdominal visceral fat with waist circumference is thought to be the biological explanation for the superiority of waist circumference as a predictor of diabetes compared to BMI. Kim, et al.26 reported that insulin resistance is caused by not only absolute fat mass but also the relative distribution of fat within the body. Other studies have suggested that the accumulation of visceral fat stores affects insulin metabolism by releasing free fatty acids.2728 It is believed that the elevated levels of free fatty acids can induce hepatic insulin resistance, particularly by enhancing gluconeogenesis.1029 This hypothesis is supported by the fact that gluconeogenesis increases in proportion to visceral fat.30
However, there is no consensus on a standard site for measuring waist circumference. Furthermore, waist circumference is more closely related to abdominal subcutaneous fat, which is not as strongly correlated with insulin resistance, than to abdominal visceral fat.3132 We found that, by using DXA, we were able to measure the visceral fat mass of the participants, and these values gave the highest AUC values and Youden's index values among all adiposity indices. There are many methods for measuring abdominal visceral fat, and CT is currently considered the gold standard.1333 However, the costs and radiation exposure may not justify its use as a screening tool. A study in Korea showed that the Lunar DXA visceral fat could be used to measure visceral fat with results comparable to CT, despite being a relatively rapid, inexpensive method with minimal radiation dosage.12
This study had several strengths, including a well-characterized cohort, a standardized protocol, its large sample size, and the adjustment for known and potential confounders. To the best of our knowledge, this is the first study to establish diagnostic thresholds for visceral fat mass as an indicator for diabetes or prediabetes. However, this study also had several limitations. First, due to its cross-sectional design, the direction of causality was unclear. Second, we depended on a single measurement of the adiposity indices for each participant; thus, we were unable to examine inter-individual variation. In addition, the prevalence of obesity has changed rapidly, and the changing patterns in particular can differ greatly depending on age and gender in Korea.34 Therefore, adiposity indices used as independent variables in our study are also likely to change over time. However, we did not measure the change in adiposity indices, which may have resulted in an underestimation of risk. This limitation is inherent in cohort studies, as it is difficult to measure risk factors repeatedly based on changes.
Third, adiposity indices were divided into deciles; thus, on the whole, the change in odds ratios was both linear and constant in each section. However, for visceral fat, the odds ratios increased rapidly in each specific section. This suggests that the measurement of visceral fat via DXA had high specificity yet low sensitivity for the diagnosis of diabetes.
Finally, several studies have reported that diabetic medications induce weight loss.35 However, we do not have any information about this kind of antidiabetic medication. Nevertheless, 77 participants (4.8%) were taking anti-diabetes medications (men, 5.9%; women, 4.1%), although after excluding such patients, our results were maintained.
In conclusion, our data indicate that visceral fat mass, measured via DXA, is associated more closely with diabetes and prediabetes than other traditional adiposity indices, such as waist circumference, due to the ability of DXA to differentiate between abdominal visceral and subcutaneous fat.
 XML Download