

 PDF
PDF ePub
ePub Citation
 Print
Print


INTRODUCTION
Recently, the development of diagnostic techniques using prostate-specific antigen (PSA) has enabled the early detection of prostate cancer (PCa). Using these new diagnostic techniques, the detection rates of PCas at earlier stages and of smaller sizes has increased.1 Nevertheless, treatment of early stage PCa seldom affects prognosis or survival.2 Nearly 15-37% of PCas detected by PSA screening are over-diagnosed,3 and 25.7% of radical prostatectomies found to be cases of insignificant PCa upon pathological analysis of biopsy specimens.4 In cases of insignificant PCa, high cure rates are expected when aggressive treatment, including radical prostatectomy is performed immediately after the diagnosis. However, the adverse effects of treatment can negatively affect the quality of life of the patients. Moreover in some patients, a satisfactory survival rate is to be expected with only regular observation and no treatment. Active surveillance can substitute for radical prostatectomy in elderly patients with other combined diseases that may affect their receiving immediate PCa treatment and in young patients who do not want to risk experiencing the adverse effects of radical treatment such as impotence and incontinence.56
In cases of localized PCa, Gleason score, initial PSA and clinical staging are important factors in predicting biochemical recurrence after radical prostatectomy.7 Of these, Gleason score has a large impact on treatment choices in PCa. In general, providing palliative radical treatment to all low-grade PCa patients in not warranted, because low-grade PCa develops slowly and is clinically meaningless. Notwithstanding, radical treatment, such as radical prostatectomy or external radiation therapy, should be prioritized in cases of high-grade PCa with a Gleason sum of ≥8 on prostate biopsy or extracapsular PCa. Therefore, we suggest the development of a model that predicts high-grade PCa or extracapsular PCa through the analysis of PSA kinetics in PCa patients with a PSA level of ≤10 ng/mL.
MATERIALS AND METHODS
This retrospective, multicenter study was approved by the Institutional Review Boards of all participating institutions. Data from 548 adult male patients who were diagnosed with PCa with transrectal ultrasound (TRUS)-guided prostate biopsy at four Korean hospitals from January 2009 to December 2012 were collected. We retrospectively reviewed data for 155 adult male patients with an initial PSA level of ≤10 ng/mL, whose PSA levels had been checked more than two times at least 6 months before the patients had been diagnosed with PCa at test intervals of ≥3 months, and with intact medical records, including digital rectal examination (DRE) and free PSA levels. The remaining patients were excluded from analysis for urinary tract infection, prostatitis, previous cystoscopy, surgery of the prostate, prostate biopsy prior to PSA level test, and the use of 5-alpha reductase inhibitor medication. We assessed Gleason score according to the modified Gleason grading system set the International Society of Urological Pathology in 2005.8 We separated cases according to their Gleason sum (Gleason sum ≤7 and Gleason sum ≥8) and according to the presence of extracapsular invasion of PCa. Therein, we analyzed differences in PSA velocity (PSAV), PSA density (PSAD), percent free/total PSA ratio (%fPSA), and the presence of a nodule on DRE between the groups.
The PSAV was measured by linear regression analysis according to time intervals for serial PSA levels. The PSAD was calculated by dividing the PSA level prior to biopsy with prostate size on TRUS. The %fPSA was determined by the ratio of the free PSA level to the PSA level prior to biopsy.
We determined the cut-off value of each factor using individual receiver operating characteristic (ROC) curves of significant predictable factors, and analyzed the sensitivity and specificity of the cut-off values for each of the factors.
Statistical significance was estimated by Student's t-test and the chi-square test, as appropriate. All analyses were conducted with SPSS software, version 18.0 (SPSS Inc., Chicago, IL, USA), and all p values <0.05 were considered statistically significant.
RESULTS
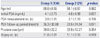
Among the 155 male patients, mean age was 4.2±3.12 ng/mL; mean initial PSA was 4.2±3.12 ng/mL; mean PSAV level was 1.9±3.05 ng/mL/year; mean PSAD was 12.2±9.94 ng/mL/gm; mean %fPSA was 19.2±11.12%; and the presence of abnormality on DRE was 9.6%. Upon prostate biopsy, 134 patients had a Gleason sum of ≤7, and 21 patients had a Gleason sum of ≥8. Also, 129 patients had an organ confined disease and 26 patients had an extracapsular disease. There were no significant differences in mean age, initial PSA level, number of PSA tests, PSA follow-up period, initial prostate size, and number of prostate needle cores between the two groups (Table 1).
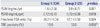
The group with a Gleason sum of ≥8 showed a higher PSAV (3.9±4.77 ng/mL/yr vs. 1.6±2.58 ng/mL/yr, p=0.001) and a lower %fPSA (12.1±5.59% vs. 20.2±11.34%, p=0.004) than the group with a Gleason sum of ≤7. The PSAD and the presence of a nodule on DRE failed to predict differences of Gleason sum on prostate biopsy (Table 2).
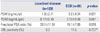
The group with extracapsular disease showed a higher PSAV (3.2±4.24 ng/mL/yr vs. 1.8±2.71 ng/mL/yr, p=0.031) and a lower %fPSA (15.1±7.85% vs. 20.1±11.51%, p=0.015) than the group with organ confined disease. The PSAD and the presence of a nodule on DRE again failed to predict differences in the presence extracapsular invasion of PCa (Table 3).
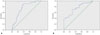
In the ROC curve, the factors predictable of a Gleason sum of ≥8 were PSAV ≥1.405 ng/mL/yr (0.765 sensitivity and 0.697 specificity) and %fPSA ≤13.5% (0.713 sensitivity and 0.647 specificity). The area under the curve (AUC) for PSAV was 0.760 and the AUC for %fPSA was 0.741. The performance of prediction model was higher with PSAV (Fig. 1).
DISCUSSION
Immediate and aggressive treatment has been preferred in cases of clinically localized PCa. Recently, however, active surveillance has emerged as a substitute for definite treatment in cases of patients with clinically localized PCa. PSA and Gleason sum have been used as indicators for carrying out active surveillance. Of these, Gleason sum has been used as a powerful predictive factor of PCa after its introduction 40 years ago. The Gleason sum is important enough to be used as an indicator in nomograms to predict prognosis using Partin tables.9 Higher Gleason sums, especially between 8-10, are categorized as indicating high-risk PCa.10 Treating high-grade PCa with active surveillance is inappropriate because of the risk of biochemical- and distant failure. Establishing a predictive model of high-grade PCa is very important, because the detection of high-grade PCa is an integral part of the guidelines of active surveillance and it helps to select patients who are expected to have high cure rates with immediate radical treatment.
Penney, et al.11 reported that a Gleason sum determined with a prostate biopsy could be an important determining factor for the selection of patients for treatment, because Gleason scores at the time of the biopsy do not change after time. However, a Gleason sum determined from a biopsy and a Gleason sum for specimens taken from a radical prostatectomy exhibit differences of 20-30% due to errors in selecting a biopsy specimen and the nature of PCa, which can have multiple locations.121314 These differences in the Gleason sum are affected by errors in selecting the biopsy specimen, pathological errors, the skill of the pathologist and discrepancy between pathologist.15 Among these factors, errors in selecting the biopsy specimen is regarded as the most important, because the tissue that can be obtained through a 20 mm, 18-gauge needle is less than 0.04% of the total prostate volume of 40 mL. Therefore, skills in performing a prostate biopsy can affect not only the diagnosis of total PCa but also the diagnosis of clinically significant PCa. Bul, et al.16 reported an increase in Gleason score of 21.5% for PCa patients through repeated prostate biopsy. Even when large numbers of PCas are diagnosed with a Gleason sum of 6 or 7, there is no clinical, pathological, or radiological marker that represents the biological significance thereof. Therefore, the development of a complementary marker for high-grade PCa with a Gleason sum ≥8 could be helpful in guiding treatment.
This study was designed to distinguish high-grade PCa with a Gleason sum of ≥8 or clinically advanced PCa through the monitoring of PCa patients for a mean period of 34 months. PSAV, PSAD, and %fPSA were suggested to compensate for the limitations of PSA, as PSA is not specific to PCa and increases in PSA may not appear for small tumors. PSA kinetics could increase the accuracy of the diagnosing PCa with a PSA level of 4-10 ng/mL. The overdiagnosis and overtreatment of clinically insignificant PCa could be lessened by decreasing unnecessary prostate biopsies. Sfoungaristos and Perimenis17 reported that we can predict an increase in Gleason sum in a biopsy after radical prostatectomy with PSA kinetics. Prediction of high-grade PCa in prostate biopsy with PSA kinetics can be used to detect clinically significant PCa. Furthermore, advanced PCa was found in patients with high PSAV and low %fPSA, in which radical prostatectomy is needed.
In cases a Gleason sum of 7, biological prognosis has not been defined clearly. Eifler, et al.9 reported that in cases with a Gleason sum of 7, especially 4+3, the biological prognosis of PCa is similar with a Gleason sum of 8. van As, et al.18 reported that active surveillance is possible even when the Gleason sum is 7 (3+4) because the biological prognosis is similar to a Gleason sum of ≤6. However, Epstein, et al.19 reported that only PCas with a Gleason sum of ≤6 are clinically insignificant. This study was based on a Gleason sum of 8 because the biological prognosis of PCa with a Gleason sum of 7 depends on the first Gleason grade and this has not been defined with certainty yet.
In this study, we were able to find an association between high PSAV and high-grade PCa in prostate biopsy specimens. Thompson, et al.20 reported that PSAV was insignificant in predicting the presence of PCa with a Gleason sum of ≥7. On the other hand, D'Amico, et al.21 reported the possibility of more advanced disease after surgery and high mortality in cases of patients with a PSAV of ≥2 ng/mL/yr before radical prostatectomy. van As, et al.18 used PSAV of 1 ng/mL/yr to decide on the timing of initiation of radical treatment in patients with active surveillance, and approximately 20% of the patients were treated with active surveillance. In this study, the reference value of the PSAV was higher than that in previous studies, thus the possibility of a high-grade PCa with a Gleason sum of ≥8 was higher when the PSAV was ≥1.405 ng/mL/yr on the ROC curve. Raising the PSAV reference value is helpful for detecting clinically significant PCa such as high-grade PCa with a Gleason sum of ≥8.
Catalona, et al.22 reported that the detection rate of cancer was 95% and 25% of unnecessary biopsies could be avoided with a %fPSA of 25% in 50-75 year-old patients with a PSA of 4-10 ng/mL. Nam, et al.23 reported that the additional use of the %fPSA was more helpful than using only PSA level and DRE to predict aggressive PCa with a Gleason sum of ≥7. Similarly with PSAV, adjusting the reference value of the %fPSA could be helpful in detecting high-grade PCa, as, in the present study, the possibility of detecting high-grade PCa was high when the %fPSA was ≤13.5% on the ROC curve.
Interestingly, PSAD did not show relevance with Gleason sum in prostate biopsy in the present study. Brawer, et al.24 reported that the PSAD could not increase the positive predictive value in patients with a PSA of 4-10 ng/mL. Racial differences between Asians and Westerners could be the reason why we could not predict high-grade PCa with PSAD. Kassouf, et al.25 reported that an early prostate biopsy should be performed in patients with a prostate of large size because of the increased level of PSA in benign prostate hypertrophy, which means that a higher proportion of well-differentiated tumors will be detected. Thompson, et al.26 reported that 5 alpha-reductase inhibitor medication could reduce prostate volume, so the diagnosis of a high-grade PCa could be more effective. Herein, we observed no significant difference in detecting high-grade PCa with PSAD, because of the relatively small volume of the prostate in Asians in contrast with Westerners.
This study had several limitations. First, Gleason sum was measured by different pathologists at each of the hospitals. According to McKenney, et al.,27 high reproducibility is found between different pathologists in distinguishing a Gleason pattern of 3 and a Gleason pattern of ≥4. However, measurement of Gleason sums by a single pathologist is better for a more precise study. Second, there could be histological differences between the patients diagnosed with PCa by a single prostate biopsy and the patients diagnosed by repeated prostate biopsies. We included all patients based on the study by Djavan, et al.,28 who reported that there were no differences in staging and histological malignancy of PCa between patients diagnosed with repeated biopsy and an initial prostate biopsy. A separate analysis of PCa patients diagnosed with a single prostate biopsy and with repeated prostate biopsy could be helpful for a more precise study. Third, the statistical significance was lowered because of the small number of subjects. This can be regarded as a result of the poor performance of the regular PSA follow-up due to the lack of recognition of PCa and arguments about the efficacy of the PSA as a screening tool. Finally, patients with PSA >10 ng/mL were excluded in this study. As PSA level increases, the possibility of high grade PCa also increases. Therefore, cases with PSA >10 ng/mL have greater likelihood of involving clinically significant PCa than cases with a PSA level of 4-10 ng/mL. In this study, only patients with PSA level 4-10 ng/mL were included due to the relative difficulty in finding clinically significant PCa in these patients.
In conclusion, we found it was highly possible to diagnose patients with high-grade PCa with Gleason sum was ≥8 when PSAV was ≥1.405 ng/mL/yr or %fPSA reached ≤13.5%. We should consider it highly likely that a high PSAV or a low %fPSA can predict high-grade PCa or clinically advanced PCa in cases where PCa is suspected and the patient is being treated with regular observation or in cases of PCa being managed by active surveillance.
 XML Download