

 PDF
PDF ePub
ePub Citation
 Print
Print


INTRODUCTION
Multi-drug resistant tuberculosis (MDR-TB), defined as TB that is resistant to both isoniazid and rifampin, is a serious global public health issue. In a 2010 prevalence survey, 5.4% of culture-positive TB cases included MDR strains.1 In Korea, TB has an intermediate incidence rate of 97/100000 in 2010,1 while the rate of MDR-TB in new TB treatment is 2.7% and 14.7% in retreatment.2 The treatment success rate of MDR-TB patients in Korea was reported as 45.3-62.6%,3,4 which is similar to the global reported rate of 60% in 2009.5
Treatment of MDR-TB is difficult as second-line drugs are less potent and not as well tolerated as first-line drugs. Updated guidelines for MDR-TB management recommend that treatment regimens should include the fluoroquinolone, pyrazinamide, a parenteral agent such as kanamycin, ethionamide [or prothionamide (PTH)], and either cycloserine (CS) or 17 p-aminosalicylic acid if CS cannot be used.5 Moxifloxacin (MF) and levofloxacin are the two most commonly prescribed fluoroquinolones and have a pivotal role in the treatment of MDR-TB, although MF has better bactericidal activity than levofloxacin.6 Therefore, MF, PTH, and CS are key drugs for MDR-TB treatment, excluding injectable drugs and the first-line drug pyrazinamide. Moreover, in MDR-TB, the initial 2 months is a critical period and should be accompanied by 6 months of continued adjuvant therapy with an injectable drug after the patient first becomes and remains smear- or culture-negative.5 During the treatment of TB, positive cultures following the completion of 2 months of therapy is a marker of an increased relapse risk in drug-sensitive TB7 and a potential indicator of the development to MDR-TB.8
The relatively low rate of treatment success in MDR-TB may be associated with low serum concentrations of anti-MDR-TB drugs. Such low anti-TB drug concentrations have been associated with malabsorption, alcohol use, age, sex, hypoalbuminemia, weight-adjusted dose, and drug formulation.9,10,11,12 While therapeutic drug monitoring (TDM) is commonly used for many drugs, the role of TDM in the treatment of MDR-TB remains uncertain. However, TDM has been recommended by some clinicians as being particularly useful for more complicated patients, including those with more co-morbidities than ordinary patients responding to standard treatment.9 Furthermore, treatment failure or drug toxicities are ongoing concerns in some MDR-TB patients. Thus, dose adjustment using TDM with a prerequisite of appropriate timed sample13 seems to be a better treatment strategy than administering a standard fixed dose, especially in end-stage renal disease and liver disease.7 The need to monitor anti-TB drug levels in order to quickly identify treatment failure has been widely discussed in the literature. Previous studies have shown that low serum concentrations of anti-TB drugs are closely related to treatment failure in human immunodeficiency virus (HIV)-infected14 and non-HIV infected TB patients.15
The aim of the present study was to determine the frequencies of low serum concentrations of anti-MDR-TB drugs and to analyze the effects of these drug concentrations on the 2-month sputum conversion in MDR-TB patients.
MATERIALS AND METHODS
Subjects
The data for this study were retrospectively analyzed at Inje University Busan Paik Hospital. The study was approved by the Institutional Review Board of Inje University Busan Paik Hospital before serum sampling; written informed consent was obtained from all subjects to obtain blood samples.
This study included patients 18-75 years of age who had sputum-culture positive pulmonary TB caused by MDR-TB strains resistant to at least isoniazid and rifampicin based on in vitro drug susceptibility testing (DST) by Löwenstein-Jensen medium, using the absolute concentration method. Patients ultimately enrolled did not have gastroenteropathy on gastrofiberscopy and colonofiberscopy, neuropathy on nerve conduction tests, or renal insufficiency on serum urea nitrogen (BUN), creatinine, albumin, and electrolyte levels. DST results for the drugs prescribed for enrolled MDR-TB patients showed susceptibility to MF, PTH, and CS, except for one patient with extensively drug resistant (XDR)-TB who had a TB strain that was resistant to MF. Serum samples from enrolled MDR-TB patients that were not drawn within 2-6 h after drug ingestion were excluded from drug level measurement. During the initial visit, chest X-rays and computed tomography scans were obtained and interpreted separately by two board-certified experts. The radiologic severity of MDR-TB was estimated based on the recommendations of the National Tuberculosis Association of the United States.16
Serum sample preparation and modified directly-observed treatment
Venous blood was drawn 2-6 h after the ingestion of drugs from 29 MDR-TB patients during their monthly visit. Serum was separated by centrifugation at 1000×g for 10 min and stored at -80℃ until analysis. Serum levels of the anti-MDR-TB drugs MF, PTH, and CS were obtained and measured for MF prescribed at 400 mg/day (n=29), PTH prescribed at 250 mg (n=15) or 500 mg (n=34) twice/day, and CS prescribed at 250 mg (n=49) or 500 mg (n=17) twice/day. The number of samples per drug, which were collected between 2 and 3 hours post-dose, were 11 for MF, 18 for PTH, and 21 for CS.
TB nurses regularly monitored drug compliance and drug adverse events for the participating patients in this study. Monitored adverse drug reactions were categorized by neurologic abnormalities, gastrointestinal trouble, dermatologic abnormalities, and hepatotoxicity. Poor compliance was defined as treatment interruption for more than 20% of the prescribed doses.
LC-MS/MS analysis
Serum concentrations of MF, PTH, and CS were analyzed using a validated high-performance liquid chromatography-tandem mass spectrometry method (LC-MS/MS). Briefly, 180 µL of acetonitrile containing 1 µg/mL of MF-d4 as an internal standard was added to a 20-µL serum sample aliquot. The supernatant was taken after centrifugation at 3000×g for 10 min, and a 1-µL aliquot was then injected into a PE SCIEX API 4000 LC-MS/MS system (Applied Biosystems, Foster City, CA, USA), equipped with an Agilent 1200 series high-performance liquid chromatography (HPLC) system (Agilent, Wilmington, DE, USA). The analytical column was an Atlantis dC18 column (150×2.0 mm, 3 µm; Waters, Milford, MA, USA) with a mobile phase consisting of 0.1% formic acid solution and acetonitrile. A gradient program was used for HPLC separation with a flow rate of 0.2 mL/min. The initial composition of acetonitrile was 30%, maintained for 2 min and then increased to 90% for 5.1 min, followed by re-equilibration to the initial condition for 8 min. The mass spectrometer with an electrospray source was run in the positive mode and m/z 402.0→ 384.0, 181.0→154.3, 103.0→58.0, and 406→388 monitored for MF, PTH, CS, and MF-d4, respectively. The peak areas for all analytes were integrated automatically using Analyst software v. 1.4 (Applied Biosystems). The validation of the assay was performed according to the US Food and Drug Administration guidance for the validation of bioanalytical methods. Calibration curves in the range of 0.2-10.0 µg/mL for MF and PTH and 0.8-40.0 µg/mL for CS were established (r2=0.9996 for MF; r2=0.9980 for PTH; r2=0.9989 for CS). Three quality control samples (low, medium, and high) were used for the validation. The intra-day (n=5) and inter-day (n=5) precisions were less than 11.4%, and the accuracies were between 93.1% and 107.4% for the three anti-TB drugs. In addition, no matrix effects were observed near their elution times.
References in serum levels of anti-MDR-TB drugs
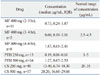
Serum levels of MF, PTH, and CS were measured 2-6 h after dosing, as described previously.7 Normal ranges were defined as 2.5-4.5 µg/mL for MF, 1-5 µg/mL for PTH, and 20-35 µg/mL for CS, based on published reference ranges.9,17 Levels below normal ranges for each drug were defined as MF<2.5 µg/mL (400 mg daily oral dose), PTH<1 µg/mL (500 mg or 1000 mg daily oral dose), and CS<20 µg/mL (500 mg or 1000 mg daily oral dose).
Sputum culture conversion
We defined the critical time for effective MDR treatment as 2 months, based on previous clinical trials on MDR-TB treatment using a culture conversion rate at 2 months.8 Sputum AFB culture conversion was defined as two or more consecutive negative sputum cultures tested at least 4 weeks apart.
Statistical analysis
The median serum levels of each drug in the 2-month sputum conversion group and the 2-month sputum non-conversion group were compared using a two-tailed Mann-Whitney test. Fisher's exact test was used to evaluate differences in the frequencies of low serum concentrations below the normal ranges for each anti-MDR-TB drug. Differences with a value of p<0.05 were considered to be statistically significant. SPSS ver. 12.0 software (SPSS Inc., Chicago, IL, USA) software was used for all statistical analyses.
RESULTS
Participant demographics
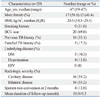
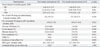
Table 1 presents the baseline characteristics of the 29 enrolled MDR-TB patients. The median age was 47 years (range, 19-67 years), and 17 patients (58.6%) were male. A Bacillus Calmette-Guérin scar was present in 20 patients (69.0%). The median body mass index was 20.5 kg/m2, and 5 patients (17.2%) had a familial TB history. Three patients had diabetes mellitus, although none had HIV disease. In chest radiographs, 16 patients had cavitary disease, and 16 had bilateral lung disease. Sputum non-conversion after 2 months of treatment occurred in 4 patients, and sputum conversion after 2 months of treatment occurred in 25 of 29 of the MDR patients. However, there were no significant differences in clinical characteristics except drug compliance between the 2-month conversion and 2-month non-conversion groups (Table 2). Drug toxicity developed in some patients; this included gastrointestinal trouble (10 of 29), dermatologic abnormalities (3 of 29), and mild hepatotoxicity (3 of 29). A total of 89 serum samples were obtained. MF was prescribed at 400 mg/day, PTH at 250 mg (body weight<50 kg) or 500 mg (body weight≥50 kg) twice/day, and CS at 250 mg (body weight<50 kg) or 500 mg (body weight≥50 kg) twice/day.
Serum moxifloxacin concentration
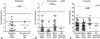
The frequency of low serum MF concentrations below the minimal normal range was 83.3% (20/24). In the conversion group, the frequency of low serum MF concentrations was 85.0% (17/20), compared with 75.0% (3/4) in the non-conversion group, which was not a statistically significant difference (Fig. 1). The median serum concentration in the 2-month sputum conversion group was 1.46 µg/mL [interquartile range (IQR)=0.33-2.17; n=25], and in the 2-month sputum non-conversion group, the concentration was 1.60 µg/mL (IQR=0.93-2.54; n=4); this difference was also not statistically significant (p=0.394) (Table 2). The median concentration from the samples collected between 2 and 3 hours post-dose was 0.73 µg/mL (IQR=0.24-1.87; n=25) (Table 3).
Serum prothionamide concentration
The frequency of serum PTH concentrations below the minimal normal range was 59.2% (29/49). In the conversion group, the frequency of serum PTH concentrations below the minimal normal range was 57.8% (26/45) compared with 75.0% (3/4) in the non-conversion group; this difference was not statistically significant (Fig. 1). The median serum concentration in the 2-month sputum conversion group was 0.93 µg/mL (IQR=0.35-2.34; n=25), and in the 2-month sputum non-conversion group, the concentration was 0.70 µg/mL (IQR=0.24-1.28; n=4); this difference was also not statistically significant (p=0.597) (Table 2). The median concentration of PTH in patients taking 250 mg twice/day (median 0.13 g/mL; IQR 0.06-0.57) was significantly lower than in those taking 500 mg twice/day (median 1.27 g/mL; IQR 0.63-2.61; p=0.0006) (Fig. 1). The median concentrations for all samples according to doses are presented in Table 3.
Serum cycloserine concentration
The frequency of serum concentrations of CS below the minimal normal range was 71.2% (47/66). In the conversion group, the frequency of serum CS concentrations below the minimal normal range was 70.5% (43/61) compared with 80.0% (4/5) in the non-conversion group; this difference was not statistically significant (Fig. 1). The median serum concentration in the 2-month sputum conversion group was 15.10 µg/mL (IQR 8.23-21.65; n=25), and in the 2-month sputum non-conversion group, the concentration was 14.90 (IQR 9.89-19.45; n=4); this difference was also not statistically significant (p=0.981) (Table 2). The median concentration of CS in patients taking 250 mg twice/day (median 13.10 g/mL; IQR 6.80-18.25) was significantly lower than in those taking 500 mg twice/day (median 20.90 g/mL; IQR 17.40-29.80; p<0.0001) (Fig. 1). The median concentrations for all samples according to doses are presented in Table 3.
Differences in sputum conversion after 2 months of treatment
The number of TB drugs used during the initial 2 months of therapy did not differ between the sputum conversion (5.0±0.6) and non-conversion (5.8±1.0) groups. Furthermore, drug toxicity rates were not significantly different between the two groups [8% (2/25) vs. 50% (2/4); p=0.080]. The numbers of patients with a previous TB history [60% (15/25) vs. 25% (1/4); p=0.299] and the numbers of resistant TB drugs on DST per patient were also not significantly different between the two groups, respectively (3.0 drugs, IQR 2.5-4.5 vs. 6.0 drugs, IQR 3.3-8.8). However, the poor compliance rate was significantly greater in the 2-month sputum non-conversion group (75.0%, 3/4) than in the 2-month sputum conversion group (0%, 0/25; p=0.001) (Table 2).
DISCUSSION
During the initial 2 months of treatment, a substantial number of MDR-TB patients did not achieve the minimal therapeutic levels of MF, PTH, and CS. However, these low drug concentrations did not affect sputum conversion after 2 months of treatment. Although the cost-effectiveness and clinical importance of TDM for anti-TB drugs has been uncertain,7 we nevertheless measured serum levels of secondary TB drugs, including MF, a promising new MDR-TB drug.
TDM intervention for conditions other than TB reduces adverse events, mortality rates, and length of stay.18 During the course of complicated MDR-TB treatment with second-line drugs, TDM allows the clinician to make an informed decision about poor drug absorption and to adjust the treatment accordingly in a timely manner.7 Moreover, TDM shortens the time of sputum conversion through adjusting drug dose and decreasing the adverse effects of high levels of anti-TB drugs.15 In diabetics, early TDM for TB patients can have a favorable time to sputum culture conversion.19 Considering that the liquid broth media culture system (MGIT tube; Beacon-Dickinson and Co., Sparks, MD, USA) can produce timely results in 2 weeks, TDM can affect changes in treatment regimens sufficiently.
Reports describing the serum levels of anti-TB drugs in MDR-TB patients are rare. However, the frequencies of low serum concentrations of the secondary anti-TB drugs PTH and CS have been reported to be 52% for PTH and 44% for CS.13 In our study, the frequencies of low serum concentrations of MF, PTH, and CS were 83.3%, 59.2%, and 71.2%, respectively. Interindividual variations in anti-TB drug concentrations can be explained by race, dosage, drug formulations, performance of directly observed treatment, and measurement methods, as well as inaccurate sampling times. In this study, drug dosage was considered a major factor governing the serum PTH and CS levels.
The compliance rate may be another critical factor affecting sputum conversion during the early period of treatment. Concomitant prescription of at least five anti-TB drugs and a relatively high incidence of secondary anti-TB drug-associated side effects can cause low compliance. In addition, drug concentration and pharmacokinetic variability of anti-TB drugs20 as well as drug compliance21 can influence treatment failure and drug resistance acquisition in TB patients, as TB has microbial, clinical, and programmatic causes. In our study, the incidence of side effects in the 2-month sputum non-conversion group (50%) was much higher than that in the 2-month sputum conversion group (8.0%). Our data suggest that anti-TB drug-related side effects may result in poor compliance, leading to sputum non-conversion. Therefore, TDM would be a useful tool for making sound clinical judgments, although case-holding strategies such as direct obser-vation of treatment with anti-TB drugs seems essential for confident compliance and treatment success in terms of sputum conversion.
CS causes frequent central nervous system side effects, such as an inability to concentrate or lethargy; these appear even with serum concentrations at the low end of the normal range and may be aggravated at more elevated serum concentrations.7 In our study, depressive mood and agitation manifested in two patients receiving CS, and these side effects disappeared when CS was discontinued. CS concentrations at the time of adverse drug events were lower than the maximal normal range in both patients. Although gastrointestinal trouble (10/29), dermatologic abnormalities (3/29), and mild hepatotoxicity (3/29) were developed, we could not be certain that these adverse events were solely attributable to MF, PTH, or CS rather than background TB drugs.
This study had several limitations. First, the number of MDR-TB patients was not sufficient to make any definitive conclusions about differences in the 2-month serum conversion rate. Additionally, MDR-TB treatment efficacy was not fully evaluated, as the study considered only microbiological traits, human host characteristics, and environmental factors, as well as serum drug concentration. Second, the serum-sampling interval was relatively wide; thus, we could not assure the peak level of each anti-TB drug. Third, this was a retrospective study; therefore, we were unable to intervene in order to escalate drug doses or to measure serum drug levels. Fourth, although culture conversion after 2 months of treatment is an indicator of treatment effectiveness in drug-sensitive TB,22 there are no accumulated data for MDR-TB treatment that provide evidence for 2-month culture conversion as an indicator of treatment effectiveness in spite of several previously reported clinical studies.8,23 However, these results warrant a prospective detailed pharmacokinetic and pharmacodynamic study of secondary anti-TB drugs at multiple time points in relation to clinical outcomes, as well as an investigation of adverse drug events related to serum drug levels.
In conclusion, the incidences of low serum concentrations among secondary anti-TB drugs were 83.3% in MF, 59.2% in PTH, and 71.2% in CS. Although the clinical meaning of these results remains uncertain, they warrant a larger prospective study that includes scheduled multiple time samplings to determine the role of TDM in MDR-TB patients.
 XML Download