

 PDF
PDF ePub
ePub Citation
 Print
Print


INTRODUCTION
Metabolic syndrome (MS) is the concurrence of multiple metabolic abnormalities associated with the development and progression of atherosclerosis.1 MS is increasingly common, and represents a global public health problem.2,3 Meta-analyses found that the MS increases the risk for cardiovascular disease and all-cause mortality.4-6 Solymoss, et al.7 found that MS was present in as many as 51% of patients with documented coronary artery disease (CAD).
However, it has been reported that MS is a marker of cardiovascular disease risk, but not above and beyond the risk associated with its individual components.8,9 Therefore, the number of markers of MS may be more useful than MS per se to predict the severity of CAD, and it has been used instead of a binary definition of MS in several studies.10,11 Each abnormality promotes atherosclerosis independently, but when clustered together, these metabolic disorders are increasingly atherogenic and enhance the risk of developing CAD and cardiovascular events.12-14
The objectives of our study were to assess the relationship between the MS score and the angiographic severity of CAD, and to assess the predictive value of the individual components of MS for CAD.
MATERIALS AND METHODS
Subjects
From January 1, 2007 to December 31, 2007, we collected clinical, biochemical, and angiographic information from 632 consecutive patients who underwent elective coronary angiography at the Heart Center at Gangnam Severance Hospital, Yonsei University College of Medicine. Patients with recent myocardial infraction (MI), which could potentially affect blood glucose and lipid levels, were excluded from this study.
Definition of metabolic syndrome
The presence of MS was determined using the Third Adult Treatment Panel (ATP III) of the National Cholesterol Education Program (NCEP) criteria with the waist criterion modified into a body mass index (BMI) of more than 25 kg/m2.12,13,15 The high blood pressure (BP) criterion was defined as > 130/85 mmHg or being already on antihypertensive medication. Impaired fasting glucose was defined by a fasting blood glucose (FBG) of ≥ 110 mg/dL or being already on oral hypoglycemic agents or insulin. Low high-density lipoprotein cholesterol (HDL-C) was defined as < 40 mg/dL in men and < 50 mg/dL in women. Hypertriglycemia was defined as fasting triglyceride (TG) ≥ 150 mg/dL. Those who had 3 or more of these 5 components were classified as having MS. Patients were divided into 6 groups according to the number of constituents (0 to 5) of MS- or MS score.
Biochemical tests
Venous sampling was collected in the early morning after an overnight fasting prior to elective coronary angiography using standard venipuncture technique. Insulin resistance was evaluated by the homeostatic model assessment (HOMA) as described by Matthews, et al.16 This is defined by the product of the fasting glucose and fasting insulin divided by a constant. Thus, the HOMA index = [{fasting insulin (U/mL)}×{fasting glucose (mmol/L)}] / 22.5. The low-density lipoprotein cholesterol (LDL-C) concentration was estimated by the formula by Friedewald, et al.17 For subjects with serum TG levels ≥ 400 mg/dL, LDL-C was directly measured by an enzymatic method (Cholestest®-LDL, Sekisui medical Co., Ltd., Tokyo, Japan).
Angiographic assessment
Coronary angiography was performed by the Judkins technique through femoral artery access. The angiographic characteristics, which included lesion location and percentage stenosis, of all coronary lesions in the index coronary angiogram were obtained by thoroughly reviewing the angiogram. CAD was defined as > 50% luminal diameter stenosis of at least one major epicardial coronary artery. The Gensini scoring system was used to calculate coronary disease severity.18 This method defines narrowing of the lumen of the coronary arteries as 1 for 1-25% stenosis, 2 for 26-50% stenosis, 4 for 51-75% stenosis, 8 for 76-90% stenosis, 16 for 91-99%, and 32 for total occlusion. The score is then multiplied by a factor that represents the importance of the lesion's location in the coronary artery system. For the location scores, 5 points were given for the left main lesion; 2.5 for the proximal left anterior descending (LAD) or left circumflex (LCX) artery; 1.5 for the mid segment LAD and LCX; 1 for the distal segment of LAD and LCX, first diagonal branch, first obtuse marginal branch, right coronary artery, posterior descending artery, and intermediate artery; and 0.5 for the second diagonal and second obtuse marginal branches. The grades of luminal narrowing were determined according to the consensus opinion of two experienced interventional cardiologists.
Statistical analyses
Baseline demographic and laboratory data are presented as mean ± SD for continuous variables and frequencies for discrete variables. Comparisons among groups were calculated with an analysis of variance for continuous variables and Pearson's chi-square test for discrete variables. Correlations between the MS score and Gensini score were examined by linear regression analysis. The probability of CAD occurrence in relation to MS, its single traits, and their combinations were estimated as odds ratio (OR) [95% confidence interval (CI)]. All data were analyzed using statistical software SPSS for windows version 13.0 (SPSS Inc., Chicago, IL, USA).
RESULTS
Baseline characteristics
A total of 632 patients (394 men, 61.0 ± 10.6 years of age) were enrolled in this study. Of the 632 patients studied, 497 (78.6%) had CAD and 283 (44.8%) were diagnosed with MS. The distribution of patients with 0 to 5 MS scores is listed in Table 1. In most groups, high BP was the most frequent abnormality, followed by low HDL-C, high BMI, high FBG, and high TG.
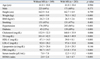
Demographic and biochemical characteristics of patients with and without MS are presented in Table 2. There were no significant differences in age, sex, height, or smoking between the two groups. Patients with MS had higher total cholesterol, TG, and LDL-C, and lower HDL-C. However, the difference in LDL-C was marginally significant. MS patients also had higher dysglycemia indexes. Particularly striking were the differences in serum insulin and HOMA indexes.
Coronary artery disease severity
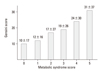
Patients with and without MS did not differ in the prevalence of CAD and diseased vessel numbers (Table 3). However, patients with MS had severer CAD as assessed by the Gensini score compared to patients without MS (23.3 ± 29.2 vs. 15.5 ± 23.4, p = 0.002). Interestingly, although there were no significant differences in baseline characteristics such as age, sex, height, or smoking among the subgroups stratified by the MS score, an increasing MS score was significantly related to the severity of CAD on the coronary angiography. Fig. 1 demonstrates the relationship between the MS score and CAD severity as assessed by the Gensini score system.
Predictive ability for CAD of MS and its components
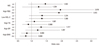
The unadjusted and adjusted predictive abilities for angiographic CAD of MS and its individual components are shown in Fig. 2. Although a diagnosis of MS was associated with the CAD severity assessed by the Gensini score, MS per se did not predict the presence of CAD. Individually, high FBG was the only predictive factor for CAD in univariate analysis OR 2.070, 95% CI 1.371-3.124, p = 0.001). Adjustment for other demographic features, LDL-C, and individual MS constituents did not diminish this association (OR 1.973, 95% CI 1.297-3.000, p = 0.002). Low HDL-C, high BMI, high BP, and high TG were not predictive of CAD in univariate and multivariate analyses.
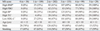
The OR for CAD risk of different phenotypes in high FBG are presented in Table 4. High BP as a companion increased the OR significantly to 2.579. The other single trait of significance was low HDL-C. Among the triads the cluster with high BP and low HDL-C was the highest risk (OR 3.731). Among the quartets, only combinations including high BP and low HDL-C were associated with increased risk (OR 3.256 and 3.167). The OR for the quintet was not significantly increased (OR 1.769, 95% CI 0.572-5.471, p = 0.322). High FBG, high BP, and low HDL-C are significant contributors to CAD risk.
DISCUSSION
In this study, patients with and without MS did not differ in the prevalence of CAD and diseased vessel numbers, but patients with MS had severer CAD as assessed by the Gensini score compared to patients without MS.
One key conceptual advance made with the introduction of MS as a clinically measurable entity was the recognition of abdominal obesity as its most prevalent form.12,19 MS is determined by the presence of 3 or more of quantitatively identified markers. From the clinical perspective, it has been questioned whether MS improves cardiovascular risk prediction, beyond previously used tools for coronary heart disease.20-24 Some studies have assessed whether metabolic syndrome predicts the risk of cardiovascular diseases or a surrogate such as subclinical atherosclerosis.25,26 In the majority of these studies the outcome with which the metabolic syndrome was to be related was atherosclerotic vascular disease, either coronary heart disease alone or stroke. However, in some studies, MS and its components are associated with type 2 DM but have weak or no association with vascular risk, suggesting that attempts to define a criteria that simultaneously predict risk for both cardiovascular disease and DM are unhelpful.23,27,28
The fact that the 5 variables are used as "present" or "absent" likely makes these screening tools less than perfect for the optimal diagnosis of the MS. Furthermore, there is a mosaic of combinations of 3 of the 5 criteria which makes it very unlikely that all these subgroups are similar entities from a pathophysiological standpoint and clinical prognosis.29 The central issue from an epidemiological perspective is whether MS predicts cardiovascular disease more than its individual components. It has been reported that MS is a marker for cardiovascular disease risk, but not above and beyond the risk associated with its individual components.8,9 Therefore, the number of markers of MS may be more useful than MS per se to predict the severity of CAD.10 The results of our study showed that the increased MS score was significantly related to the angiographic severity of CAD. The statistical association with an increasing number of MS features can be explained by the increasing impact of multiple risk factors.
We also evaluated the ability of MS and its individual components to predict angiographic CAD. Type 2 DM has long been recognized as a significant risk factor for CAD and has been acknowledged as a CAD equivalent.13 In the present study, increased FBG was the only significant predictor of CAD although high BP, decreased HDL-C, and increased BMI were the three most frequently observed characteristics.
However, it has been demonstrated that the presence of MS increased the risk of cardiovascular events ten-fold even in patients with DM.30 Therefore, the increased risk appears to be related to risk factor clustering associated with MS.31,32 Individual components may interact synergistically in accelerating the progression of atherosclerosis. Analysis of the 11 possible combinations of individual MS components reveals a striking heterogeneity in their ORs as CAD risk factors. As shown in Table 4, the ORs of these 11 phenotypes vary in a wide range from 1.358 to 3.731, depending upon individual components. MS clusters including high FBG, high BP, and low HDL-C are clearly associated with the highest CAD risk. Our investigation demonstrates that CAD risk strongly depends on the individual components.
The present study shares the limitations with other nonrandomized, retrospective studies, including the possible presence of selection bias and uncorrected confounding. In the subgroup analysis in the patients without DM, high FBG did not show any significance in the prediction of CAD. The subjects in our study were patients who were admitted for clinically suspected CAD, and about 30% of the subjects had DM. Therefore, selection bias and a high prevalence of DM may affect the results.
The presence of abdominal obesity is more highly correlated with metabolic risk factors than is BMI. Thus, the simple measurement of waist circumference, with sex specific thresholds, was recommended by ATP III to identify the body weight component of MS.12,13 However, because waist circumference was not available, we used a BMI of about 25 kg/m2, which was applied as a surrogate in a previous report on the prevalence of obesity and MS in Korean adults.33
In conclusion, the MS score correlates with the angiographic severity of CAD. The predictive ability of MS for CAD was carried almost entirely by high FBG, and individual traits with high BP and low HDL-C seemed to act synergistically as risk factors for CAD.

 XML Download