

 PDF
PDF ePub
ePub Citation
 Print
Print


INTRODUCTION
Computed tomography (CT) is increasingly being used in clinical applications (1). In particular, CT-based quantification of pulmonary function by means of CT densitometry has been shown to yield reproducible results, when using the same acquisition protocol (2345). In patients with chronic obstructive pulmonary disease (COPD), CT-based quantification of emphysema volume and airway thickness has also been validated as a method that yields results that match relatively well with those of pulmonary function tests (PFTs) (67). Furthermore, CT quantification results of the lungs and airways showed significant correlations with PFT results in subjects with normal spirometry; CT quantification parameters may also differ significantly according to smoking history (8). Therefore, the use of CT for quantification of pulmonary function in patients with COPD as well as in healthy individuals is expected to increase in future.
However, the increase in radiation exposure of the population due to this increased CT usage has garnered attention. Much effort has focused on reducing the radiation dose while still maintaining sufficient image quality. Specifically, iterative reconstruction (IR) techniques are being used for some applications. These techniques can potentially decrease radiation exposure and are able to replace the conventional filtered back projection (FBP) (9101112131415). However, the measured CT densitometry results are affected by different image reconstruction approaches, even when the initial CT image data sets are derived from a single individual (16). Although several studies have examined the effects of different IR algorithms, including hybrid-IR (HIR) and model-based IR (MIR), on emphysema quantification (171819), to our knowledge, correlations between PFT results and these IR algorithms have not been investigated in healthy individuals to date.
Therefore, the aims of this study were to compare correlations between PFT results and different reconstruction algorithms and to suggest an optimized reconstruction protocol for CT quantification of the low lung attenuation area and airways in healthy individuals.
MATERIALS AND METHODS
This retrospective study was approved by our Institutional Review Board and the requirement for obtaining informed consent was waived.
Clinical Subjects
The study group consisted of 259 participants in the Ansan cohort included in the Korean Genome Epidemiology Study; these individuals had normal PFT and chest CT scan results. PFT was performed in each subject within 1 week prior to referral for CT scanning. The exclusion criteria were: 1) underlying lung disease, including asthma or pulmonary tuberculosis, 2) taking anti-inflammatory medication, 3) previous surgical lung resection, and 4) severe motion artifacts in the chest CT scan. Finally, 223 subjects were selected for the analysis (120 males and 103 females). Among these subjects, 141 were never-smokers, 63 were ex-smokers, and 19 were smokers. We defined ex-smokers and current smokers as ever-smokers. Clinical data, including smoking history (never-smokers and ever-smokers), height, weight, and body mass index (BMI), were also recorded.
CT Acquisition and Image Reconstruction
All CT images were acquired with a 64-channel multi-detector CT scanner (Brilliance 64; Philips Healthcare, Cleveland, OH, USA). The following CT scanning parameters were employed: detector configuration, 64 × 0.625 mm; rotation time, 0.5 seconds; tube voltage, 120 kVp; tube current, 75 mAs without current modulation; section thickness, 0.625 mm. Contrast injection was not performed. Each subject was examined in the supine position with a breath hold on a deep inspiratory breath.
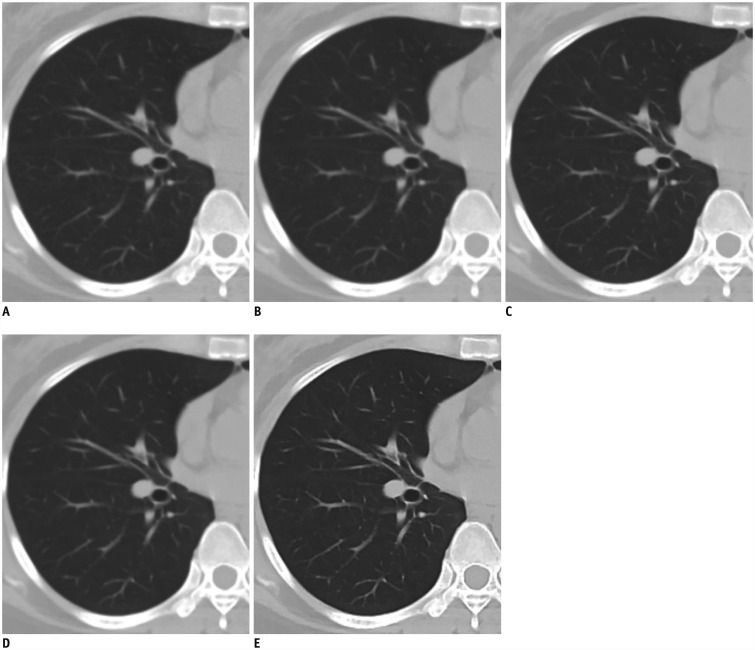
Raw data were reconstructed using three different reconstruction algorithms: FBP, HIR (iDose4; Philips Healthcare), and MIR (IMR; Philips Healthcare). For MIR, three different image definitions were used (IMR-R1, MIR with “body routine”; IMR-ST1, MIR with “soft tissue”; and IMR-SP1, MIR with “sharp plus”; Philips Healthcare) (Fig. 1). For quantification of the low lung attenuation area volume, four reconstruction algorithms were applied (FBP, HIR, IMR-R1, and IMR-ST1). For airway quantification, three reconstruction algorithms were applied (FBP, HIR, and IMR-SP1). For noise reduction, level 4 was used for HIR and level 1 was used for MIR.
Image Analysis
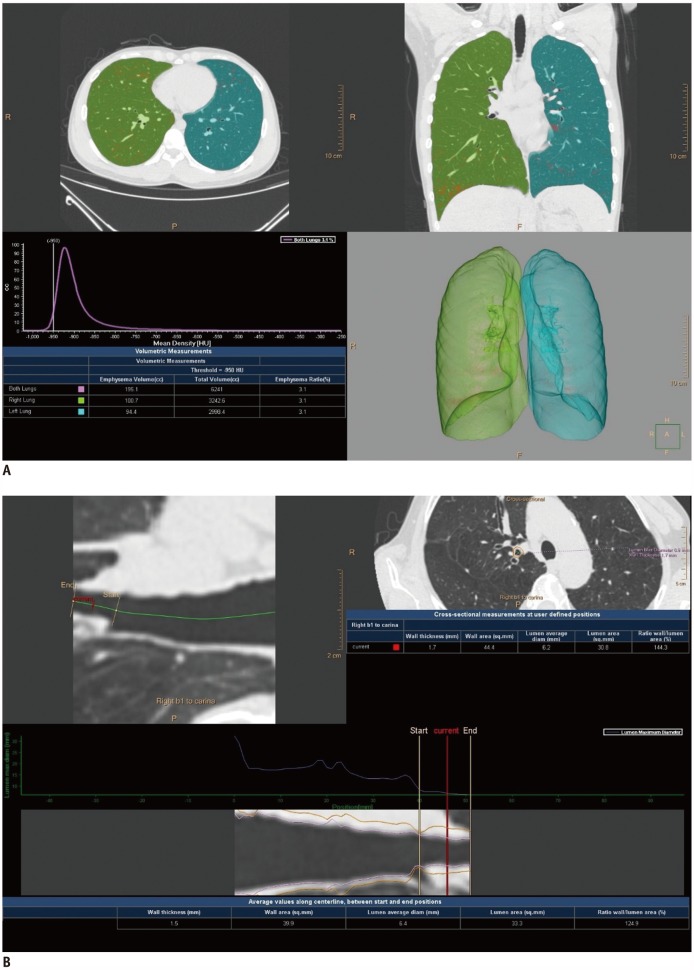
The CT images were analyzed with an automated lung image analysis tool (IntelliSpace Portal 7.0; Philips Healthcare). This tool performs 4 steps: lung segmentation, lung density measurement, airway extraction, and airway measurement. The lungs and lobes are segmented using a model-based algorithm and the trachea are extracted automatically to verify airway extraction. The low lung attenuation area threshold can be preselected; −950 HU was used in this study. For quantitative analysis of the low lung attenuation area volume, classical indexes of emphysema parameters, including total lung volume, emphysema volume with a threshold of −950 HU, and emphysema index (EI), were obtained automatically (Fig. 2A).
For quantitative analysis of airway wall thickness, the Weinheimer method was used. In brief, the proximal portion of the right upper lobe apical segmental bronchus was selected, after which several parameters were measured automatically at that bronchus: luminal area (LA), airway wall area (WA), and wall area percentage (WA% = WA / [WA + LA]) (Fig. 2B).
Pulmonary Function Test
Forced spirometry was performed before and after applying bronchodilator in all subjects. PFT parameters are expressed in liters and percentages. The following spirometric values were investigated for the extent of their correlation with CT parameters: forced expiratory volume in 1 second (FEV1), forced vital capacity (FVC), and the ratio of FEV1 to FVC after bronchodilation (FEV1/FVC).
Statistical Analysis
Demographic variables are expressed as means ± standard deviations. Differences in the low lung attenuation area or airway measurements were compared between algorithms using one-way analysis of variance. Bonferroni's post-hoc test was performed for multiple comparisons. Subgroup analysis was performed according to smoking history; baseline characteristics were compared between never-smokers and ever-smokers using Student's t test for continuous variables and using the chi-square test for categorical variables.
Pearson's correlation coefficients were calculated and linear regression analysis was conducted to evaluate the extent of correlation between different algorithms and PFT results in the overall cohort and in subgroups defined by smoking history. Statistical analyses were performed using SAS version 9.3 (SAS Institute Inc., Cary, NC, USA) and the SPSS package, version 20.0 (IBM Corp., Armonk, NY, USA). All p values < 0.05 were considered statistically significant.
RESULTS
Baseline Characteristics
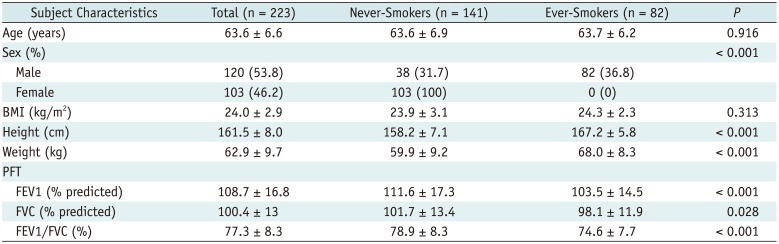
The baseline characteristics of the overall study subjects, never-smokers, and ever-smokers are shown in Table 1. The overall study subjects were divided into two subgroups: 141 never-smokers and 82 ever-smokers. Sex distribution was significantly different between the two subgroups (p < 0.001). Specifically, all the enrolled females were in the never-smokers group, while the ever-smokers consisted of only male subjects. There were significant differences in height and weight (all p < 0.001), although BMI did not show a significant difference between the two subgroups. PFT results, including FEV1, FVC, and FEV1/FVC, were significantly higher in never-smokers than in ever-smokers (all p < 0.05).
Low Lung Attenuation Area and Airway Measurements
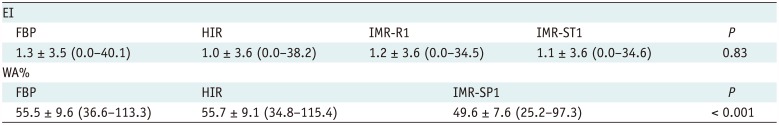
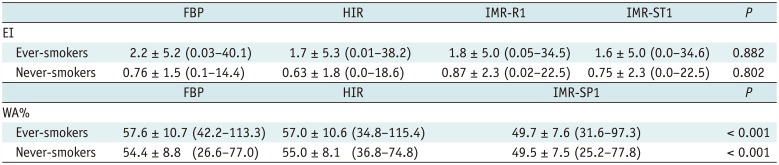
Table 2 compares the mean EI and WA% values for each algorithm. EI was not significantly different between any of the algorithms (p = 0.83). However, WA% was significantly lower in IMR-SP1 than in FBP and HIR (p < 0.001).
Correlation between CT Quantification Measurements and Pulmonary Function Test Results
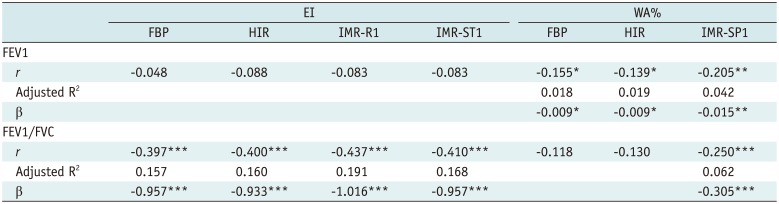
The correlations between CT quantification measurements and PFT results for each reconstruction algorithm are shown in Table 3. In terms of correlations between EI and PFT results, FEV1/FVC showed a significant negative correlation with EI for all reconstruction algorithms (all p < 0.001), while EI of IMR-R1 showed the strongest correlation with FEV1/FVC (r = −0.437). In terms of correlations between WA% and PFT results, FEV1 showed a significant negative correlation with WA% for all the reconstruction algorithms (all p < 0.05), while WA% of IMR-SP1 showed the strongest correlation with FEV1 (r = −0.205). However, FEV1/FVC correlated significantly with WA% only in IMR-SP1 (r = −0.250). In linear regression analysis, the EIs of FBP, HIR, IMR-R1, and IMR-ST1, and WA% of IMR-SP1 were significant independent predictors of FEV1/FVC. WA% of FBP, HIR, and IMR-SP1 were also significant independent predictors of FEV1.
Subgroup Analysis according to Smoking History
Tables 4 and 5 show the results of the subgroup analysis according to smoking history (ever-smokers vs. never-smokers). EI did not show significant differences between any of the algorithms in either the ever-smoker or never-smoker subgroup (p = 0.882 and p = 0.802, respectively). However, WA% of IMR-SP1 was significantly lower than that of FBP and HIR in both the ever-smoker and never-smoker subgroups (all p < 0.001). EI was significantly higher in the ever-smoker than in the never-smoker subgroup for all reconstruction algorithms (all p < 0.001). While WA% was higher in the ever-smoker subgroup than in the never-smoker group in all reconstruction algorithms, the differences were not significant (p = 0.062 in FBP, p = 0.232 in HIR, and p = 0.981 in MIR).
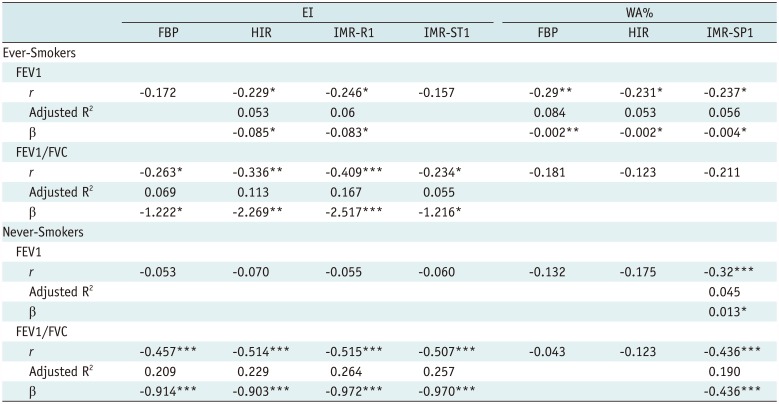
In the ever-smoker subgroup, the EI of HIR and IMR-R1 showed a significant negative correlation with FEV1, and EIs in all the algorithms had significant negative correlations with FEV1/FVC. Among these algorithms, the EI of IMR-R1 showed the strongly correlation with FEV1 (r = −0.246) and FEV1/FVC (r = −0.409). In the never-smoker subgroup, all algorithms showed a significant negative correlation between EI and FEV1/FVC, and IMR-R1 also demonstrated the strongest correlation with FEV1/FVC (r = −0.515). In the linear regression analysis, EIs of all the reconstruction algorithms were significant independent predictors of FEV1/FVC in both subgroups. The highest R2 value was observed for IMR-R1 among both ever-smokers and never-smokers (ever-smokers, R2 = 0.167; never-smokers, R2 = 0.264). The EIs in HIR and IMR-R1 were significant independent predictors of FEV1, but only in the ever-smoker subgroup.
In terms of the correlations between WA% and PFT results, FEV1 showed significant negative correlations for all reconstruction algorithms in the ever-smoker subgroup, whereas WA% of only IMR-SP1 showed a significant negative correlation with FEV1 in the never-smoker subgroup. However, in terms of the correlations between WA% and FEV1/FVC, only IMR-SP1 in the never-smoker subgroup demonstrated a significant negative correlation (r = −0.436). In linear regression analysis, WA% of all the reconstruction algorithms in the ever-smoker subgroup was a significant independent predictor of FEV1. In the never-smoker subgroup, however, WA% of IMR-SP1 was the only significant independent predictor of FEV1 and FEV1/FVC.
DISCUSSION
This study demonstrated a correlation between PFT results and CT quantification using different reconstruction algorithms in normal study subjects. Overall, the EIs of all the reconstruction algorithms, involving FBP, HIR, and MIR (IMR-R1 and IMR-ST1) showed significant correlations with FEV1/FVC. Among these, the EI of MIR (IMR-R1) had the strongest correlation with FEV1/FVC. Among the algorithms, WA% of MIR (IMR-SP1) demonstrated a significant correlation and the strongest correlation with FEV1 and FEV1/FVC, respectively. In the subgroup analysis, the EI measured by MIR (IMR-R1) had the strongest correlation with PFT in both the ever-smoker and the never-smoker subgroups, although the EI did not differ significantly between the reconstruction algorithms. Among the different algorithms, only MIR (IMR-SP1) also yielded a significantly thinner airway thickness than the other algorithms. Moreover, airway measurement in MIR showed the strongest correlation with PFT in both the ever-smoker and never-smoker subgroups.
Several studies have examined the effect of MIR on emphysema quantification in CT. In a recent prospective study, the EI was shown to decrease significantly with the use of MIR (20). Another study compared FBP and MIR (ADIR 3D; Canon Medical Systems, Tochigi, Japan), using different dose settings (21). In this study, the extent of emphysema was more consistent across different dose settings when using MIR than when using FBP. Nishio et al. (22) suggested that the use of MIR (ADIR 3D) could improve the consistency of emphysema quantification between low-dose and standard-dose CT. In our study, we demonstrated that the EI measured using MIR (IMR-R1) had the strongest correlation with PFT, although there was no significant difference in the EI between the reconstruction algorithms. This finding could be explained by the lower mean EI of our study population than that reported in previous studies (1.3 ± 3.5 [EI of FBP in our study] versus 3.13 ± 0.59 [EI of FBP reported by Martin et al.]) (20). Moreover, our cohort included individuals with normal PFT results. In addition, the EI of our study population was similar to that of a previous study that reported on CT quantification of the lung and airways in normal Korean subjects (8).
Choo et al. (17) reported that airway wall measurements differed significantly among the three algorithms used, with MIR yielding thinner walls than adaptive statistical IR (ASIR) and FBP. Furthermore, MIR seemed to provide the most accurate measurements among all the algorithms (17); those authors also used a phantom to validate the accuracy of airway measurement using each reconstruction algorithm. The absolute measurement errors were lowest for MIR, in the increasing order of MIR, ASIR, and FBP. We also found that MIR (IMR-SP1) yielded significantly thinner airway thickness than did the other algorithms. In addition, airway measurement in MIR showed the strongest correlation with PFT. Based on these results, we inferred that the choice of reconstruction algorithm can affect the relationship between CT quantification measurement and PFT in the normal population. In addition, a suitable reconstruction algorithm must be selected to obtain the CT quantification measurement most relevant to PFT results.
In the analysis of subgroups defined by smoking history, we also demonstrated a correlation between CT measurement and PFT results for the different algorithms. In our study, the EI of MIR (IMR-R1) showed the strongest correlation with FEV1/FVC in both ever- and never-smokers. Moreover, WA% of MIR (IMR-SP1) showed a significant correlation with FEV1 in ever-smokers, and with both FEV1 and FEV1/FVC in never-smokers. Another recent study of normal subjects reported similar results: the bronchial wall thickness of the inner perimeter of the 10-mm diameter airway (Pi10) in ever-smokers correlated significantly with FEV1/FVC (8). Thus, we propose that MIR is the best reconstruction algorithm for CT quantification of the low lung attenuation area and airway, because the measurements in MIR showed the strongest correlation with the PFT results in both ever-smokers and never-smokers.
In previous studies, it was reported that MIR reduced image noise and artifacts and improved the visualization of thoracic structures in chest CT (23). Additionally, the non-linear image noise reduction by IMR improved both quantitative and qualitative image quality, allowing a further radiation dose reduction (23242526). The results from these previous studies seem to support our results that MIR is the best reconstruction algorithm for CT quantification of low lung attenuation area and airway, showing the best correlation with the PFT in the normal population with/without smoking history, although we did not analyze image quality of each reconstruction algorithm.
Our study had several limitations. First, the ever-smoker subgroup consisted entirely of males. Since there was a significant sex difference in the PFT results and CT measurements, this may have produced errors when evaluating the influence of smoking in a large cohort. Second, there was no standard reference for low lung attenuation area and airway quantification.
In conclusion, CT quantification of low lung attenuation area and airway using MIR showed a better correlation with PFT results than did HIR and FBP, in normal subjects. These results indicate that CT using MIR is useful. They also provide more accurate values for quantitative measures of the low lung attenuation area and airway, as well as for morphologic assessment, in routine check-up of the normal population.
 XML Download