

 PDF
PDF ePub
ePub Citation
 Print
Print


INTRODUCTION
Low-dose chest computed tomography (CT) has been widely used for lung cancer screening recently (1). However, the increased use of CT has also raised concerns about the risk of exposure to ionizing radiation. Current studies have focused on reducing the CT radiation dose in patients, using a lower tube current or voltage, or automatic tube current modulation according to patient size, body region, and protocol type (2). However, low-dose CT is associated with high image noise, which affects diagnostic performance, especially with conventional filtered back projection (FBP). Growing demand for reducing the radiation dose and image noise simultaneously has prompted the development of iterative reconstruction (IR) techniques. Many studies have reported the feasibility of IR on chest CT to reduce image noise, and improve the objective and subjective imaging quality (3456). As a result, there is an increased tendency to use IR rather than FBP in CT scans of all body parts (7).
The detection rate of small lung nodule is improved when the CT images are reconstructed with thin slice thickness (8910). Studies showed that thin-section low-dose CT screening reduced lung cancer mortality (111). Recent guidelines recommend that screening CT scans using an image of 1-mm slice thickness are preferable (12). However, the total number of images increases with a 1-mm slice thickness reconstruction compared with thicker image slices, which contributes to radiologist fatigue (13). Strub et al. (14) tested a hybrid CT algorithm to simultaneously optimize lung and soft-tissue characterization and to limit the number of images generated and stored. They generated hybrid images using the following method. First, the images were reconstructed using two types of conventional reconstruction algorithm (lung and soft-tissue algorithms). The images were retrospectively combined resulting in substitution of soft-tissue algorithm pixels less than −150 Hounsfield units (HU) or greater than 150 HU with corresponding lung kernel-reconstructed pixels. The hybrid kernel was equivalent to both the lung reconstruction and standard reconstruction algorithms to detect abnormalities of lung parenchyma and soft tissues.
Despite the frequent use of IR and hybrid kernel, no previous study investigated the impact of qualitative and quantitative analysis of pulmonary nodules or calcium detection. The identification of calcium in pulmonary nodules is important when analyzing the characteristics of pulmonary nodules (15). The presence of calcification in pulmonary nodules facilitates the differentiation of benign from malignant nodules and may affect the patients' clinical course when determining follow-up plans or treatment methods. We speculated that IR or hybrid kernel affected the measurement of calcium volume or detection rate, because the image noise reduction affects the beam hardening of calcification. Especially, in case of small nodules, it may affect the visibility of calcifications.
Therefore, the purpose of this study was to evaluate the differences in calcification detection rates and calcium volumes in lung nodules among various reconstruction methods using hybrid kernel and IR. In addition, we compared the CT number and noise (standard deviation [SD] of HU) among groups.
MATERIALS AND METHODS
Subjects
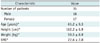
In this study conducted at a single center, 245 patients who had undergone low-dose chest CT for health screening between August 2015 and October 2015 were enrolled. The principal investigator reviewed all images and selected the eligible patients for participation. The inclusion criteria were visible calcifications in small pulmonary nodules (< 4 mm) on low-dose non-enhanced chest CT images reconstructed with FBP, conventional lung kernel (FC55). Patients with inadequate quality of CT image such as motion artefact, respiratory artifact, and severe noise caused by obesity were excluded from the study population. Thirty-five patients (18 males and 17 females; age range, 43–73 years; mean age, 61.2 ± 9.3 years) were finally selected. The subject characteristics are summarized in Table 1. Our local ethics committee approved this study, and written informed consent was waived.
CT Examination and Data Reconstruction
All CT images were obtained with a low-dose non-enhanced chest CT protocol using a 320-detector-row scanner (Aquilion ONE; Canon Medical Systems Corporation, Otawara, Japan). The chest CT scan range extended from the upper end of the lung apex to the lower region of the diaphragm. The CT scan was performed with the following parameters: 320 × 0.5 mm2 collimation, a 350-ms gantry rotation time, and 175-ms temporal resolution. The tube voltage was 120 kVp, and the tube current ranged from 20 mA to 60 mA, and was modulated with commercial software (SUREExposure 3D®; Canon Medical Systems). All data sets were processed with FBP and IR (adaptive iterative dose reduction (AIDR-3D mild level; Canon Medical Systems) with 1 mm slice thickness, and 1 mm interval.
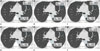
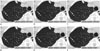
Reconstruction of raw data was performed using FBP or IR algorithm (AIDR-3D), with three types of reconstruction kernels: FC55, hybrid kernel (FC13-H), and conventional soft tissue kernel (FC13). The hybrid reconstruction method used in our study was based on the conventional soft tissue reconstruction kernel algorithm. The pixels of the CT numbers ranging from −1100 HU to −200 HU were processed with a sharp lung kernel (16), and the pixels outside this range corresponded to the soft tissue kernel algorithms. Therefore, six different protocols were used: FC55/FBP, FC55/AIDR-3D, FC13-H/FBP, FC13-H/AIDR-3D, FC13/FBP, and FC13/AIDR-3D. Images were transferred to commercial software (Aquarius iNtuition Edition Ver. 4.4.11; TeraRecon Inc., Foster City, CA, USA) for post-processing and analysis.
Image Analysis
Quantitative and Subjective Analysis of Lung Nodule Calcification
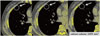
A radiologist (with 10 years of experience in chest imaging) measured the calcium scores of lung nodules on each reconstructed image such as FC55/FBP, FC55/AIDR-3D, FC13-H/FBP, FC13-H/AIDR-3D, FC13/FBP, and FC13/AIDR-3D for quantitative analysis using a coronary calcium scoring tool in the commercial software (Aquarius iNtuition Edition Ver. 4.4.11; TeraRecon Inc.). Lung nodule calcium scores were quantified using the modified Agatston scoring method (17): calcification was identified as ≥ 1 mm3 with a density of ≥ 130 HU. Automatic quantification of calcium volumes was initiated with the radiologist's designation for calcified lung nodules on each axial CT image. The overall volume of calcium was recorded in the workstation by the summation of calcium score in each slice (Fig. 1).
For subjective analysis, two radiologists (with 10 years of experience in chest imaging and with 4 years of experience in chest imaging) independently interpreted each of the targeted nodules based on their calcification detected with naked eyes (calcium-visible or calcium-invisible nodules) on each reconstructed image. Image analysis was performed in a mediastinal window setting (window level, 50 HU; window width, 450 HU) and the following pulmonary settings (window level, −500 HU; window width, 1500 HU), using a PACS viewer (INFINITT PiviewSTAR; Infinitt Healthcare, Seoul, Korea). The radiologists were permitted to adjust the window settings. Each radiologist was blinded to the kernel and reconstruction method. If the interpretation of the lesion such as presence of calcification differed between the two radiologists, it was resolved through a consensus after discussion.
CT Number and Image Noise
Image noise was determined as the SD of the CT values in a region of interest (ROI) placed in the descending aorta and lung parenchyma. Circular ROIs were drawn in the descending thoracic aorta at the level of the carina (15–20 mm diameter) for each image data set. Calcifications, soft plaques of the aortic wall and areas with prominent streak artefacts were carefully avoided. In cases of lung parenchyma, circular ROIs were also drawn in the homogeneous part of the lung parenchyma at the level of the carina (approximately 10 mm in diameter) (Fig. 2).
Radiation Dose Estimations
Radiation doses delivered during CT examinations were retrieved from patient protocols. The dose length product (DLP) was recorded for each patient by the CT system. The effective radiation dose was calculated using a conversion coefficient for the chest (k = 0.014 mSv/[mGy·cm]) (18).
Statistical Analysis
Data analysis was performed using statistical software (SPSS version 20.0; IBM Corp., Armonk, NY, USA). In all analyses, a p value less than 0.05 was considered statistically significant. Continuous variables were reported as the mean ± SD. One-way ANOVA was used to evaluate the difference in the CT number and noise between various reconstruction protocols and multiple comparisons were performed with Tukey's range test. The quantitative data were analyzed using Levene's test for the equality of variance. Error bars were constructed for comparison of calcium volumes between different reconstruction protocols.
We used the intraclass correlation coefficient (ICC), which is an index of concordance between each calcium volume and those obtained by the reference standard (FC55/FBP). ICC values of 0.00–0.20 were indicative of poor agreement; 0.21–0.40, fair; 0.41–0.60, moderate; 0.61–0.80, good agreement; and 0.81 or more, very good agreement.
The extent of inter-observer agreement was assessed using Cohen kappa statistics. Based on the kappa values, the strength of agreement was categorized as poor, < 0.2; fair, 0.2 to < 0.4; moderate, 0.4 to < 0.6; good, 0.6 to < 0.8; and very good, 0.8 to 1.
The Student's t test was used to verify the correlation between the calcium scores and the quantitative results obtained with each of the reconstruction protocols. The receiver operating characteristic (ROC) curve analysis was performed to evaluate the degree of calcification detected in lung nodule with each reconstruction protocol.
RESULTS
The quality of all CT images was good for interpretation. The mean DLP was 74.8 ± 22.4 mGy·cm, and the overall mean effective radiation dose of chest CT was 1.05 ± 0.3 mSv.
Quantitative and Subjective Analysis of Lung Nodule Calcification
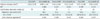
The total numbers of 78 calcified nodules (mean calcium volume: 2.22 ± 2.78 mm3) detected in FC55/FBP images represented the reference standard for analysis. The number of calcified nodules according to the location was as follows: 17 in the right upper lobe, 6 in the right middle lobe, 36 in the right lower lobe, 14 in the left upper lobe, and 5 in the left lower lobe.
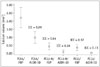
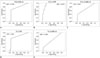
The calcium volume varied significantly with reconstruction protocols. There was very good agreement for FC55/AIDR-3D (ICC = 0.89), good agreement for FC13-H/FBP (ICC = 0.64), moderate agreement for FC13/FBP (ICC = 0.57), fair agreement for FC13-H/AIDR-3D (ICC = 0.26), and poor agreement for FC13/AIDR-3D, which showed the smallest volume (0.04 ± 0.22 mm3, ICC = 0.13) (Table 2, Figs. 3, 4).
The number of calcified nodules on the FC55/AIDR-3D protocol was 63 and the calcium detection rate was 80.7% (63/78; the detection rates of two radiologists were 83.3% and 76.9%, respectively). The numbers of calcified nodules on FC13-H/FBP, FC13-H/AIDR-3D, FC13/FBP, and FC13/AIDR-3D protocols were 12, 5, 41, and 22, respectively, and the calcium detection rate was 15.4% (12/78), 6.4% (5/78), 52.6% (41/78), and 28.2% (22/78), respectively. The inter-observer agreement for the detection of calcification in lung nodules between the two observers was good on FC55/AIDR-3D (k = 0.655) and FC13/FBP (k = 0.665), moderate on FC13-H/AIDR-3D (k = 0.415) and FC13/AIDR-3D (k = 0.507) and fair on FC13-H/FBP (k = 0.285) (Table 2).
The mean calcium volume of calcium-visible nodules on naked eyes was larger than that of calcium-invisible nodules in each reconstruction protocol with partially statistical significance (Table 3). The area under the ROC curve for detection of calcification in the lung nodule via each reconstruction protocol was as follows: FC55/AIDR-3D = 0.765, FC13-H/FBP = 0.931, FC13-H/AIDR-3D = 0.66, FC13/FBP = 0.80, FC13/AIDR-3D = 0.591 (Fig. 5).
CT Number and Image Noise
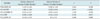
The mean CT number of aorta and lung parenchyma was 50.7 ± 6.9 HU and −887.3 ± 39.4 HU on FC55/FBP; 48.7 ± 5.4 HU and −885.7 ± 37.9 HU on FC55/AIDR-3D; 49.9 ± 6.3 HU and −881.2 ± 40.0 HU on FC13-H/FBP; 47.6 ± 5.7 HU and −884.0 ± 38.0 HU on FC13-H/AIDR-3D; 47.9 ± 5.5 HU and −887.3 ± 38.0 HU on FC13/FBP; and 48.0 ± 5.5 HU and −885.0 ± 37.6 HU on FC13/AIDR-3D, respectively. The mean CT numbers were not different between the reconstruction protocols in both aorta and lung parenchyma (p = 0.193 in aorta, p = 0.986 in lung parenchyma). However, a significant difference in image noise (SD) among the six types of reconstructed images was observed for the aorta and lung parenchyma (p < 0.001). The image noise of the aorta and lung parenchyma was 114.3 ± 19.2 and 96.2 ± 23.5 on FC55/FBP; 47.6 ± 3.9 and 53.9 ± 8.6 on FC55/AIDR-3D; 53.3 ± 9.7 and 113.3 ± 22.7 on FC13-H/FBP; 20.3 ± 2.1 and 46.2 ± 6.8 on FC13-H/AIDR-3D; 54.1 ± 10.1 and 40.3 ± 7.9 on FC13/FBP; 20.2 ± 2.0 and 21.7 ± 4.1 on FC13/AIDR-3D, respectively (Table 4).
DISCUSSION
The introduction of multidetector CT has led to a substantial increase in the number of incidentally detected small pulmonary nodules. As the presence or absence of calcification in solitary pulmonary nodules may indicate its benign or malignant features, the presence of calcification in lung nodules is an important feature for radiological evaluation (19). The challenge is to accurately distinguish the benign nodules from the malignant types, to avoid unnecessary invasive procedures (20212223). In our study, we performed quantitative and subjective analysis of the calcium volume in lung nodules on chest CT scans acquired with various reconstruction protocols to determine the effects of IR and hybrid kernel on the detection of calcification. We found that both IR and hybrid kernel significantly influence not only the image noise but also the calcium volume or the calcium detection rate in lung nodules.
CT reconstruction kernels affect the visual properties of reconstructed images by suppressing or enhancing specific ranges of spatial frequencies, with the ultimate choice of reconstruction kernel determining the lesion-detection performance (24). In thoracic imaging, both the lungs and the mediastinum require optimized reconstruction kernels, suggesting that two separate data sets with different reconstruction algorithms are usually needed. Strub et al. (14) proposed that the hybrid reconstruction kernel is a promising technique, which allows the simultaneous evaluation of lungs and soft tissues, while significantly reducing the number of images needed for transmission, storage, and review. However, no quantitative analysis was conducted for the feasibility of the hybrid reconstruction kernel.
Iterative reconstruction leads to a substantial reduction in radiation dose in CT examinations compared with conventional FBP algorithms by eliminating image noise and artefacts arising from the low radiation dose during IR processing (3). In a recent literature review of studies published between 2006 and 2012 (25), IR was found to reduce image noise and improve image quality in chest CT, with a reduced radiation dose of 23–76%, compared with FBP. Previous studies investigating IR algorithms for the quantification of coronary arterial calcium using the Agatston score reported that the calcium score based on IR techniques facilitated the assignment of an individual to the same risk class, whereas the quantified numerical values of calcium scores varied significantly between IR techniques and traditional FBP (2627). Based on these studies, we speculated that the IR techniques yield different calcification scores of lung nodules. Statistical IR algorithms attempt to model and regulate the noise, and no prior knowledge of the noise is used in the reconstruction. Small calcifications, occasionally the size of a single or a couple of pixels, are intrinsically difficult to distinguish from noise, and therefore ‘mistaken’ by the algorithm for noise. Therefore, the use of IR might lower the calcium detection rates and calcium volumes in our study.
We found that the image noise of thoracic aorta in the hybrid kernel was similar to that of conventional soft tissue kernel, whereas the image noise of lung parenchyma in hybrid kernel was similar to that of conventional lung kernel. FC13-H/FBP showed the highest image noise in the lung parenchyma among the six reconstruction methods, and may influence the perception of calcium in lung nodules. We speculate that the “sharpening process” in the hybrid kernel, which uses an edge-enhancing filter, may amplify the image noise.
In our study, the calcification was inadequately displayed on hybrid kernel images similar to conventional soft tissue kernel. Even if the ICC value of calcium volume in hybrid kernel was better than that of conventional soft tissue kernel, the calcium detection rate was significantly low in the hybrid kernel. We speculated that the blooming artefacts caused by calcification of lung nodule are eliminated in the hybrid kernel during the sharpening process of lung parenchymal opacity. Therefore, the hybrid kernel leads to poor visualization and detection of calcifications. Our study shows good inter-observer agreement between radiologists for the detection of calcified nodule. However, the strength of inter-observer agreement was fair, especially in the FC13-H/FBP reconstruction protocol, which showed the lowest kappa value. During the discussion between the two observers for subjective analysis of the final results, it was difficult to determine the presence of calcifications in some nodules.
There were some limitations in our study. First, the data were retrospectively acquired from a limited sample of patients, and the potential selection bias was unknown. A review of large number of patient databases with calcified pulmonary nodules is needed to determine the extension of the study results to a larger population. Second, this study used the modified Agatston method of calcium scoring system, and therefore, low-density calcified nodules (below than the 130 HU) were not detected. Therefore, differences in the calcification detection rate and calcification volume errors are possible, although they were not statistically significant. Third, six different protocols may be often discriminated based on images with different textures, and therefore, true blinded evaluation may not be feasible in our study. Fourth, we failed to evaluate the association between the location and calcium score in the pulmonary nodules, due to the small number of pulmonary nodules at each location for analysis. Since the radiation dose may change according to the location of the nodule in the chest, there is a possibility of location effect on the volume of calcifications. Finally, in this study, all the CT images were obtained using a low-dose chest CT protocol and we regarded FC55/FBP as the reference standard. However, we were not certain if the low-dose protocol was optimized for FBP or AIDR-3D. Optimization of the protocol for AIDR-3D increases the noise level of the FBP images, which adversely affects the evaluation of calcification. Therefore, further studies into interaction of low-dose protocol and reconstruction method are required.
In conclusion, IR and hybrid kernel facilitates significant reduction of image noise; however, they also reduce the calcium volume in lung nodules resulting in false-positives via misdiagnosis of benign pulmonary nodules as malignant nodules. Therefore, it is important for radiologists to consider this phenomenon when IR and hybrid kernel are used in clinical practice for the detection of calcified lung nodules.
 XML Download