

 PDF
PDF ePub
ePub Citation
 Print
Print


INTRODUCTION
Diffusion-weighted imaging (DWI) is now being widely used for tumor detection and localization, evaluation of tumor aggressiveness, local staging, and detection of local recurrence following various therapies in patients with prostate cancer (12345). With DWI, good contrast in signal intensity between the cancerous tissue for better cancer detection. It has recently been reported that DWIs obtained with high b-values over 1500 s/mm2 provide good contrast between the cancerous and background tissue for prostate cancer detection (6789). However, ultra-high b-value DWI has a limited signal-to-noise ratio (SNR) in association with possible eddy current distortions by large diffusion sensitizing gradients (10). Computed DWI is a mathematical computation technique that generates DWIs of any b-value by using DWI data with at least two different b-values, which benefits the SNR of the image (11). Therefore, computed DWI can be described as calculated DWI or synthesized DWI. This review aimed to present an overview of computed DWI and discuss its current and future role as well as the cautions required in the diagnosis of prostate cancer.
Theory of Computed DWI
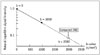
The computed DWI signal at b = bc can be obtained with the equation Sc = Sa exp (− [bc − ba] ADC), in which Sc is the signal of the computed image with a b-value of c and Sa is the signal of the acquired image with a b-value of a (11). The apparent diffusion coefficient (ADC) is calculated with the equation ADC = ln (Sa / Sb) / (ba − bb), using two measured DWI signals, Sa and Sb, based on a monoexponential model. The schema is shown in Figure 1. The strength of this technique is that DW images with higher b-value can be obtained from images with lower b-values (i.e., the additional image acquisition with higher b-values is not required to generate computed DWI).
Certain recent magnetic resonance (MR) scanners are equipped with this application. Computed DW images can also be generated by certain types of software. The computation time range depends on the situation, but is usually 3–5 minutes for 20–25 slices.
Image Quality of Computed DWI
Images with high b-values sometimes show distortion because of the heterogeneity of the gradient field, especially for the 3T MR system. Such distortion can be reduced with computed DWI because images with lower b-values can be used for creating images with higher b-values (12). Rosenkrantz et al. (13) support the ideology that computed DW images at b-value of 1500 s/mm2, generated from DW images at b-values of 50 s/mm2 and 1000 s/mm2 at 3T, showed lesser distortion and ghosting than acquired DW images at b-value of 1500 s/mm2. For minimizing eddy current distortion, several techniques including parallel imaging and multi-transmit system are now being used (1415), and it may also be possible to use computed DWI as one such technique.
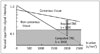
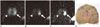
A CuSO4 phantom study performed by Blackledge et al. (11) showed that noise remains constant across b-values for acquired images, whereas it decreases for computed images with increasing b-value (more than 840 s/mm2). Another phantom study demonstrated that contrast-to-noise ratio exhibited a continued rise with increasing b-value at a rate dependent on the difference between the diffusion coefficients in lesions and normal tissue (16). Thus, the computed DWI technique is more likely to highlight differences in signal intensity between cancerous and non-cancerous tissue on images with high b-values, than on acquired images. In fact, another study proved that a better contrast ratio between cancerous and non-cancerous lesions was obtained on computed DW images than on acquired DW images with high b-values (2000 s/mm2) (17). They generated computed DW images from DW images at b-values of 0 s/mm2 and 1000 s/mm2 at 3T MR setting. The study supported the theory that computed DWI can suppress background noise, maintain lesion signals, and lead to a better contrast between the cancerous lesions and normal tissue (Figs. 2, 3), which is an important benefit of computed DWI.
Diagnostic Performance of Computed DWI
Detection of prostate cancer can sometimes be difficult because of the high signal of the background parenchyma, which results from bleeding and presence of hypertrophy and inflammation. Previously, several studies demonstrated the advantages of DWIs using high b-value (2000 s/mm2) for the detection of prostate cancer in both 1.5T and 3T MR systems (789). These studies have reported that, on DWIs obtained with high b-values, the background tissue signal is more suppressed and the contrast between the signals of cancerous and non-cancerous lesions is more enhanced as compared with DWIs obtained with 1000 s/mm2. However, even though images obtained with large b-values are clinically preferable, they are more difficult to obtain practically and consistantly because of certain disadvantages such as poor SNR and possible eddy current distortions due to the large diffusion sensitizing gradients used (10). Computed DWI can create high b-value images from lower b-value data, which is potentially less prone to artifacts, because it avoids the longer echo time required to accommodate the strong gradient pulses needed for higher b-value acquisitions.
The above stated studies proved that better image quality of computed DW images translated into improved diagnostic performance (1317). A previous study demonstrated specificities and accuracies for tumor detection of computed and acquired DWI at a b-value of 2000 s/mm2 which were significantly higher than those of acquired DWI at a b-value of 1000 s/mm2. The specificity and accuracy, respectively, were as follows: 70.0% and 76.6% for computed b = 2000 DWI, 66.5% and 75.5% for acquired b = 2000 DWI, and 62.0% and 72.5% for acquired b = 1000 DWI (17). Rosenkrantz et al. (13) also showed that the sensitivity and positive predictive value, for the tumor detection of computed DWI at b-value of 1500 s/mm2 (67.4% and 78.6%, respectively), were significantly better than those of acquired DWI at b-value of 1000 s/mm2 (46.9% and 60.5%, respectively). In both studies using 3T scanner, the diagnostic capability for prostate cancer of computed DWIs with high b-value over 1500 s/mm2 was comparable to that of directly acquired DWIs with the same b-value. Yoshida et al. (18) demonstrated similar results with 1.5T scanner: their computed b = 2000 s/mm2 DWI showed diagnostic capability equivalent to that of acquired b = 2000 s/mm2 DWI for prostate cancer detection (accuracy: 86% for computed b = 2000 s/mm2 DWI, and 86% for acquired b = 2000 s/mm2 DWI). Thus, computed DWI could be considered as a substitute of the acquired DWI in clinical practice.
The above mentioned studies evaluated computed DWI without an ADC map for prostate cancer detection, because the main purpose of these studies was to compare the diagnostic ability of acquired DWIs with that of computed DWIs. In contrast, past studies on the role of DWI for prostate cancer localization have largely focused on the ADC map as the primary diagnostic sequence when interpreting the DWI of the prostate (1920212223). Compared with ADC maps alone, conspicuity of clinically significant cancers is sometimes improved on high b-value images, especially of those in a subcapsular location, those at the apex and base of the gland, and those adjacent to or invading the anterior fibromuscular stroma (2425). Therefore, computed DWI examinations can be considered to be a useful approach for tumor localization in prostate cancer diagnosis. Further studies using the combination of computed DWI and ADC map for prostate cancer detection might be desired in confirming the utility in clinical practice.
Appropriate Conditions for Computed DWI
Care should be taken when computing DWI by using low b-values. A previously performed study evaluated the influence of the different combinations of b-values (0, 100, 500, and 1000) on computed DWI for prostate cancer detection at b = 2000 s/mm2 (26). They concluded that the combination of b-values of 0 s/mm2 and 500 s/mm2 were not suitable to generate computed DWI at b-value of 2000 s/mm2 for prostate cancer detection because that combination had poor image quality and inter-reader agreement. The combinations of b ≥ 100 s/mm2 and b ≥ 500 s/mm2 as well as b = 0 s/mm2 and b = 1000 s/mm2 were optimal in their study. This could be explained by the observation that signals of both cancerous lesions and normal prostate parenchyma were weakened and embedded in the background signal at such low b-values. It is known that the initial decrease in signal intensities at low b-values is steeper than the more gradual attenuation of signals at higher b-values (27). ADCs calculated from low b-values are prone to be larger, thus, computed signal based on a mono-exponential model would be lower. Ogura et al. (28) investigated the optimal b-values required for the generation of computed high b-value images of the brain; they found that computed DW images with a high b-value, derived from two low b-value DW images in the fast component, would not be identical to the acquired images with the same high b-value in the slow component. In addition, they reported that an improved SNR should not be expected from computed images generated from b-value images in the slow component because the calculated ADC is prone to be smaller. Hence, to compute useful DWI for prostate cancer detection, radiologists should consider the combination of b-values. For calculation of DWI at b-value of 1500–2000 s/mm2, the combination of b-value of 0–100 s/mm2 and 500–1000 s/mm2 is considered to be optimal.
Rosenkrantz et al. (29) assessed prostate cancer detectability using a broad range of computed b-values from 1000 s/mm2 to 5000 s/mm2 generated from 50 s/mm2 and 1000 s/mm2. They concluded that computed b-values in the range of 1500–2500 s/mm2 (but not higher) were optimal for prostate cancer detection; b-values of 1000 s/mm2 or 3000–5000 s/mm2 exhibited an overall lower performance. This could be because the high b-values over 3000 s/mm2 had excessive loss of signal within the prostate and surrounding tissues, leading to diminished anatomic clarity and diminished visualization of normal landmarks such as the prostate capsule. This may have caused difficulty in tumor localization and led to the low detectability of prostate cancer.
The computed DWI method used in the previously mentioned studies was based on calculating ADC with a mono-exponential model. The mono-exponential model is simpler to perform, and evidence indicates that it performs as well or almost as well as the bi-exponential model for computed DWI (30). The study performed by Verma et al. (31) showed that high b-value (2000 s/mm2) computed DWI using mono-exponential model, intra-voxel incoherent motion model, and stretched exponential diffusion model provided better image quality and lesion conspicuity, and increased lesion-to-background contrast ratios, as compared with acquired DWI. However, there were no significant differences in the detectability of prostate cancer among the computed DWIs and acquired DWI.
Further Perspectives of Computed DWI
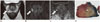
Computed DWI technique may be applied to various clinical settings and may play a more important part in the assessment of prostate cancer. Recently, high-spatial-resolution DWI in cancer imaging has been reported as a potential improvement for better detection of small or sparse cancers (323334). However, higher spatial-resolution can cause loss of signal intensities and may need a longer examination time to achieve a satisfactory image quality. We applied the computed DWI technique to high-spatial-resolution DWI to cover the signal diminishment and suggested that computed DWI was a useful addition to routine MR examination to improve the diagnostic capability of prostate cancer (35) (Fig. 4).
Tumor ADC has been considered to be useful for the assessment of tumor aggressiveness (36). Since computed DWI is generated from ADC values of different b-values, it cannot provide the additional ADC values/ADC maps. Recently, Waseda et al. (37) defined the b-value at which the signal intensities of the prostate cancer and nonmalignant prostatic tissue were equal as the “iso-b-value”. They reported that computed DWI with iso-b-value-based semi-quantitative analysis was found to be useful in predicting the aggressiveness of prostate cancer and may potentially outperform tumor ADC measurements. In future, computed DWI technique may be used to develop a new biomarker of prostate cancer.
CONCLUSION
Computed DWI technique could offer high b-value DW images with good image quality regardless of the MR system's configuration. This technique may play a more important role in evaluating prostate cancer in the future. However, radiologists should also be aware that the computed DW images are highly influenced by the original ADC.
 XML Download