

 PDF
PDF ePub
ePub Citation
 Print
Print


INTRODUCTION
Adhesive capsulitis of the shoulder, also known as “frozen shoulder,” is a common condition that occurs mainly in women between 40 and 60 years old. It appears as chronic inflammation and fibrosis of the joint capsule on arthroscopy and is a frequent cause of pain and limited motion of the glenohumeral joint (12). Although frozen shoulder is diagnosed clinically based on clinical history and physical examination, imaging studies are sometimes performed to differentiate it from other pathologies or to reveal coincident lesions (3). Previous studies have described several specific magnetic resonance imaging (MRI) or MR arthrography (MRA) findings of frozen shoulder, such as capsular thickening, synovitis, and coracohumeral ligament thickening (45678).
Adhesive capsulitis can also affect the hip joint and was first reported in 1963 (9). Similar to frozen shoulder, adhesive capsulitis of the hip (ACH) causes hip pain and limited motion and is accompanied by synovial hyperplasia and capsular fibrosis (10). However, only a few case reports have been published on ACH, and these were limited to arthrographic findings without distinction of primary or secondary forms (11121314). Recent studies have presented MRI or MRA findings in patients with ACH, which are not necessarily helpful in evaluating ACH specifically (1516). Moreover, to the best of our knowledge, no original research has been conducted thus far on computed tomography (CT) arthrography (CTA) in patients with idiopathic (primary) ACH.
Therefore, based on the assumption that patients with ACH may have similar diminished joint cavities and thickened joint capsules to those in patients with adhesive capsulitis of the shoulder, we compared CTA imaging findings of an ACH group and a control group to identify useful findings for diagnosing idiopathic ACH.
MATERIALS AND METHODS
This retrospective study was approved by the Institutional Review Board of our hospital, and the requirement for informed consent was waived.
Patients and Control Group
For the patient group, the inclusion criteria were as follows: 1) hip pain with limited motion on physical examination (internal rotation < 30° or external rotation < 50° at 90° knee flexion with positive flexion, abduction, and external rotation test results) (16); 2) no history of major trauma or surgery of the hip joint; 3) no evidence of hip osteoarthritis on plain radiographs; 4) having undergone preoperative CTA; and 5) no possible precursor of secondary ACH such as synovial osteochondromatosis. Patients who met criteria 1) to 5) were enrolled in the study. The exclusion criterion was poor image quality, which could have made image analysis inappropriate. From October 2009 to March 2017, a total of 28 consecutive patients with 29 hips were clinically diagnosed with idiopathic ACH by a hip surgeon in our hospital, excluding 3 cases with secondary ACH caused by synovial osteochondromatosis; 9 patients also underwent arthroscopic surgery after CTA. The patient group comprised 7 males and 21 females with 15 right and 14 left hips (including one female with bilateral ACH), and the mean age was 45.7 years (range, 17–67 years; standard deviation [SD], 10.8 years).
For the control group, we identified 116 hip CTA studies performed from 2014 to 2016 using a commercially available picture archiving and communication system (Maroview, version 5.4, Infinitt, Seoul, Korea). The inclusion criteria were as follows: 1) no clinical features indicative of ACH including limited motion of the hip; 2) no history of major trauma or surgery on the hip joint; 3) no inflammatory arthritis of the hip joint such as rheumatic disorder; and 4) no evidence of hip osteoarthritis on plain radiographs. After 14 studies indicative of ACH were excluded, we obtained 102 hip CTA studies, from which we manually selected 29 age- and sex-matched control hips that satisfied all 4 inclusion criteria based on electronic medical records. The control group comprised 7 males and 22 females with CTA records of 20 right and 9 left hips (mean age, 45.8 years; range, 18–66 years; SD, 10.6 years). The causes of CTA in the control group were 1) suspected femoroacetabular impingement (n = 18) or 2) suspected labral tear (n = 11).
Arthroscopic Evaluation
All arthroscopic hip operations were performed by a single arthroscopic orthopedic surgeon with 20 years of experience in orthopedic surgery. Of the 29 control patients, 20 underwent hip arthroscopy after CTA (8 labral tears, 8 femoroacetabular impingements, and 4 subspinal impingements). The mean interval between CTA and hip arthroscopy in the control group was 58 days (range, 17–124 days; SD, 43.2 days).
In 28 patients, 9 patients underwent arthroscopic operations because of suspected labral tear in 5 patients based on CTA and sustained hip pain in spite of conservative management in 4 patients despite no abnormal findings on CTA. The arthroscopic criteria for the presence of ACH were as follows: 1) vascular synovitis; 2) capsular contracture; 3) hemorrhage in the hip joint during portal placement; and 4) difficulty penetrating the joint capsule with the arthroscopic cannula and obturator. ACH was arthroscopically confirmed if at least 2 of these findings were met, including vascular synovitis (1718). Similar to frozen shoulder, we identified 4 stages of ACH in the 9 patients based on clinical, arthroscopic, and pathologic features: stage 1, only fibrinous synovial inflammation (n = 4); stage 2, “christmas tree” synovitis (n = 3); stage 3, complete loss of joint recess (n = 2); and stage 4, non-visualization of intra-articular structures on arthroscopy (n = 0) (192021). The mean interval between CTA and hip arthroscopy in the ACH group was 69 days (range, 11–191 days; SD, 56.3 days).
Hip CTA
Before CT scanning, hip arthrography was performed by inserting a 21-gauge spinal needle into the hip joint via an anterior approach under ultrasound guidance with a standardized aseptic technique. Approximately 6–12 mL of a mixture containing 10 mL of iohexol (Omnipaque 300; GE Healthcare, Shanghai, China), 0.5 mL of 2% lidocaine, and 5 mL of normal saline was injected gently into the hip joint until resistance was felt.
After arthrography, CT scans were obtained using a 64-slice multidetector CT (MDCT) scanner (Optima CT660; GE Healthcare, Milwaukee, WI, USA) or a 256-slice MDCT scanner (Brilliance iCT 256; Philips Healthcare, Cleveland, OH, USA) with the following standard acquisition protocols: 64-slice MDCT: pitch, 0.984; current, 180 mAs; voltage, 120 kVp; collimation, 64 × 0.625 mm; field of view at acquisition, 180 mm; slice thickness, 0.625 mm without section overlapping; and matrix size, 512 × 512; 256-channel MDCT: pitch, 0.297; current, 150 mAs; voltage, 120 kVp; collimation, 64 × 0.625 mm; field of view at acquisition, 180 mm; slice thickness, 0.625 mm without section overlapping; and matrix size, 512 × 512. Patients were placed in a supine position with the legs in slight internal rotation, providing for internal rotation of the hip (approximately 10–15°). Coronal, sagittal, and oblique axial images (parallel to the femoral neck axis) were routinely reconstructed using an Extended Brilliance Workspace V4.5.2.4031 (Philips Healthcare, Best, The Netherlands) after axial scanning.
Imaging Analysis
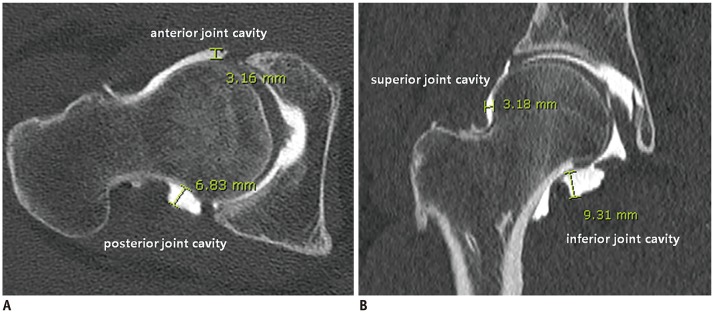
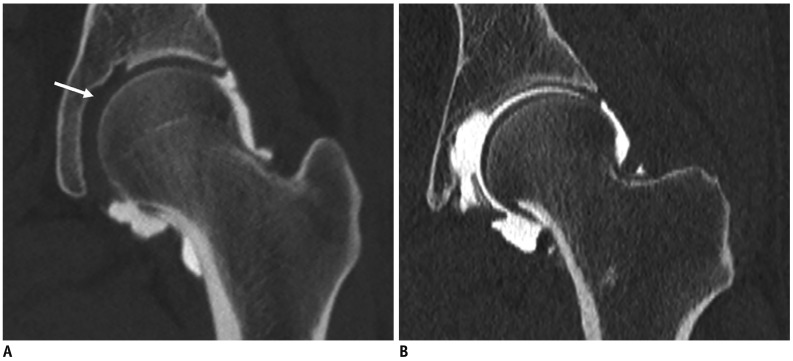
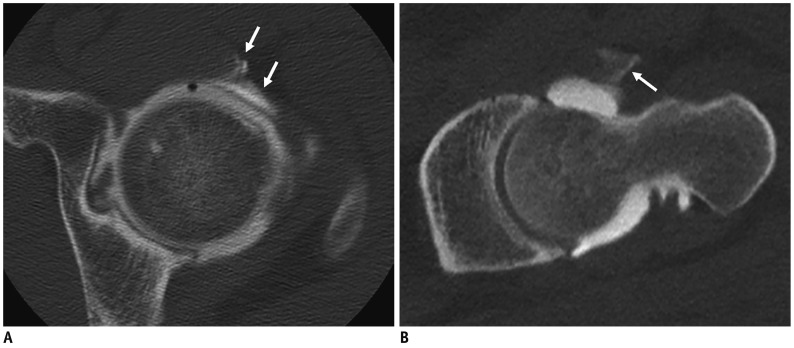
Two experienced musculoskeletal radiologists (Radiologists 1 and 2, with 7 and 9 years of experience in musculoskeletal radiology, respectively) evaluated all CTA studies independently with respect to the following factors: 1) hip joint cavity on the anterior, posterior, superior, and inferior sides; 2) distensibility of the hip joint; 3) lack of contrast filling around the ligamentum teres; and 4) presence of extracapsular contrast leakage. On the oblique axial image of the mid-portion of the femoral neck, the anterior or posterior joint cavity was measured as the widest distance from the cortex of the femoral head to the anterior or posterior joint capsule (Fig. 1A). On the coronal image of the mid-portion of the femoral neck, the superior or inferior joint cavity was measured as the widest distance from the cortex of the femoral head to the acetabulum or inferior joint capsule (Fig. 1B). Regarding joint distensibility, the anterior-posterior (AP) filling ratio was calculated as the widest distance of the anterior joint cavity to the widest distance of the posterior joint cavity, and the superior-inferior (SI) filling ratio was calculated as the widest distance of the superior joint cavity to the widest distance of the inferior joint cavity. We evaluated contrast filling around the ligamentum teres (Fig. 2) and extracapsular contrast leakage (Fig. 3). Before the image analysis, the 2 radiologists held a consensus meeting. Both radiologists were blinded to the clinical information, radiologic reports, and arthroscopic findings, as well as to each other's image analysis results. Both radiologists performed secondary image analyses 1 month after the first analyses.
Statistical Analysis
We compared the ACH and control groups in terms of the distances of the joint cavity at the anterior, posterior, superior, and inferior sides as well as the AP filling ratio and SI filling ratio by using the Mann-Whitney U test according to arthroscopic staging using an analysis of variance. In addition, the cut-off value was estimated for the diagnosis of ACH by using the receiver operating characteristic (ROC) curve. We examined the presence of contrast filling around the ligamentum teres and extracapsular contrast leakage by using Fisher's exact test. We established intra- and inter-observer agreement by using the intraclass correlation coefficient (ICC) for the distance of the joint cavity and kappa values for contrast filling around the ligamentum teres and extracapsular contrast leakage. We categorized the ICC and kappa values as slight (0–0.20), fair (0.21–0.40), moderate (0.41–0.60), substantial (0.61–0.80), or almost perfect (0.81–1.00). We performed all statistical analyses using Predictive Analytics SoftWare version 19.0 (IBM Corp., Armonk, NY, USA) and considered a p value of less than 0.05 to indicate a statistically significant difference.
RESULTS
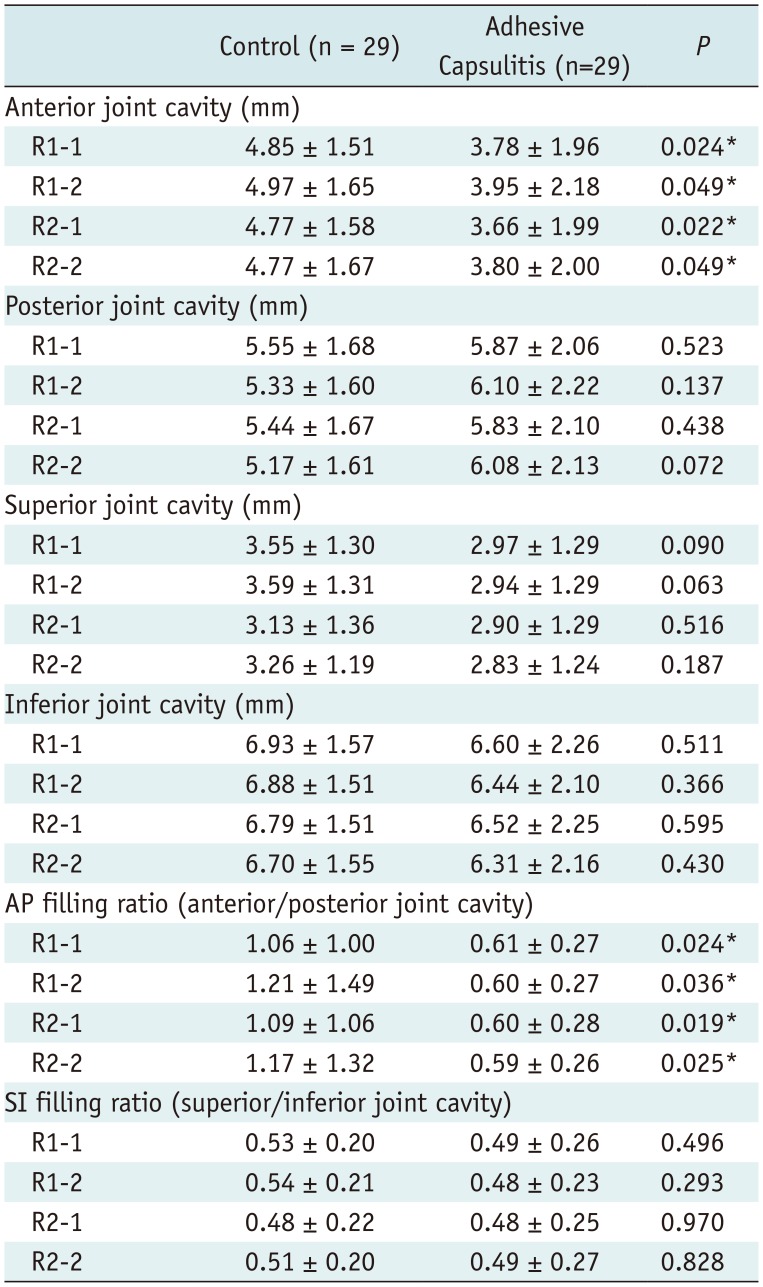
The mean distance of the anterior hip joint cavity was significantly more obliterated in the ACH group (3.8 mm and 4.0 mm according to Radiologist 1; 3.7 mm and 3.8 mm according to Radiologist 2) than in the control group (4.9 mm and 5.0 mm according to Radiologist 1; 4.8 mm according to Radiologist 2) (p = 0.024 and 0.049 according to Radiologist 1; 0.022 and 0.049 according to Radiologist 2, respectively). The mean distances of the superior and inferior hip joint cavity were also lower in the ACH group than in the control group, but the difference was nonsignificant. The mean distance of the posterior joint cavity was slightly wider in the ACH group than in the control group (Table 1). The mean AP filling ratio was significantly more diminished in the ACH group (0.61 and 0.60 according to Radiologist 1; 0.60 and 0.59 according to Radiologist 2) than in the control group (1.06 and 1.21 according to Radiologist 1; 1.09 and 1.17 according to Radiologist 2; p < 0.05) (Table 1). However, the SI filling ratio did not differ between the ACH and control groups. Intra- and inter-observer agreement was almost perfect for the joint cavity distance measurements (ICC: 0.846–0.958 for intra- and 0.935–0.992 for inter-observer agreement).
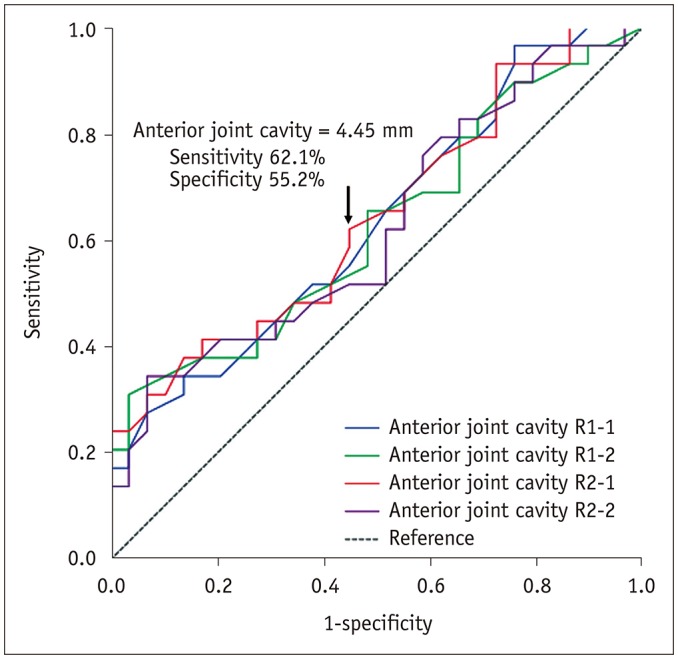
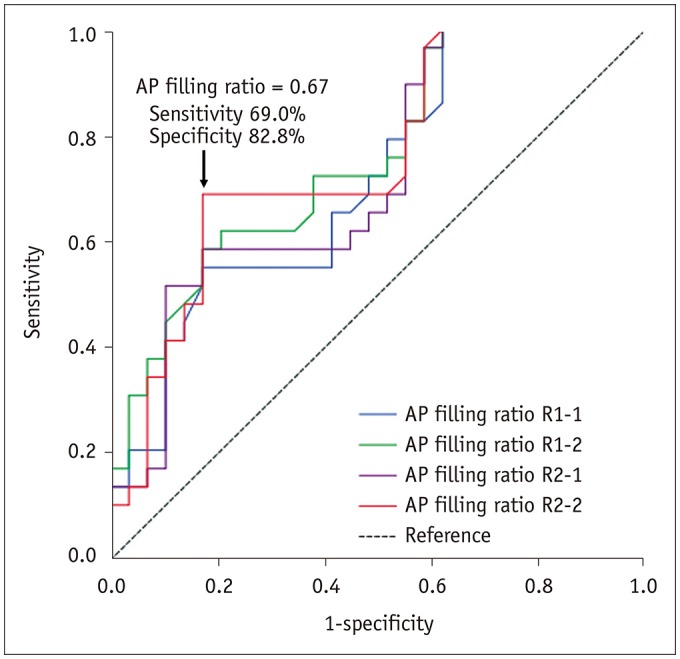
The ROC curves of the distance of the anterior hip joint cavity and the AP filling ratio revealed that the cut-off value of the distance of the anterior joint cavity was 4.45 mm (sensitivity, 62.1%; specificity, 55.2%; and area under the curve, 0.643) and that of the AP filling ratio was 0.67 (sensitivity, 69.0%; specificity, 82.8%; and area under the curve, 0.755) (Figs. 4, 5).
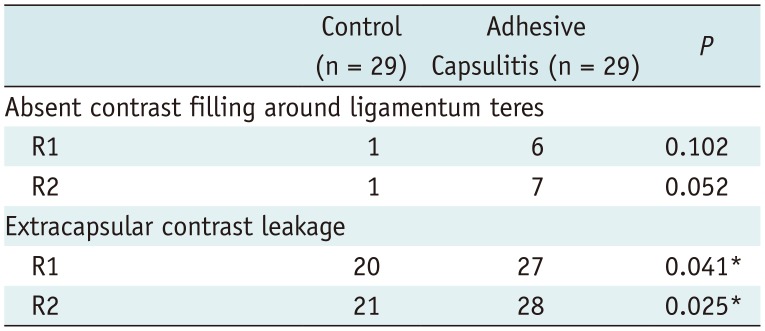
Extracapsular contrast leakage was significantly more common in the ACH group (27–28 patients) than in the control group (20–21 cases; p < 0.05). Contrast was not filled around the ligamentum teres more frequently in the ACH than in the control group (Table 2). Inter-observer agreement was substantial for contrast filling around the ligamentum teres (k = 0.76) and almost perfect for extracapsular contrast leakage (k = 0.879).
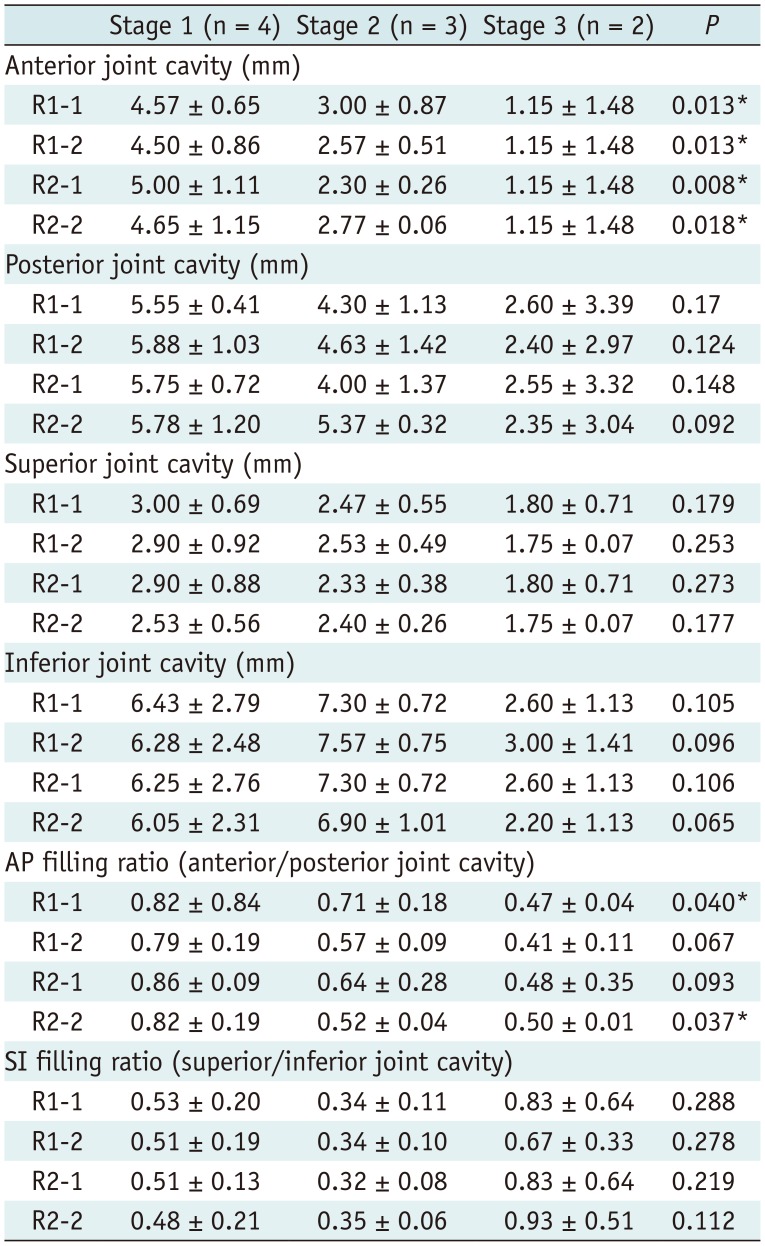
The anterior joint cavity and AP filling ratio values differed significantly according to the arthroscopic staging (Table 3), and were markedly decreased in stage 3 (mean anterior joint cavity: 1.15 mm in stage 3 vs. 4.68 mm in stage 1, p < 0.05). The contrast filling around the ligamentum teres (p = 0.140 and 0.413) and extracapsular contrast leakage (p, not checkable) did not differ according to the arthroscopic staging.
DISCUSSION
ACH is believed to be a chronic synovial inflammation that leads to capsular fibrosis, similar to adhesive capsulitis of the shoulder. Few case reports or series have been reported thus far, and its incidence and natural clinical course have not yet been documented (10). With respect to imaging findings, only arthrographic findings have been noted: low volume of contrast filling during hip arthrography, tight joint capsule, and contrast filling defects correlated with intra-articular loose bodies in cases of synovial osteochondromatosis (111213). One case series investigated MRI and MRA findings of ACH, which did not reflect ACH itself (16). Similar to frozen shoulder, ACH may be primary or secondary to previous major trauma, surgery, osteoarthritis, or synovial osteochondromatosis (11), and these underlying conditions should be diagnosed and treated first. However, previous studies could not assess idiopathic ACH, likely because its incidence is much lower than that of frozen shoulder.
Frozen shoulder is accompanied by capsular thickening, decreased joint cavity distance or volume, and extra-articular contrast leakage, and similar findings may be expected in ACH on CTA (47822). Although no study has used CTA to evaluate frozen shoulder, we considered that the joint cavity could be filled sufficiently with contrast agent during arthrography and that frozen shoulder could be measured using CTA.
In our results, the mean distances on the anterior, superior, and inferior sides of the joint cavity were lower in the ACH group than in the control group, with a significant difference at the anterior joint cavity. This suggests that the hip joint cavity is obliterated diffusely in ACH by thick synovitis and capsular contracture. In addition, both the SI and particularly the AP filling ratios were lower in the ACH group than in the control group (Table 1). These results were similar to those of a study on adhesive capsulitis of the shoulder (7). The mean distance of the posterior joint cavity was only slightly obliterated in the ACH group and its distance was longer in the ACH group than in the control group. This finding may contradict the data on adhesive capsulitis of the shoulder (47). We hypothesized that the range of hip joint motion may need a wider posterior joint cavity to compensate for the relatively diminished joint cavity in ACH because the hip joint typically has a smaller capacity than the shoulder. Furthermore, the joint cavity on other sides might be affected earlier and more prominently than on the posterior side.
Extracapsular contrast leakage was more common in the ACH group than in the control group. This result may be related to the amount of injected contrast agent, which could not be assessed in our study. The volume of contrast leakage has been reported to be greater in adhesive capsulitis of the shoulder (22), but comparison with our results might be difficult.
Contrast filling around the ligamentum teres was absent more frequently in the ACH group than in the control group, but the difference was nonsignificant. This could mean that excessive synovial hyperplasia around the ligamentum teres prevents contrast filling between the medial femoral head and the acetabulum in ACH, which may explain why in previous studies the contrast agent was not seen on the medial side of the femoral head in ACH associated with synovial osteochondromatosis (11). Alternatively, excessive capsular thickening or contracture may prevent contrast filling around the ligamentum teres from the injection site, which is typically located more laterally.
Our results revealed that the anterior joint cavity of the hip may be more obliterated in higher stages of ACH with a more heavily decreased AP filling ratio. Our results may indicate that the joint cavity, and particularly the anterior joint space, is proportionally affected as ACH progresses. However, neither the anterior joint cavity nor the AP filling ratio of stage 1 ACH differed significantly from those of the control group despite their cut-off values being applied. This might suggest that the early stage of ACH may be difficult to diagnose using only CTA findings and that clinical examination is more critical for its diagnosis.
Frozen shoulder commonly occurs in patients with comorbidities such as hormonal, cardiac, and neurologic disorders or with a history of minor trauma (2); in particular, its association with diabetes mellitus is well known. However, no such association has been demonstrated in ACH in previous studies. Our study included only one patient with diabetes mellitus, one patient with hypertension, and one patient with minor trauma; hence, statistical analysis could not show a relationship between ACH and these possible risk factors. Thus, further studies with larger populations may be needed in the future.
This retrospective study has several limitations. First, we evaluated hips using CTA, without MRI or MRA, and thus, we could not measure the capsular thickness of the hip joint. Additionally, the CT scan posed a potential radiation risk. Only 3 ACH patients underwent MRI in our study, which revealed that the anterior joint capsule had thickened (6.10–6.28 mm). However, the normal range of capsular thickness of the hip joint has not yet been documented, and only one previous study has reported MRI findings of joint effusion or labral tear rather than thickened joint capsule (16). Our hip surgeon initially suspected morphologic hip disorders such as labral tear or femoroacetabular impingement and preferred CTA because of its low cost, even if the patient had a symptom compatible with ACH. The capsular inner surface can be evaluated using CTA, but could not be evaluated in our study. Second, we could not check the amount or volume of injected contrast agent and therefore could not analyze the relationship between the amount of injected contrast agent and the CTA findings in the ACH group or compare the relationship with that in the control group. Third, only 9 ACH patients underwent arthroscopic operations and had their ACH stage documented. However, ACH is typically managed using conservative treatment rather than surgery, and the ACH patients in this study who did not undergo a hip operation received conservative management such as oral medication or exercise, and they recovered from their symptoms and discomfort. Fourth, our results presented the cut-off values of the anterior joint cavity and AP filling ratio; however, their diagnostic performance might be unsatisfactory. Similar to frozen shoulder, ACH is diagnosed clinically and imaging may be helpful primarily to rule out other hip diseases (23).
In conclusion, on CTA, the anterior joint cavity may be diminished more markedly and earlier than on other sides and may be accompanied by extracapsular contrast leakage in ACH. These CTA findings may be helpful in the diagnosis of ACH.
 XML Download