Journal List > Korean J Radiol > v.20(1) > 1110396

Choi and Moon: Gadolinium Deposition in the Brain: Current Updates

Abstract

Gadolinium-based contrast agents (GBCAs) are commonly used for enhancement in MR imaging and have long been considered safe when administered at recommended doses. However, since the report that nephrogenic systemic fibrosis is linked to the use of GBCAs in subjects with severe renal diseases, accumulating evidence has suggested that GBCAs are not cleared entirely from our bodies; some GBCAs are deposited in our tissues, including the brain. GBCA deposition in the brain is mostly linked to the specific chelate structure of the GBCA: linear GBCAs were responsible for brain deposition in almost all reported studies. This review aimed to summarize the current knowledge about GBCA brain deposition and discuss its clinical implications.

INTRODUCTION

Since 1988, when gadolinium-based contrast agents (GBCAs) were approved by the Food and Drug Administration (FDA), GBCAs have been considered extremely safe (1). Life-threatening adverse reactions, which usually occur immediately or within 24 hours of GBCA administration, occur at a very low rate of 0.001–0.01% (234). Potentially lethal nephrogenic systemic fibrosis (NSF) due to GBCAs was first described in patients with renal failure in 2006 (56). Subsequent research has proved that certain linear GBCAs-gadodiamide (Omniscan; GE Healthcare AS, Oslo, Norway), gadoversetamide (OptiMARK; Guerbet, Raleigh, NC, USA), and gadopentetate dimeglumine (Magnevist; Bayer AG, Berlin, Germany), which have relatively unstable structures and easily release free gadolinium (Gd3+)-are associated with the occurrence of NSF in the presence of renal failure (789). Accordingly, it is recommended to use more stable GBCAs and limit repeated exposure to GBCAs in patients with renal failure, but there are no specific limitations to using GBCAs in subjects with normal kidney functions (10).
Almost 8 years after the first report of NSF, incidental GBCA deposition in the brain was first reported by Kanda et al. in 2014 (11). Subsequent reports have confirmed the association of the repeated administration of GBCAs and high T1 signal intensity in the dentate nucleus and globus pallidus (1112131415161718192021222324252627282930). Despite the increasing evidence of GBCA accumulation in the brain, there is no strong clinical evidence for the harmful effects of GBCAs on the brain. The underlying pathomechanisms of GBCA accumulation in the brain are not clearly known yet. Nevertheless, regulatory actions on GBCAs have been changed recently. The U.S. FDA decided not to restrict the use of any of the GBCAs-including certain GBCAs that are associated with a higher retention of gadolinium in the brain-based on a lack of evidence for the harmful effects of retained gadolinium on the brain (31). However, the European Medicines Agency's the Pharmacovigilance and Risk Assessment Committee has recommended the suspension of marketing authorizations for four linear gadolinium contrast agents-gadobenate dimeglumine (MultiHance; Bracco Imaging S.p.A., Milan, Italy), gadodiamide, gadopentetate dimeglumine, and gadoversetamide-based on the evidence of their accumulation in the brain (3233). The Japanese Pharmaceuticals and Medical Devices Agency has requested specific changes to the labeling regarding precautions about gadolinium retention in the brain in the packages of all GBCAs (34). In line with this, the Ministry of Food and Drug Safety in Korea has requested a mandatory revision of the precaution section in the package insert of GBCAs to state that more gadolinium remains in the brain with the use of linear GBCAs than with the use of macrocyclic GBCAs. Therefore, linear GBCAs should be administered when macrocyclic GBCAs are not appropriate, such as for patients with previous allergic reactions to macrocyclic GBCAs or when other alternatives for liver-specific agents (e.g., gadoxetic acid disodium: Primovist; Bayer AG) are not available (3536).
Despite this series of actions by healthcare policymakers, public concerns continue to increase, and a certain group of researchers has even proposed a new disease category linked to GBCA deposition in the brain (37). Thus, radiologists and clinicians are feeling pressured to understand the significance of GBCA accumulation in the brain as the recent evidence suggests. They also have to educate their potential patients without provoking groundless fears about GBCAs, as well as change their practice according to the evidence and recommendations to avoid certain types of GBCAs. In this review article, we summarize the current knowledge on GBCA deposition in the brain with respect to the types of GBCAs, deposition sites, deposition mechanisms, and clinical implications.

What Exactly are GBCAs? Types and Characteristics

Gadolinium is a rare earth heavy metal in the lanthanide series, with an atomic number of 64. The 7 unpaired electrons in its 4f subshell enable gadolinium to induce a strong paramagnetic effect, which accounts for its use for contrast enhancement in MRI. Free gadolinium, Gd3+, is toxic to humans; therefore, GBCAs are administered to humans in the chelated forms with various ligands to avoid the toxic effects of free gadolinium on the human body (38). The gadolinium in GBCAs must remain in the chelated form until their excretion by the kidneys. However, dechelation of free gadolinium from the GBCA complex appears to occur in vivo and is determined by various factors, such as the chemical stability of the GBCAs, pH, temperature, and competition between GBCAs and ions or ligands (39).
The chemical stability related to the dechelation of free gadolinium from the GBCA complex is determined by both kinetic stability (which is also called kinetic inertness) and thermodynamic stability (40). Kinetic stability refers to how slow the rates of formation and dissociation of the GBCA complex are. The kinetic stability of GBCA is considered much more important than its thermodynamic stability in maintaining the in vivo stability (40). If the kinetic stability is low, free gadolinium is rapidly released from the GBCA complex. The thermodynamic stability determines the concentration of free gadolinium, free chelate, and the GBCA complex at equilibrium. The thermodynamic stability at the physiologic pH of 7.4 is termed conditional stability (39). In addition, the dechelation of free gadolinium from the GBCA complex is also influenced by the potent acceptors of gadolinium, such as inorganic ions (phosphate, carbonate, hydroxide), and the potential alternatives for free gadolinium, such as endogenous metals (Fe3+, Mg2+, Cu2+, Zn2+, and Ca2+) (394142).
Gadolinium-based contrast agents can be classified according to their chemical structures, electrical charges, stability, and biodistribution in the body, which depend on the type of chelating ligands (4043). Based on the structures of the chelating ligands, GBCAs can be divided into two categories: linear and macrocyclic. In macrocyclic molecules, free gadolinium is completely isolated within the preformed cage of the ligands, whereas in linear molecules, free gadolinium is wrapped around with elongated ligands. According to their charges, GBCAs can be subclassified into ionic or non-ionic agents. It is generally accepted that macrocyclic agents are more stable than linear agents due to the former's cage-like structures; furthermore, ionic agents are more stable than non-ionic agents because the electrostatic interactions between the acidic gadolinium and the basic donor groups of the chelates are stronger in ionic agents (4344).
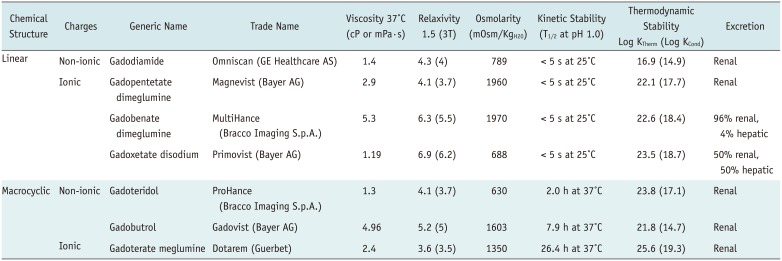
Most GBCAs are nonspecific extracellular contrast agents. When injected via a vein, a GBCA will rapidly disperse into the extracellular space without crossing the intact cell membranes or biological barriers, such as the blood-brain barrier (BBB); finally, the GBCA is excreted through the kidneys. Gadobenate dimeglumine (MultiHance) and gadoxetic acid disodium (Primovist) are well-known combined extracellular-intracellular agents. These agents are in part transported into the hepatocytes by specific mechanisms and excreted into the bile, thus exhibiting dual elimination (bile and urine). Gadoforsteset trisodium (Vasovist; Lantheus Medical Imaging, North Billerica, MA, USA) is an intravascular blood pool agent only. After an intravenous injection, it binds reversibly to serum albumin, making large molecular complexes that restrict passive distribution into the interstitial space. Seven GBCAs are commercially available and widely used in Korea and throughout the world. Their brand names and general chemical characteristics are listed in Table 1.

How did We Realize It? A Short History on Gadolinium Deposition in the Brain

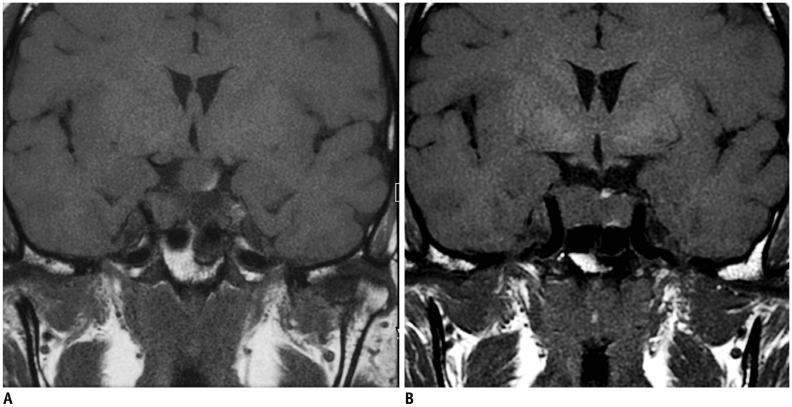
High signal intensities in the globus pallidus and dentate nucleus on non-enhanced T1-weighted images (T1WI) can be observed in many clinical conditions. T1 hyperintensities have been observed in the dentate nucleus in patients with calcification, history of brain irradiation, Langerhans cell histiocytosis, and multiple sclerosis (454647). T1 hyperintensities in the globus pallidus have been associated with hepatic dysfunction, Wilson disease, total parental nutrition, neurofibromatosis type 1, manganese toxicity, Rendu-Osler-Weber disease, hemodialysis, and other medical conditions that can cause calcification in the globus pallidus (484950). In 2014, Kanda et al. (11) reported for the first time T1 hyperintensities in the globus pallidus and dentate nucleus on non-enhanced T1WI in patients with multiple exposures to GBCAs (Fig. 1). Currently, based on numerous published articles (Table 2), gadolinium deposition is one of differential diagnoses of T1 hyperintensities in the globus pallidus and dentate nucleus.
Early reports on gadolinium deposition in the brain mainly focused on signal changes in the dentate nucleus and globus pallidus on MRI (11121314151617181920222324515253). However, the T1 hyperintensities are not limited to these two structures but appear to involve other areas of the brain, including the pulvinar of the thalamus, the precentral and postcentral cortex, the calcarine cortex (54), and the whole cerebral cortex (28). In a study of 13 patients with > 35 administrations of linear GBCAs, T1 hyperintensities were observed not only in the dentate nucleus (100%) and globus pallidus (100%) but also in the substantia nigra (100%), posterior thalamus (92%), red nucleus (77%), colliculi (77%), superior cerebellar peduncle (54%), caudate nucleus (31%), whole thalamus (23%), and putamen (15%) (30).
McDonald et al. (55) confirmed the causal relationship between T1 hyperintensities and gadolinium exposure by demonstrating that T1 hyperintensity is positively correlated with the concentration of gadolinium in the brain tissue, measured by inductively coupled plasma mass spectrometry (ICP-MS) in a cadaveric study. Gadolinium deposition was observed in the pons and thalamus in addition to the observations in the globus pallidus and dentate nucleus (5556). Kanda et al. (57) also found gadolinium deposition in the cerebellar white matter, frontal lobe cortex, and frontal white matter in an autopsy study involving subjects without severe renal dysfunction. These autopsy studies have demonstrated that gadolinium deposition can occur anywhere in the brain tissue, not only in the dentate nucleus and globus pallidus, and that MRI has a limited sensitivity to detect low levels of gadolinium deposition in the brain.

How does GBCA Deposit in the Brain? Histologic Evidence and Suggested Mechanisms

Although imaging evidence of GBCA in the brain is clear, histological and electromicroscopic observations are not straightforward. According to preclinical studies and the few available human autopsy studies, no histological changes have been detected in hematoxylin and eosin-stained sections of the dentate nucleus and globus pallidus from rats and patients administered gadodiamide (linear GBCA) (555859). In a few studies, electromicroscopic examination showed gadolinium deposition in the neuronal tissue, but these studies did not specify the affected cells (5560). A recent electromicroscopic observation of the rodent brain revealed that gadolinium-positive, highly electron-dense structures could be detected only in the endothelial walls of several microvessels in the brain, but not in neurons, neutrophils, or other glial cells (58). Although further studies may be needed to explore the target cells for gadolinium deposition in the brain, these findings raise the possibility that gadolinium itself may not pass through an intact BBB.
The chemical form of deposited gadolinium in brain tissue was discovered in rodent brain studies by Gianolio et al. (61) and Frenzel et al. (62). Gianolio et al. (61) quantified the total amount of gadolinium in the rat brain, as well as the amount of intact GBCA and the insoluble gadolinium-containing form, after repeated injections of macrocyclic and linear GBCAs. The authors found that, three days after the final GBCA administration, macrocyclic GBCA administration resulted in the exclusive presence of intact GBCA in the brain. With regard to linear GBCAs, the retained gadolinium was 10 times higher than macrocyclic GBCAs and was found mostly commonly in the insoluble form, followed by soluble macromolecules and soluble intact linear GBCAs (3.6–18%). In the Frenzel et al.'s study (62), soluble intact GBCAs (either macrocyclic or linear) were slowly excreted between 3 and 24 days. Frenzel et al. (62) suggested that the soluble gadolinium-containing macromolecules (and to some extent, the insoluble fraction that can freely access water) exhibits slow tumbling rates and high relaxivity, which results in T1 hyperintensity on MRI.
Given the findings above, dechelation of free gadolinium from the intact GBCA is considered to be an initial step in the mechanism of gadolinium deposition. In this respect, transmetallation has been suggested to play a major role in gadolinium deposition. Endogenous metals (e.g., Fe3+, Mg2+, Cu2+, Zn2+, and Ca2+) attract ligands to release Gd3+ ions, which in turn are deposited in the tissue as gadolinium phosphate (406364). According to Frenzel et al. (43), the amount of free gadolinium released from linear GBCA (gadodiamide) reached around 25–29% after a 15-day incubation period at 37℃ in human serum. The authors speculated that the presence of other metal ions that compete with gadolinium for chelation could result in the transmetallation (65), which results in the dechelation of gadolinium. Compared with the administration of macrocyclic GBCAs, the administration of linear GBCAs results in a 15-times higher concentration of gadolinium in the brain (5866676869). These results suggest that GBCA with lower thermodynamic stability will facilitate easier transmetallation with endogenous metals, such as iron and zinc (647071). The gadolinium deposition area is intrinsically the iron-rich area and is specifically the area affected by neurodegenerative disorders associated with iron and manganese accumulation in the brain (357071). Gadolinium could target the ferroportin-rich areas that are involved in the active regulation of iron and manganese metabolism, resulting in metal accumulation and toxicity (64).
Another possible mechanism for gadolinium accumulation is a metal-transporter-mediated accumulation of GBCA. A high concentration of gadolinium has been reported in the dentate nucleus, globus pallidus interna, and pulvinar of the thalamus (6572), with iron or calcium also showing relatively higher concentrations in these regions (73). These findings suggest that gadolinium is not transported passively but rather by some biological mechanisms, such as metal transporters (6574). Specific metal transporters mediate the transport and the intracellular distribution of metals. Less is known about the exact mechanism. Many types of metal transporters are present at different concentrations, and each mediates and maintains the concentration gradient of the metal. Transporters are not always specific for a single metal, and they can transport chemically similar metals, such as lead and cadmium (6574).
Finally, the cerebrospinal fluid (CSF) pathway has been suggested to have a role in the mechanism of brain accumulation of gadolinium. A possible route of brain exposure to all GBCAs via the CSF has been observed in rats (75) and some humans (76), thereby bypassing the BBB.
Recent preclinical studies have also reported that the gadolinium concentration was highest in the olfactory bulb after both the linear and macrocyclic agent exposures (5868). Interestingly, the gadolinium concentration was decreased in the posterior direction in animals that were administered gadopentetate dimeglumine, whereas the gadolinium concentrations were similar in all 7 investigated regions of animals that were administered gadodiamide (58). These findings suggest that an ongoing drainage of CSF occurs from the subarachnoid space through the olfactory nerves into the nasal lymphatic system (58). Iliff et al. (77) revealed that GBCAs distribute along the glymphatic system (a so-called waste clearance system) after intracisternal injection, from the basal artery to the olfactory artery (paravascular pathway), suggesting that GBCAs enter the brain through the exchange between CSF and interstitial fluid (58). A recent study involving patients administered GBCA in the subarachnoid space showed increased signal intensity of the cortex and white matter 4 hours after GBCA administration (78). Naganawa et al. (79) demonstrated signal enhancement in the subarachnoid space and perivascular space on enhanced fluid-attenuated inversion recovery (FLAIR) 4 hours after GBCA administration. This result suggests that even in normal renal function, intravenous GBCA can be transported through the glymphatic system and reach the brain (65).

What Type of Contrast Agent Is Responsible for Gadolinium Deposition in the Brain?

Many studies have investigated the association between T1 hyperintensities in the globus pallidus and dentate nucleus and multiple administrations of linear GBCAs (1112131415161718192021222324252627282930). In retrospective human studies that included patients with multiple linear GBCAs, T1 signal changes in the dentate nucleus and/or globus pallidus were consistently associated with multiple administrations of nonspecific extracellular linear GBCAs, such as gadodiamide (11121722) and gadopentetate (1113192326). On the other hand, some studies focusing on the signal changes in patients who were repeatedly administered macrocyclic GBCAs (gadobutrol [Gadovist; Bayer AG], gadoterate meglumine [Dotarem; Guerbet, Rovi, France], and gadoteridol [ProHance; Bracco Imaging S.p.A.]), which are more stable, have found that macrocyclic GBCAs were not associated with significant signal intensity changes in the globus pallidus and dentate nucleus in the brain (5280818283). Studies comparing linear (gadopentetate) and macrocyclic (gadoteridol or gadoterate meglumine) agents have reconfirmed that the signal intensity change is significantly and exclusively related to the use of linear agents (141516208485).
All of the above-mentioned studies were retrospective human studies using MRI; therefore, the study results cannot be compared. The patient populations, the number and frequency of GBCA administrations, the cumulative amounts of GBCAs, and the methods for measuring signal changes on MRI could not be completely controlled and standardized; therefore, the results contradict other studies using gadobenate (171822), gadoxetic acid (278687), gadobutrol (5388), and gadoterate meglumine (89). Moreover, several autopsy studies measuring the deposited concentrations in brain tissue using ICP-MS revealed that gadolinium could be detected regardless of the GBCA class (5556576090).
Prospective animal studies with standardized protocols were developed to overcome the potential pitfalls of retrospective human studies. These animal studies have also demonstrated an association between exposure to linear GBCAs and gadolinium accumulation in the brain (586266676975919293). According to Robert et al. (66), all linear GBCAs (gadodiamide, gadopentetate, and gadobenate) resulted in T1 hyperintensities in the deep cerebellar nuclei of rats, whereas macrocyclic GBCAs (gadoterate meglumine) did not. Several studies using MRI demonstrated signal intensity changes in the deep cerebellar nuclei of rats that were associated with the administration of linear GBCAs (gadodiamide, gadopentetate, and gadobenate) but not macrocyclic GBCAs (gadoterate meglumine) (66677591). The animal studies using ICP-MS demonstrated that gadolinium concentrations in brain tissue were significantly higher in animals exposed to linear GBCAs (gadodiamide, gadopentetate) than in those exposed to macrocyclic GBCAs (gadobutrol, gadoteridol) (589193). However, more recent studies reported that gadolinium was detected in rats repeatedly injected with macrocyclic agents, albeit at very low levels (9194).
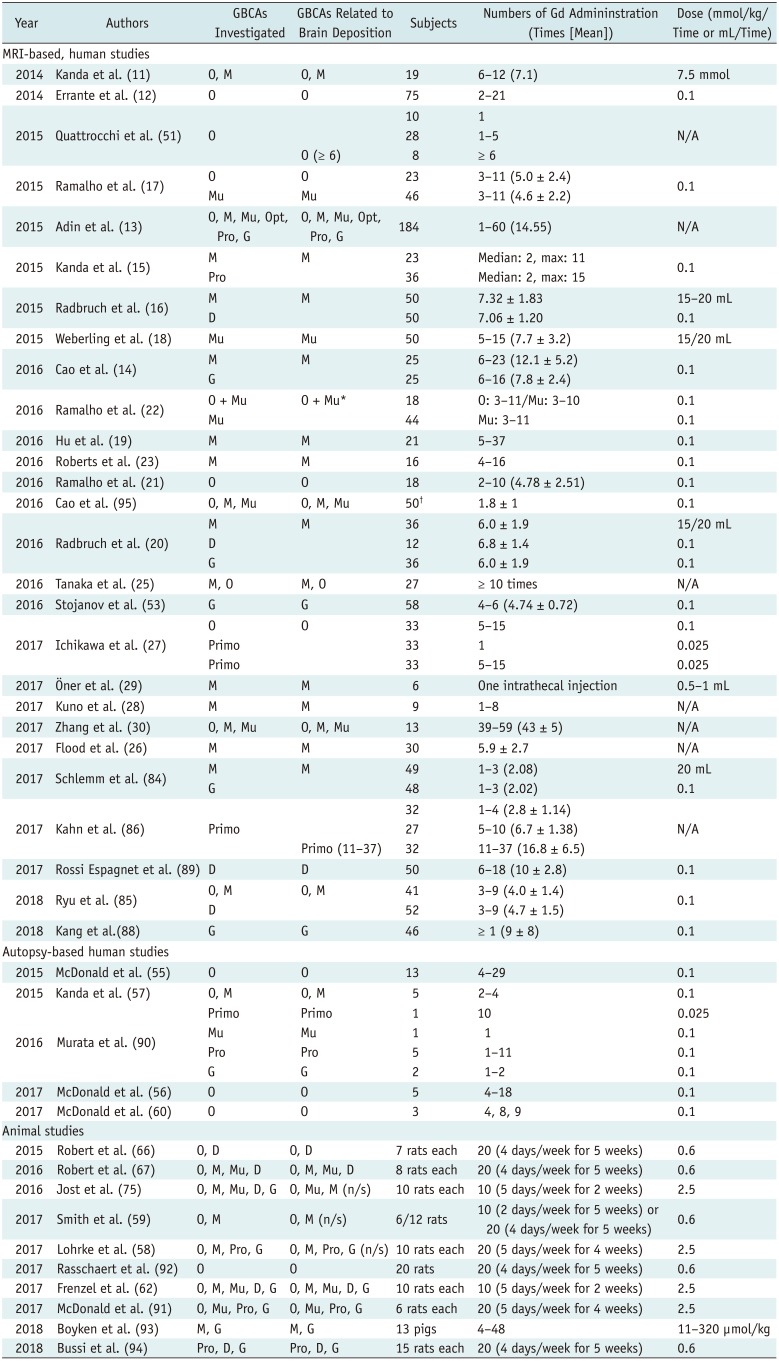
Table 2 summarizes the studies that demonstrate a relationship between GBCAs and signal intensity changes in the dentate nucleus and globus pallidus in human and animals.

Who Is Susceptible to Gadolinium Deposition in the Brain?

Current evidence suggests that a certain threshold needs to be reached in order to change the magnetic resonance (MR) signal after repeated injections of linear GBCAs. In a study with gadodiamide, at least 6 enhanced MRI scans were required to reveal the T1 hyperintensity in the dentate nucleus (51). Studies by Weberling et al. (18) and Adin et al. (13) have also supported the findings that at least 4–6 injections of linear GBCAs are required to cause a visually detectable T1 signal change in the dentate nucleus. Two autopsy studies on subjects exposed to gadodiamide have confirmed that gadolinium deposition in the brain showed a dose-dependent relationship with the injection doses of the GBCAs (5556).
Because most of GBCAs used for the diagnosis of brain diseases are exclusively excreted by the kidneys, longer retention times of the GBCAs in the body can be expected in patients with impaired renal function. A longer retention time in the body is associated with a higher chance of dechelation of the free Gd3+ from GBCAs, according to their stability and patients' conditions. Patients undergoing hemodialysis who have repeated injections of linear GBCAs have a greater T1 signal increase in the dentate nucleus compared to patients with near-normal renal function (95), which was corroborated by an animal study (92). All this evidence suggests that renal function affects the rate of gadolinium accumulation in the brain after linear GBCA injection.
The pediatric population has also shown similar findings in terms of gadolinium deposition in the brain. In studies by Hu et al. (19) and Roberts et al. (23), administration of at least 5 doses of gadopentetate was linked to an increased signal intensity of the dentate nucleus and/or globus pallidus. The dentate nucleus signal intensity was significantly correlated with the cumulative dose of GBCAs (26). However, macrocyclic GBCAs were not associated with T1 signal change of the dentate nucleus and globus pallidus in a pediatric population (96). In a study involving both linear GBCA-exposure and macrocyclic GBCA-exposure groups in a pediatric population, only linear GBCAs were found to be responsible for significant signal intensity increase in the dentate nucleus and globus pallidus between the first and last examination (85). Only one pediatric study of a macrocyclic GBCA (gadoterate meglumine) reported no visible T1 hyperintensities but an increase in the dentate nucleus-to-pons ratio and globus pallidus-to-thalamus ratio in subjects with multiple GBCA exposures (89). There is no clear evidence that pediatric subjects are more susceptible to gadolinium accumulation in the brain. Compared with adults, pediatric patients are more likely to be injected with GBCAs repeatedly throughout their lifetimes; furthermore, pediatric patients may have longer retention times after gadolinium deposition for the rest of their lives. Hence, because the developing brains of infants and children are more vulnerable to certain toxic agents, it is wise to consider pediatric patients as a high-risk group for gadolinium deposition in the brain.

How Can GBCA Deposition Be Visualized Using MRI?

In most of the human reports (Table 2), the T1 hyperintensity due to gadolinium deposition was observed using the spin-echo (SE) or turbo SE techniques (11121415171922232527282953858689). However, T1-weighted gradient-echo sequences, such as the fast low angle shot and magnetization-prepared rapid gradient echo (MPRAGE), can also be used to visualize the T1 hyperintensity due to GBCAs (131416182021263084). T1 FLAIR also depicts the T1 hyperintensity due to GBCAs (13).
Ramalho et al. (21) investigated the feasibility of T1 sequences for the visualization of gadolinium deposition. The authors found that the signal intensity ratio difference before and after GBCA exposures was significantly observed on both SE and MPRAGE sequences (21).
Kuno et al. (28) used T1 and T2 relaxation maps produced using the mixed fast spin echo pulse sequence to assess the effect of gadolinium accumulation in the global and regional brains of patients with prior exposure to linear GBCAs. In this study, the T1 values in the gray matter were significantly shorter in patients with prior GBCA exposure than in those without the prior exposure (p = 0.022). In addition, the authors also found the T1 value of the whole brain, globus pallidus, dentate nucleus, and thalamus and the T2 value of the whole brain, dentate nucleus, and thalamus to correlate significantly with the cumulative doses of GBCAs.
In another studies using T1 and T2* relaxometry, the T1 relaxation time in the dentate was significantly correlated with the number of GBCA administrations (8897). In contrast, the T2* signal intensity was age-dependent and independent of previous GBCA administrations (97).
Recently, it has been suggested that quantitative susceptibility mapping (QSM) enables us to calculate the susceptibility value change induced by GBCA accurately. Hinoda et al. (98) reported increased susceptibility of the brain areas in the multiple GBCA-exposure group as compared with the normal control group.
These quantitative study results using either T1/T2 mapping or QSM are completely in line with reports of T1 hyperintensities in the brains of patients with multiple exposures to GBCAs.

What Is the Clinical Significance of GBCA Deposition in the Brain?

Despite accumulating evidence of gadolinium deposition in the brain, little is known about the clinical importance of gadolinium accumulation in the brain. Considering the location of gadolinium deposition in the globus pallidus, one can infer that the gadolinium deposition might be associated with extrapyramidal system dysfunction and might be related to parkinsonism in later life.
In a population-based study (n = 246557) of two groups that underwent initial MR imaging between 2003 and 2013 (one group with exposure to at least one dose of GBCA and the other without the exposure), the authors found no significant difference in the presence of incidental parkinsonism between the two groups (99). The authors concluded that their results contradicted the hypothesis that gadolinium deposits in the globus pallidus lead to neuronal damage that manifests as parkinsonism. However, a weakness of this study was the lack of details on MR.
Bauer et al. (100) evaluated 376 patients who underwent both contrast-enhanced MR and PET/CT imaging between 2004 and 2015. They found that the median SUVmax of the dentate nucleus and globus pallidus was significantly lower in the group with exposure to gadolinium than in the control group; the differences were 16% and 27%, respectively. Accordingly, the authors speculated that gadolinium deposition led to decreased FDG uptake due to decreased metabolism in the corresponding area. However, they did not correlate these findings to clinical findings.
Semelka et al. (101) proposed a new disease category-gadolinium deposition disease-based on the observational study of 42 patients who underwent gadolinium-enhanced MRI previously. In the acute stage of gadolinium exposure, patients complained of central and peripheral pain, headache, bone pain, and skin thickening. In the chronic stage, 29 of 42 patients had persistent clouded mentation and headache.
At the time of introduction of GBCA, dose-dependent neurotoxicity was reported in a preclinical study using dogs (102). According to Roman-Goldstein et al. (103), gadopentetate dimeglumine administration after osmotic BBB disruption increased the frequency of delayed seizures in a dose-dependent fashion. Although human studies have not proven these findings of central nervous system toxicity, it is reasonable to suspect there is still a possibility of neurotoxicity due to gadolinium deposition in the brain when GBCA is given repetitively to subjects. Thus, further evidence is needed to explore the clinical impact of gadolinium deposition in the brain.

Are There Alternatives?

As discussed above, the exact nature and clinical implication of GBCA accumulation in the brain are still unknown. Despite the convincing evidence of a link between exposure to linear GBCA and gadolinium accumulation in the brain, we cannot currently conclude that macrocyclic GBCAs do not accumulate in the brain. At present, it is advisable to minimize the number of repeated doses of GBCA as much as possible. There are several ways to reduce the number of repeated doses of GBCA. A recent study has suggested a possibility that a deep learning method can be used to enhance the image quality of low-dose post-contrast enhanced images up to a level comparable to full-dose post-contrast enhanced images (104). Some other possibilities have been suggested, such as iron-contrast agents that can be used for contrast-enhanced MRI (105). Several interesting ideas have been tried to enhance the image quality of MRI, such as the use of natural D-glucose as an infusible biodegradable MRI agent (106). Other approaches include the use of endogenous contrasts, such as arterial spin labeling (107).
However, given the lack of evidence of clinical harm due to GBCA deposition in the brain, we also have to be careful about the potential harm from overprotective measures against GBCA use in clinical practice. In addition, we have to be careful to weigh the potential harm of GBCA-enhanced MRI without radiation exposure and that of iodine contrast-enhanced CT imaging with radiation exposure. Given the rarity of GBCA-related toxicity and brain deposition, for which the exact clinical implications are unknown, the risk of GBCA use should not be judged on the basis of perception rather than facts.

CONCLUSION

In summary, linear GBCAs were found to be almost exclusively responsible for the brain accumulation of gadolinium after repeated injections, as evidenced by T1 hyperintensity. Furthermore, the most recent animal studies have also documented the brain accumulation of gadolinium from macrocyclic agents, albeit at very low levels. The dechelation of free gadolinium from unstable GBCAs, transmetallation, active metal transporters in cell membranes, and the glymphatic system as an alternative access route to the brain may have roles in the underlying mechanisms of gadolinium accumulation. Linear GBCAs are considered to be less stable than macrocyclic GBCAs; therefore, they have a greater chance of brain deposition. Despite a lack of clinical evidence on the neurologic effects of gadolinium deposition, a careful approach to the use of GBCAs in clinical practice is advisable until further evidence is discovered.

Notes

This paper was written as part of Konkuk University's research support program for its faculty on sabbatical leave in 2016.

Conflicts of Interest: The authors have no financial conflicts of interest.

References

1. Matsumura T, Hayakawa M, Shimada F, Yabuki M, Dohanish S, Palkowitsch P, et al. Safety of gadopentetate dimeglumine after 120 million administrations over 25 years of clinical use. Magn Reson Med Sci. 2013; 12:297–304. PMID: 24172794.
crossref
2. Murphy KJ, Brunberg JA, Cohan RH. Adverse reactions to gadolinium contrast media: a review of 36 cases. AJR Am J Roentgenol. 1996; 167:847–849. PMID: 8819369.
crossref
3. Runge VM. Safety of approved MR contrast media for intravenous injection. J Magn Reson Imaging. 2000; 12:205–213. PMID: 10931582.
crossref
4. Runge VM. Safety of magnetic resonance contrast media. Top Magn Reson Imaging. 2001; 12:309–314. PMID: 11687717.
crossref
5. Marckmann P, Skov L, Rossen K, Dupont A, Damholt MB, Heaf JG, et al. Nephrogenic systemic fibrosis: suspected causative role of gadodiamide used for contrast-enhanced magnetic resonance imaging. J Am Soc Nephrol. 2006; 17:2359–2362. PMID: 16885403.
crossref
6. Grobner T. Gadolinium--a specific trigger for the development of nephrogenic fibrosing dermopathy and nephrogenic systemic fibrosis? Nephrol Dial Transplant. 2006; 21:1104–1108. PMID: 16431890.
crossref
7. Sieber MA, Lengsfeld P, Frenzel T, Golfier S, Schmitt-Willich H, Siegmund F, et al. Preclinical investigation to compare different gadolinium-based contrast agents regarding their propensity to release gadolinium in vivo and to trigger nephrogenic systemic fibrosis-like lesions. Eur Radiol. 2008; 18:2164–2173. PMID: 18545998.
crossref
8. Perez-Rodriguez J, Lai S, Ehst BD, Fine DM, Bluemke DA. Nephrogenic systemic fibrosis: incidence, associations, and effect of risk factor assessment--report of 33 cases. Radiology. 2009; 250:371–377. PMID: 19188312.
crossref
9. Thomsen HS. Nephrogenic systemic fibrosis: history and epidemiology. Radiol Clin North Am. 2009; 47:827–831. viPMID: 19744597.
crossref
10. ACR Committee on Drugs and Contrast Media. Nephrogenic Systemic Fibrosis. ACR Committee on Drugs and Contrast Media. ACR manual on contrast media, version 10.3. Reston, VA: American College of Radiology;2017. p. 81–89.
11. Kanda T, Ishii K, Kawaguchi H, Kitajima K, Takenaka D. High signal intensity in the dentate nucleus and globus pallidus on unenhanced T1-weighted MR images: relationship with increasing cumulative dose of a gadolinium-based contrast material. Radiology. 2014; 270:834–841. PMID: 24475844.
crossref
12. Errante Y, Cirimele V, Mallio CA, Di Lazzaro V, Zobel BB, Quattrocchi CC. Progressive increase of T1 signal intensity of the dentate nucleus on unenhanced magnetic resonance images is associated with cumulative doses of intravenously administered gadodiamide in patients with normal renal function, suggesting dechelation. Invest Radiol. 2014; 49:685–690. PMID: 24872007.
crossref
13. Adin ME, Kleinberg L, Vaidya D, Zan E, Mirbagheri S, Yousem DM. Hyperintense dentate nuclei on T1-weighted MRI: relation to repeat gadolinium administration. AJNR Am J Neuroradiol. 2015; 36:1859–1865. PMID: 26294649.
crossref
14. Cao Y, Huang DQ, Shih G, Prince MR. Signal change in the dentate nucleus on T1-weighted MR images after multiple administrations of gadopentetate dimeglumine versus gadobutrol. AJR Am J Roentgenol. 2016; 206:414–419. PMID: 26700156.
crossref
15. Kanda T, Osawa M, Oba H, Toyoda K, Kotoku J, Haruyama T, et al. High signal intensity in dentate nucleus on unenhanced T1-weighted MR Images: association with linear versus macrocyclic gadolinium chelate administration. Radiology. 2015; 275:803–809. PMID: 25633504.
crossref
16. Radbruch A, Weberling LD, Kieslich PJ, Eidel O, Burth S, Kickingereder P, et al. Gadolinium retention in the dentate nucleus and globus pallidus is dependent on the class of contrast agent. Radiology. 2015; 275:783–791. PMID: 25848905.
crossref
17. Ramalho J, Castillo M, AlObaidy M, Nunes RH, Ramalho M, Dale BM, et al. High signal intensity in globus pallidus and dentate nucleus on unenhanced T1-weighted MR images: evaluation of two linear gadolinium-based contrast agents. Radiology. 2015; 276:836–844. PMID: 26079490.
crossref
18. Weberling LD, Kieslich PJ, Kickingereder P, Wick W, Bendszus M, Schlemmer HP, et al. Increased signal intensity in the dentate nucleus on unenhanced T1-weighted images after gadobenate dimeglumine administration. Invest Radiol. 2015; 50:743–748. PMID: 26352749.
crossref
19. Hu HH, Pokorney A, Towbin RB, Miller JH. Increased signal intensities in the dentate nucleus and globus pallidus on unenhanced T1-weighted images: evidence in children undergoing multiple gadolinium MRI exams. Pediatr Radiol. 2016; 46:1590–1598. PMID: 27282825.
crossref
20. Radbruch A, Weberling LD, Kieslich PJ, Hepp J, Kickingereder P, Wick W, et al. Intraindividual analysis of signal intensity changes in the dentate nucleus after consecutive serial applications of linear and macrocyclic gadolinium-based contrast agents. Invest Radiol. 2016; 51:683–690. PMID: 27495187.
crossref
21. Ramalho J, Ramalho M, AlObaidy M, Nunes RH, Castillo M, Semelka RC. T1 signal-intensity increase in the dentate nucleus after multiple exposures to gadodiamide: intraindividual comparison between 2 commonly used sequences. AJNR Am J Neuroradiol. 2016; 37:1427–1431. PMID: 27032972.
crossref
22. Ramalho J, Semelka RC, AlObaidy M, Ramalho M, Nunes RH, Castillo M. Signal intensity change on unenhanced T1-weighted images in dentate nucleus following gadobenate dimeglumine in patients with and without previous multiple administrations of gadodiamide. Eur Radiol. 2016; 26:4080–4088. PMID: 26911888.
crossref
23. Roberts DR, Chatterjee AR, Yazdani M, Marebwa B, Brown T, Collins H, et al. Pediatric patients demonstrate progressive T1-weighted hyperintensity in the dentate nucleus following multiple doses of gadolinium-based contrast agent. AJNR Am J Neuroradiol. 2016; 37:2340–2347. PMID: 27469211.
crossref
24. Roberts DR, Holden KR. Progressive increase of T1 signal intensity in the dentate nucleus and globus pallidus on unenhanced T1-weighted MR images in the pediatric brain exposed to multiple doses of gadolinium contrast. Brain Dev. 2016; 38:331–336. PMID: 26345358.
crossref
25. Tanaka M, Nakahara K, Kinoshita M. Increased signal intensity in the dentate nucleus of patients with multiple sclerosis in comparison with neuromyelitis optica spectrum disorder after multiple doses of gadolinium contrast. Eur Neurol. 2016; 75:195–198. PMID: 27054693.
crossref
26. Flood TF, Stence NV, Maloney JA, Mirsky DM. Pediatric brain: repeated exposure to linear gadolinium-based contrast material is associated with increased signal intensity at unenhanced T1-weighted MR imaging. Radiology. 2017; 282:222–228. PMID: 27467467.
crossref
27. Ichikawa S, Motosugi U, Omiya Y, Onishi H. Contrast agent-induced high signal intensity in dentate nucleus on unenhanced T1-weighted images: comparison of gadodiamide and gadoxetic acid. Invest Radiol. 2017; 52:389–395. PMID: 28195932.
28. Kuno H, Jara H, Buch K, Qureshi MM, Chapman MN, Sakai O. Global and regional brain assessment with quantitative MR imaging in patients with prior exposure to linear gadolinium-based contrast agents. Radiology. 2017; 283:195–204. PMID: 27797676.
crossref
29. Öner AY, Barutcu B, Aykol S¸, Tali ET. Intrathecal contrast-enhanced magnetic resonance imaging-related brain signal changes: residual gadolinium deposition? Invest Radiol. 2017; 52:195–197. PMID: 27755154.
30. Zhang Y, Cao Y, Shih GL, Hecht EM, Prince MR. Extent of signal hyperintensity on unenhanced T1-weighted brain MR images after more than 35 administrations of linear gadolinium-based contrast agents. Radiology. 2017; 282:516–525. PMID: 27513848.
crossref
31. Drug Safety Communications. FDA identifies no harmful effects to date with brain retention of gadolinium-based contrast agents for MRIs; review to continue. U.S. Food & Drug Administration;Accessed May 26, 2018. Retrieved from https://www.fda.gov/downloads/Drugs/DrugSafety/UCM559654.pdf. Published July 27, 2015.
32. European Medicines Agency Science Medicines Health. EMA's final opinion confirms restrictions on use of linear gadolinium agents in body scans. European Medicines Agency;Accessed May 26, 2018. Retrieved from http://www.ema.europa.eu/docs/en_GB/document_library/Referrals_document/gadolinium_contrast_agents_31/Opinion_provided_by_Committee_for_Medicinal_Products_for_Human_Use/WC500231824.pdf. Published July 21, 2017.
33. European Medicines Agency Science Medicines Health. PRAC concludes assessment of gadolinium agents used in body scans and recommends regulatory actions, including suspension for some marketing authorisations. European Medicines Agency;Accessed May 26, 2018. Retrieved from http://www.ema.europa.eu/docs/en_GB/document_library/Referrals_document/gadolinium_contrast_agents_31/Recommendation_provided_by_Pharmacovigilance_Risk_Assessment_Committee/WC500223161.pdf. Published March 10, 2017.
34. Pharmaceuticals and Medical Devices Agency. Report on the investigation results. Pharmaceuticals and Medical Devices Agency;Accessed May 26, 2018. Retrieved from http://www.pmda.go.jp/files/000221379.pdf. Published November 11, 2017.
35. Advance notice on mandatory revision of the precautions section in the package insert of gadolinium agent. Ministry of Food and Drug Safety Web site. Accessed May 26, 2018. http://www.mfds.go.kr/brd/m_74/view.do?seq=40761. Published February 27, 2018.
36. Drug Safety Information-Gadolinium Agents. Ministry of Food and Drug Safety Decision Web site. Accessed May 26, 2018. http://www.mfds.go.kr/brd/m_545/view.do?seq=268. Published May 25, 2018.
37. Semelka RC, Ramalho M, AlObaidy M, Ramalho J. Gadolinium in humans: a family of disorders. AJR Am J Roentgenol. 2016; 207:229–233. PMID: 27224028.
crossref
38. Pałasz A, Czekaj P. Toxicological and cytophysiological aspects of lanthanides action. Acta Biochim Pol. 2000; 47:1107–1114. PMID: 11996100.
crossref
39. Morcos SK. Extracellular gadolinium contrast agents: differences in stability. Eur J Radiol. 2008; 66:175–179. PMID: 18343072.
crossref
40. Idée JM, Port M, Robic C, Medina C, Sabatou M, Corot C. Role of thermodynamic and kinetic parameters in gadolinium chelate stability. J Magn Reson Imaging. 2009; 30:1249–1258. PMID: 19938037.
41. Tweedle MF, Hagan JJ, Kumar K, Mantha S, Chang CA. Reaction of gadolinium chelates with endogenously available ions. Magn Reson Imaging. 1991; 9:409–415. PMID: 1881260.
crossref
42. Mann JS. Stability of gadolinium complexes in vitro and in vivo. J Comput Assist Tomogr. 1993; 17(Suppl 1):S19–S23. PMID: 8486827.
crossref
43. Frenzel T, Lengsfeld P, Schirmer H, Hütter J, Weinmann HJ. Stability of gadolinium-based magnetic resonance imaging contrast agents in human serum at 37℃. Invest Radiol. 2008; 43:817–828. PMID: 19002053.
44. Port M, Idée JM, Medina C, Robic C, Sabatou M, Corot C. Efficiency, thermodynamic and kinetic stability of marketed gadolinium chelates and their possible clinical consequences: a critical review. Biometals. 2008; 21:469–490. PMID: 18344005.
crossref
45. Roccatagliata L, Vuolo L, Bonzano L, Pichiecchio A, Mancardi GL. Multiple sclerosis: hyperintense dentate nucleus on unenhanced T1-weighted MR images is associated with the secondary progressive subtype. Radiology. 2009; 251:503–510. PMID: 19401576.
crossref
46. Prayer D, Grois N, Prosch H, Gadner H, Barkovich AJ. MR imaging presentation of intracranial disease associated with Langerhans cell histiocytosis. AJNR Am J Neuroradiol. 2004; 25:880–891. PMID: 15140741.
47. Kasahara S, Miki Y, Kanagaki M, Yamamoto A, Mori N, Sawada T, et al. Hyperintense dentate nucleus on unenhanced T1-weighted MR images is associated with a history of brain irradiation. Radiology. 2011; 258:222–228. PMID: 21045180.
crossref
48. Lai PH, Chen C, Liang HL, Pan HB. Hyperintense basal ganglia on T1-weighted MR imaging. AJR Am J Roentgenol. 1999; 172:1109–1115. PMID: 10587157.
crossref
49. Oikonomou A, Chatzistefanou A, Zezos P, Mintzopoulou P, Vadikolias K, Prassopoulos P. Basal ganglia hyperintensity on T1-weighted MRI in Rendu-Osler-Weber disease. J Magn Reson Imaging. 2012; 35:426–430. PMID: 22127848.
crossref
50. da Silva CJ, da Rocha AJ, Jeronymo S, Mendes MF, Milani FT, Maia AC Jr, et al. A preliminary study revealing a new association in patients undergoing maintenance hemodialysis: manganism symptoms and T1 hyperintense changes in the basal ganglia. AJNR Am J Neuroradiol. 2007; 28:1474–1479. PMID: 17846194.
crossref
51. Quattrocchi CC, Mallio CA, Errante Y, Cirimele V, Carideo L, Ax A, et al. Gadodiamide and dentate nucleus T1 hyperintensity in patients with meningioma evaluated by multiple follow-up contrast-enhanced magnetic resonance examinations with no systemic interval therapy. Invest Radiol. 2015; 50:470–472. PMID: 25756685.
crossref
52. Radbruch A, Weberling LD, Kieslich PJ, Hepp J, Kickingereder P, Wick W, et al. High-signal intensity in the dentate nucleus and globus pallidus on unenhanced T1-weighted images: evaluation of the macrocyclic gadolinium-based contrast agent gadobutrol. Invest Radiol. 2015; 50:805–810. PMID: 26523910.
53. Stojanov DA, Aracki-Trenkic A, Vojinovic S, Benedeto-Stojanov D, Ljubisavljevic S. Increasing signal intensity within the dentate nucleus and globus pallidus on unenhanced T1W magnetic resonance images in patients with relapsing-remitting multiple sclerosis: correlation with cumulative dose of a macrocyclic gadolinium-based contrast agent, gadobutrol. Eur Radiol. 2016; 26:807–815. PMID: 26105022.
crossref
54. Khant ZA, Hirai T, Kadota Y, Masuda R, Yano T, Azuma M, et al. T1 shortening in the cerebral cortex after multiple administrations of gadolinium-based contrast agents. Magn Reson Med Sci. 2017; 16:84–86. PMID: 27725576.
55. McDonald RJ, McDonald JS, Kallmes DF, Jentoft ME, Murray DL, Thielen KR, et al. Intracranial gadolinium deposition after contrast-enhanced MR imaging. Radiology. 2015; 275:772–782. PMID: 25742194.
crossref
56. McDonald RJ, McDonald JS, Kallmes DF, Jentoft ME, Paolini MA, Murray DL, et al. Gadolinium deposition in human brain tissues after contrast-enhanced MR imaging in adult patients without intracranial abnormalities. Radiology. 2017; 285:546–554. PMID: 28653860.
57. Kanda T, Fukusato T, Matsuda M, Toyoda K, Oba H, Kotoku J, et al. Gadolinium-based contrast agent accumulates in the brain even in subjects without severe renal dysfunction: evaluation of autopsy brain specimens with inductively coupled plasma mass spectroscopy. Radiology. 2015; 276:228–232. PMID: 25942417.
crossref
58. Lohrke J, Frisk AL, Frenzel T, Schöckel L, Rosenbruch M, Jost G, et al. Histology and gadolinium distribution in the rodent brain after the administration of cumulative high doses of linear and macrocyclic gadolinium-based contrast agents. Invest Radiol. 2017; 52:324–333. PMID: 28323657.
crossref
59. Smith AP, Marino M, Roberts J, Crowder JM, Castle J, Lowery L, et al. Clearance of gadolinium from the brain with no pathologic effect after repeated administration of gadodiamide in healthy rats: an analytical and histologic study. Radiology. 2017; 282:743–751. PMID: 27673510.
60. McDonald JS, McDonald RJ, Jentoft ME, Paolini MA, Murray DL, Kallmes DF, et al. Intracranial gadolinium deposition following gadodiamide-enhanced magnetic resonance imaging in pediatric patients: a case-control study. JAMA Pediatr. 2017; 171:705–707. PMID: 28531274.
61. Gianolio E, Bardini P, Arena F, Stefania R, Di Gregorio E, Iani R, et al. Gadolinium retention in the rat brain: assessment of the amounts of insoluble gadolinium-containing species and intact gadolinium complexes after repeated administration of gadolinium-based contrast agents. Radiology. 2017; 285:839–849. PMID: 28873047.
62. Frenzel T, Apte C, Jost G, Schöckel L, Lohrke J, Pietsch H. Quantification and assessment of the chemical form of residual gadolinium in the brain after repeated administration of gadolinium-based contrast agents: comparative study in rats. Invest Radiol. 2017; 52:396–404. PMID: 28125438.
63. Greenberg SA. Zinc transmetallation and gadolinium retention after MR imaging: case report. Radiology. 2010; 257:670–673. PMID: 20829541.
crossref
64. Swaminathan S. Gadolinium toxicity: iron and ferroportin as central targets. Magn Reson Imaging. 2016; 34:1373–1376. PMID: 27580520.
crossref
65. Kanda T, Nakai Y, Oba H, Toyoda K, Kitajima K, Furui S. Gadolinium deposition in the brain. Magn Reson Imaging. 2016; 34:1346–1350. PMID: 27613998.
crossref
66. Robert P, Lehericy S, Grand S, Violas X, Fretellier N, Idée JM, et al. T1-weighted hypersignal in the deep cerebellar nuclei after repeated administrations of gadolinium-based contrast agents in healthy rats: difference between linear and macrocyclic agents. Invest Radiol. 2015; 50:473–480. PMID: 26107651.
67. Robert P, Violas X, Grand S, Lehericy S, Idée JM, Ballet S, et al. Linear gadolinium-based contrast agents are associated with brain gadolinium retention in healthy rats. Invest Radiol. 2016; 51:73–82. PMID: 26606549.
crossref
68. Kartamihardja AA, Nakajima T, Kameo S, Koyama H, Tsushima Y. Distribution and clearance of retained gadolinium in the brain: differences between linear and macrocyclic gadolinium based contrast agents in a mouse model. Br J Radiol. 2016; 89:20160509. PMID: 27459250.
crossref
69. Kartamihardja AA, Nakajima T, Kameo S, Koyama H, Tsushima Y. Impact of impaired renal function on gadolinium retention after administration of gadolinium-based contrast agents in a mouse model. Invest Radiol. 2016; 51:655–660. PMID: 27299580.
crossref
70. Swaminathan S, Horn TD, Pellowski D, Abul-Ezz S, Bornhorst JA, Viswamitra S, et al. Nephrogenic systemic fibrosis, gadolinium, and iron mobilization. N Engl J Med. 2007; 357:720–722. PMID: 17699829.
crossref
71. Swaminathan S, Shah SV. New insights into nephrogenic systemic fibrosis. J Am Soc Nephrol. 2007; 18:2636–2643. PMID: 17855637.
crossref
72. Kanda T, Oba H, Toyoda K, Kitajima K, Furui S. Brain gadolinium deposition after administration of gadolinium-based contrast agents. Jpn J Radiol. 2016; 34:3–9. PMID: 26608061.
crossref
73. Valdés Hernández Mdel C, Maconick LC, Tan EM, Wardlaw JM. Identification of mineral deposits in the brain on radiological images: a systematic review. Eur Radiol. 2012; 22:2371–2381. PMID: 22688125.
crossref
74. Bressler JP, Olivi L, Cheong JH, Kim Y, Maerten A, Bannon D. Metal transporters in intestine and brain: their involvement in metal-associated neurotoxicities. Hum Exp Toxicol. 2007; 26:221–229. PMID: 17439925.
crossref
75. Jost G, Lenhard DC, Sieber MA, Lohrke J, Frenzel T, Pietsch H. Signal increase on unenhanced T1-weighted images in the rat brain after repeated, extended doses of gadolinium-based contrast agents: comparison of linear and macrocyclic agents. Invest Radiol. 2016; 51:83–89. PMID: 26606548.
76. Mamourian AC, Hoopes PJ, Lewis LD. Visualization of intravenously administered contrast material in the CSF on fluid-attenuated inversion-recovery MR images: an in vitro and animal-model investigation. AJNR Am J Neuroradiol. 2000; 21:105–111. PMID: 10669233.
77. Iliff JJ, Lee H, Yu M, Feng T, Logan J, Nedergaard M, et al. Brain-wide pathway for waste clearance captured by contrast-enhanced MRI. J Clin Invest. 2013; 123:1299–1309. PMID: 23434588.
crossref
78. Eide PK, Ringstad G. MRI with intrathecal MRI gadolinium contrast medium administration: a possible method to assess glymphatic function in human brain. Acta Radiol Open. 2015; 4:2058460115609635. PMID: 26634147.
crossref
79. Naganawa S, Nakane T, Kawai H, Taoka T. Gd-based contrast enhancement of the perivascular spaces in the basal ganglia. Magn Reson Med Sci. 2017; 16:61–65. PMID: 27430361.
crossref
80. Eisele P, Alonso A, Szabo K, Ebert A, Ong M, Schoenberg SO, et al. Lack of increased signal intensity in the dentate nucleus after repeated administration of a macrocyclic contrast agent in multiple sclerosis: an observational study. Medicine (Baltimore). 2016; 95:e4624. PMID: 27684794.
81. Kromrey ML, Liedtke KR, Ittermann T, Langner S, Kirsch M, Weitschies W, et al. Intravenous injection of gadobutrol in an epidemiological study group did not lead to a difference in relative signal intensities of certain brain structures after 5 years. Eur Radiol. 2017; 27:772–777. PMID: 27221561.
82. Lee JY, Park JE, Kim HS, Kim SO, Oh JY, Shim WH, et al. Up to 52 administrations of macrocyclic ionic MR contrast agent are not associated with intracranial gadolinium deposition: multifactorial analysis in 385 patients. PLoS One. 2017; 12:e0183916. PMID: 28859167.
crossref
83. Yoo RE, Sohn CH, Kang KM, Yun TJ, Choi SH, Kim JH, et al. Evaluation of gadolinium retention after serial administrations of a macrocyclic gadolinium-based contrast agent (gadobutrol): a single-institution experience with 189 patients. Invest Radiol. 2018; 53:20–25. PMID: 28742734.
84. Schlemm L, Chien C, Bellmann-Strobl J, Dörr J, Wuerfel J, Brandt AU, et al. Gadopentetate but not gadobutrol accumulates in the dentate nucleus of multiple sclerosis patients. Mult Scler. 2017; 23:963–972. PMID: 27679460.
crossref
85. Ryu YJ, Choi YH, Cheon JE, Lee WJ, Park S, Park JE, et al. Pediatric brain: gadolinium deposition indentate nucleus and globus pallidus on unenhanced T1-weighted images is dependent on the type of contrast agent. Invest Radiol. 2018; 53:246–255. PMID: 29300210.
86. Kahn J, Posch H, Steffen IG, Geisel D, Bauknecht C, Liebig T, et al. Is there long-term signal intensity increase in the central nervous system on T1-weighted images after MR imaging with the hepatospecific contrast agent gadoxetic acid? A cross-sectional study in 91 patients. Radiology. 2017; 282:708–716. PMID: 28076722.
crossref
87. Conte G, Preda L, Cocorocchio E, Raimondi S, Giannitto C, Minotti M, et al. Signal intensity change on unenhanced T1-weighted images in dentate nucleus and globus pallidus after multiple administrations of gadoxetate disodium: an intraindividual comparative study. Eur Radiol. 2017; 27:4372–4378. PMID: 28357495.
crossref
88. Kang KM, Choi SH, Hwang M, Yun TJ, Kim JH, Sohn CH. T1 shortening in the globus pallidus after multiple administrations of gadobutrol: assessment with a multidynamic multiecho sequence. Radiology. 2018; 287:258–266. PMID: 29091750.
crossref
89. Rossi Espagnet MC, Bernardi B, Pasquini L, Figà-Talamanca L, Tomà P, Napolitano A. Signal intensity at unenhanced T1-weighted magnetic resonance in the globus pallidus and dentate nucleus after serial administrations of a macrocyclic gadolinium-based contrast agent in children. Pediatr Radiol. 2017; 47:1345–1352. PMID: 28526896.
crossref
90. Murata N, Gonzalez-Cuyar LF, Murata K, Fligner C, Dills R, Hippe D, et al. Macrocyclic and other non-group 1 gadolinium contrast agents deposit low levels of gadolinium in brain and bone tissue: preliminary results from 9 patients with normal renal function. Invest Radiol. 2016; 51:447–453. PMID: 26863577.
91. McDonald RJ, McDonald JS, Dai D, Schroeder D, Jentoft ME, Murray DL, et al. Comparison of gadolinium concentrations within multiple rat organs after intravenous administration of linear versus macrocyclic gadolinium chelates. Radiology. 2017; 285:536–545. PMID: 28640692.
92. Rasschaert M, Idée JM, Robert P, Fretellier N, Vives V, Violas X, et al. Moderate renal failure accentuates T1 signal enhancement in the deep cerebellar nuclei of gadodiamide-treated rats. Invest Radiol. 2017; 52:255–264. PMID: 28067754.
crossref
93. Boyken J, Frenzel T, Lohrke J, Jost G, Pietsch H. Gadolinium accumulation in the deep cerebellar nuclei and globus pallidus after exposure to linear but not macrocyclic gadolinium-based contrast agents in a retrospective pig study with high similarity to clinical conditions. Invest Radiol. 2018; 53:278–285. PMID: 29319556.
crossref
94. Bussi S, Coppo A, Botteron C, Fraimbault V, Fanizzi A, De Laurentiis E, et al. Differences in gadolinium retention after repeated injections of macrocyclic MR contrast agents to rats. J Magn Reson Imaging. 2018; 47:746–752. PMID: 28730643.
crossref
95. Cao Y, Zhang Y, Shih G, Zhang Y, Bohmart A, Hecht EM, et al. Effect of renal function on gadolinium-related signal increases on unenhanced T1-weighted brain magnetic resonance imaging. Invest Radiol. 2016; 51:677–682. PMID: 27272543.
crossref
96. Tibussek D, Rademacher C, Caspers J, Turowski B, Schaper J, Antoch G, et al. Gadolinium brain deposition after macrocyclic gadolinium administration: a pediatric case-control study. Radiology. 2017; 285:223–230. PMID: 28640695.
97. Tedeschi E, Palma G, Canna A, Cocozza S, Russo C, Borrelli P, et al. In vivo dentate nucleus MRI relaxometry correlates with previous administration of Gadolinium-based contrast agents. Eur Radiol. 2016; 26:4577–4584. PMID: 26905870.
crossref
98. Hinoda T, Fushimi Y, Okada T, Arakawa Y, Liu C, Yamamoto A, et al. Quantitative assessment of gadolinium deposition in dentate nucleus using quantitative susceptibility mapping. J Magn Reson Imaging. 2017; 45:1352–1358. PMID: 27664936.
crossref
99. Welk B, McArthur E, Morrow SA, MacDonald P, Hayward J, Leung A, et al. Association between gadolinium contrast exposure and the risk of parkinsonism. JAMA. 2016; 316:96–98. PMID: 27380348.
crossref
100. Bauer K, Lathrum A, Raslan O, Kelly PV, Zhou Y, Hewing D, et al. Do gadolinium-based contrast agents affect 18F-FDG PET/CT uptake in the dentate nucleus and the globus pallidus? A pilot study. J Nucl Med Technol. 2017; 45:30–33. PMID: 27834725.
101. Semelka RC, Ramalho J, Vakharia A, AlObaidy M, Burke LM, Jay M, et al. Gadolinium deposition disease: initial description of a disease that has been around for a while. Magn Reson Imaging. 2016; 34:1383–1390. PMID: 27530966.
crossref
102. Muldoon LL, Neuwelt EA. Dose-dependent neurotoxicity (seizures) due to deposition of gadolinium-based contrast agents in the central nervous system. Radiology. 2015; 277:925–926.
crossref
103. Roman-Goldstein SM, Barnett PA, McCormick CI, Ball MJ, Ramsey F, Neuwelt EA. Effects of gadopentetate dimeglumine administration after osmotic blood-brain barrier disruption: toxicity and MR imaging findings. AJNR Am J Neuroradiol. 1991; 12:885–890. PMID: 1950917.
104. Gong E, Pauly JM, Wintermark M, Zaharchuk G. Deep learning enables reduced gadolinium dose for contrast-enhanced brain MRI. J Magn Reson Imaging. 2018; 48:330–340. PMID: 29437269.
crossref
105. Tweedle MF. Science to practice: will gadolinium chelates be replaced by iron chelates in MR imaging? Radiology. 2018; 286:409–411. PMID: 29356647.
crossref
106. Chan KW, McMahon MT, Kato Y, Liu G, Bulte JW, Bhujwalla ZM, et al. Natural D-glucose as a biodegradable MRI contrast agent for detecting cancer. Magn Reson Med. 2012; 68:1764–1773. PMID: 23074027.
107. Jahng GH, Li KL, Ostergaard L, Calamante F. Perfusion magnetic resonance imaging: a comprehensive update on principles and techniques. Korean J Radiol. 2014; 15:554–577. PMID: 25246817.
crossref
108. Ramalho J, Ramalho M. Gadolinium deposition and chronic toxicity. Magn Reson Imaging Clin N Am. 2017; 25:765–778. PMID: 28964466.
crossref
109. ACR Committee on Drugs and Contrast Media. Appendix A - Contrast media specifications. ACR manual on contrast media, version 10.3. Reston, VA: American College of Radiology;2017. p. 123–125.
110. Huckle JE, Altun E, Jay M, Semelka RC. Gadolinium deposition in humans: when did we learn that gadolinium was deposited in vivo? Invest Radiol. 2016; 51:236–240. PMID: 26588463.
111. Ramalho J, Semelka RC, Ramalho M, Nunes RH, AlObaidy M, Castillo M. Gadolinium-based contrast agent accumulation and toxicity: an update. AJNR Am J Neuroradiol. 2016; 37:1192–1198. PMID: 26659341.
crossref
112. Gulani V, Calamante F, Shellock FG, Kanal E, Reeder SB. International Society for Magnetic Resonance in Medicine. Gadolinium deposition in the brain: summary of evidence and recommendations. Lancet Neurol. 2017; 16:564–570. PMID: 28653648.
crossref
Fig. 1

Unenhanced coronal T1-turbo spin-echo images of basal ganglia in patient before (A) and after (B) five administrations of gadodiamide, showing signal-intensity increase in globus pallidus.

kjr-20-134-g001
Table 1

Widely Used Gadolinium-Based Contrast Agents in Korea, Including Names and Chemical Characteristics

kjr-20-134-i001
Chemical Structure Charges Generic Name Trade Name Viscosity 37˚C (cP or mPa's) Relaxivity 1.5 (3T) Osmolarity (mOsm/KgH20) Kinetic Stability (T1/2 at pH 1.0) Thermodynamic Stability Log KTherm (Log KCond) Excretion
Linear Non-ionic Gadodiamide Omniscan (GE Healthcare AS) 1.4 4.3 (4) 789 < 5 s at 25˚C 16.9 (14.9) Renal
Ionic Gadopentetate dimeglumine Magnevist (Bayer AG) 2.9 4.1 (3.7) 196 < 5 s at 25˚C 22.1 (17.7) Renal
Gadobenate dimeglumine MultiHance (Bracco Imaging S.p.A.) 5.3 6.3 (5.5) 1970 < 5 s at 25˚C 22.6 (18.4) 96% renal, 4% hepatic
Gadoxetate disodium Primovist (Bayer AG) 1.19 6.9 (6.2) 688 < 5 s at 25˚C 23.5 (18.7) 50% renal, 50% hepatic
Macrocyclic Non-ionic Gadoteridol ProHance (Bracco Imaging S.p.A.) 1.3 4.1 (3.7) 630 2.0 h at 37˚C 23.8 (17.1) Renal
Gadobutrol Gadovist (Bayer AG) 4.96 5.2 (5) 1603 7.9 h at 37˚C 21.8 (14.7) Renal
Ionic Gadoterate meglumine Dotarem (Guerbet) 2.4 3.6 (3.5) 1350 26.4 h at 37˚C 25.6 (19.3) Renal

Modified from tables of references (108–112). KCond = conditional stability constant at physiological pH, KTherm = thermodynamic stability constant, T1/2 = half-life time

Table 2

Studies on Gadolinium Deposition in the Brain

kjr-20-134-i002
Year Authors GBCAs Investigated GBCAs Related to Brain Deposition Subjects Numbers of Gd Admininstration (Times [Mean]) Dose (mmol/kg/Time or mL/Time)
MRI-based, human studies
2014 Kanda et al. (11) O, M O, M 19 6–12 (7.1) 7.5 mmol
2014 Errante et al. (12) O O 75 2–21 0.1
2015 Quattrocchi et al. (51) O 10 1 N/A
28 1–5
O (≥ 6) 8 ≥ 6
2015 Ramalho et al. (17) O O 23 3–11 (5.0 ± 2.4) 0.1
Mu Mu 46 3–11 (4.6 ± 2.2)
2015 Adin et al. (13) O, M, Mu, Opt, Pro, G O, M, Mu, Opt, Pro, G 184 1–60 (14.55) N/A
2015 Kanda et al. (15) M M 23 Median: 2, max: 11 0.1
Pro 36 Median: 2, max: 15
2015 Radbruch et al. (16) M M 50 7.32 ± 1.83 15–20 mL
D 50 7.06 ± 1.20 0.1
2015 Weberling et al. (18) Mu Mu 50 5–15 (7.7 ± 3.2) 15/20 mL
2016 Cao et al. (14) M M 25 6–23 (12.1 ± 5.2) 0.1
G 25 6–16 (7.8 ± 2.4)
2016 Ramalho et al. (22) O + Mu O + Mu* 18 O: 3–11/Mu: 3–10 0.1
Mu 44 Mu: 3–11 0.1
2016 Hu et al. (19) M M 21 5–37 0.1
2016 Roberts et al. (23) M M 16 4–16 0.1
2016 Ramalho et al. (21) O O 18 2–10 (4.78 ± 2.51) 0.1
2016 Cao et al. (95) O, M, Mu O, M, Mu 50† 1.8 ± 1 0.1
2016 Radbruch et al. (20) M M 36 6.0 ± 1.9 15/20 mL
D 12 6.8 ± 1.4 0.1
G 36 6.0 ± 1.9 0.1
2016 Tanaka et al. (25) M, O M, O 27 ≥ 10 times N/A
2016 Stojanov et al. (53) G G 58 4–6 (4.74 ± 0.72) 0.1
2017 Ichikawa et al. (27) O O 33 5–15 0.1
Primo 33 1 0.025
Primo 33 5–15 0.025
2017 Öner et al. (29) M M 6 One intrathecal injection 0.5–1 mL
2017 Kuno et al. (28) M M 9 1–8 N/A
2017 Zhang et al. (30) O, M, Mu O, M, Mu 13 39–59 (43 ± 5) N/A
2017 Flood et al. (26) M M 30 5.9 ± 2.7 N/A
2017 Schlemm et al. (84) M M 49 1–3 (2.08) 20 mL
G 48 1–3 (2.02) 0.1
2017 Kahn et al. (86) Primo 32 1–4 (2.8 ± 1.14) N/A
27 5–10 (6.7 ± 1.38)
Primo (11–37) 32 11–37 (16.8 ± 6.5)
2017 Rossi Espagnet et al. (89) D D 50 6–18 (10 ± 2.8) 0.1
2018 Ryu et al. (85) O, M O, M 41 3–9 (4.0 ± 1.4) 0.1
D 52 3–9 (4.7 ± 1.5)
2018 Kang et al.(88) G G 46 ≥ 1 (9 ± 8) 0.1
Autopsy-based human studies
2015 McDonald et al. (55) O O 13 4–29 0.1
2015 Kanda et al. (57) O, M O, M 5 2–4 0.1
2016 Murata et al. (90) Primo Primo 1 10 0.025
Mu Mu 1 1 0.1
Pro Pro 5 1–11 0.1
G G 2 1–2 0.1
2017 McDonald et al. (56) O O 5 4–18 0.1
2017 McDonald et al. (60) O O 3 4, 8, 9 0.1
Animal studies
2015 Robert et al. (66) O, D O, D 7 rats each 20 (4 days/week for 5 weeks) 0.6
2016 Robert et al. (67) O, M, Mu, D O, M, Mu, D 8 rats each 20 (4 days/week for 5 weeks) 0.6
2016 Jost et al. (75) O, M, Mu, D, G O, Mu, M (n/s) 10 rats each 10 (5 days/week for 2 weeks) 2.5
2017 Smith et al. (59) O, M O, M (n/s) 6/12 rats 10 (2 days/week for 5 weeks) or 20 (4 days/week for 5 weeks) 0.6
2017 Lohrke et al. (58) O, M, Pro, G O, M, Pro, G (n/s) 10 rats each 20 (5 days/week for 4 weeks) 2.5
2017 Rasschaert et al. (92) O O 20 rats 20 (4 days/week for 5 weeks) 0.6
2017 Frenzel et al. (62) O, M, Mu, D, G O, M, Mu, D, G 10 rats each 10 (5 days/week for 2 weeks) 2.5
2017 McDonald et al. (91) O, Mu, Pro, G O, Mu, Pro, G 6 rats each 20 (5 days/week for 4 weeks) 2.5
2018 Boyken et al. (93) M, G M, G 13 pigs 4–48 11–320 μmol/kg
2018 Bussi et al. (94) Pro, D, G Pro, D, G 15 rats each 20 (4 days/week for 5 weeks) 0.6

*There is increased T1 signal change over time in patients who underwent gadobenate dimeglumine-enhanced studies and had prior administration of gadodiamide compared to those who received gadobenate dimeglumine alone, Patients for impaired renal function. D = Dotarem (Guerbet), G = Gadovist (Bayer AG), GBCAs = gadolinium-based contrast agents, Gd = gadolinium, M = Magnevist (Bayer AG), Mu = MultiHance (Bracco Imaging S.p.A.), N/A = not available, n/s = not significant, O = Omniscan (GE Healthcare AS), Opt = OptiMark (Guerbet), Primo = Primovist (Bayer AG), Pro = ProHance (Bracco Imaging S.p.A.)

TOOLS
Similar articles