

 PDF
PDF ePub
ePub Citation
 Print
Print


INTRODUCTION
Gastric cancer is one of the most common malignant tumors and the second leading cause of cancer-related death worldwide (12). Among the various treatment options for patients with gastric cancer, surgical resection is the only known curative treatment able to achieve long-term survival (3). Unfortunately, however, surgical resection cannot be performed in a substantial proportion of gastric cancer patients because more than two-thirds exhibit unresectable disease owing to the presence of distant metastasis and/or invasion to adjacent organs such as the pancreas (2). Thus, in patients with unresectable advanced gastric cancer (AGC), palliative chemotherapy, which has demonstrated the potential to improve both patient survival and quality of life, has been the standard treatment method (45). However, the reported response rates of unresectable AGCs to palliative chemotherapy has ranged only between 40% and 70%. Therefore, earlier prediction of treatment response to palliative chemotherapy would be clinically important, and enable more appropriate management planning including the early termination of ineffective chemotherapy regimens and replacing them with more effective alternatives.
Traditionally, the treatment response to systemic chemotherapy in patients with malignant diseases, such as AGC, has been evaluated using morphological size-based criteria, for which the Response Evaluation Criteria in Solid Tumors (RECIST) version 1.1 has been the most widely used method (6). However, it is also well-known that after systemic chemotherapy, perfusion and/or biological changes can develop within the tumor before any change in tumor size. Therefore, to overcome this limitation of current morphological size-based criteria, several functional imaging approaches, such as multiparametric magnetic resonance imaging (MRI), positron emission tomography, and perfusion imaging using either CT or MR have been introduced (789101112). Among them, perfusion CT (PCT) has emerged as a promising functional imaging modality able to evaluate tissue perfusion characteristics in acute stroke and oncological patients (13141516). In fact, several studies have reported that obtaining perfusion parameter data from PCT in gastric cancer patients may be feasible, and that several perfusion parameters calculated from this PCT dataset may provide information regarding vascularity as well as the neo-angiogenesis of gastric cancers (17181920). Our group also recently reported that the permeability surface (PS) and mean transit time (MTT) values of gastric cancer can help in the preoperative imaging diagnosis of poorly cohesive carcinoma (PCC)-type AGCs, which generally have a worse prognosis compared with other histological subtypes of gastric cancer, even after curative resection (21). However, to date, the potential utility of PCT in predicting treatment response after systemic chemotherapy in patients with unresectable AGCs has not been investigated. Therefore, the purpose of this study was to prospectively evaluate whether perfusion parameter data acquired from the PCT dataset can help predict treatment response, including one-year survival, in patients with unresectable AGC.
MATERIALS AND METHODS
The Institutional Review Board of the authors' hospital approved this prospective study, and informed written informed consent was obtained from all patients.
Patients
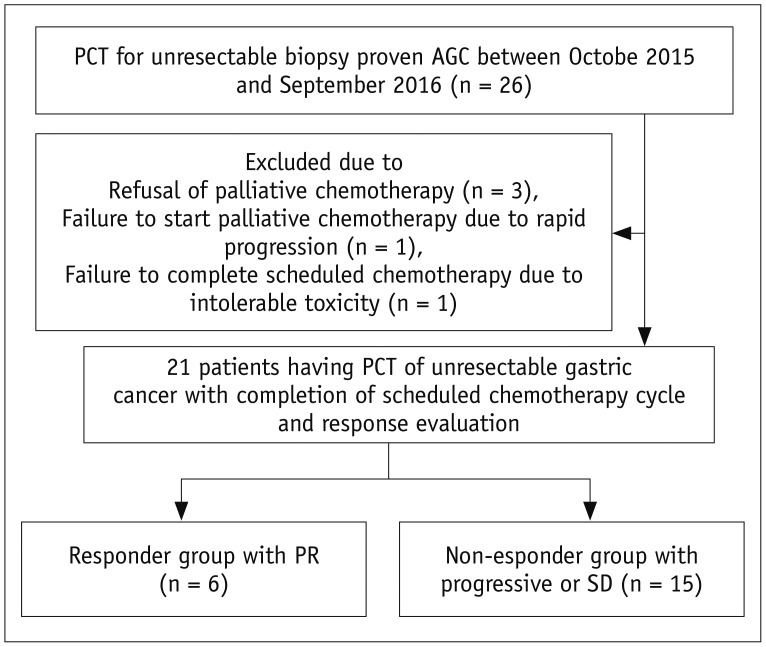
From October 2015 to September 2016, 26 patients who met the following inclusion criteria were prospectively enrolled in this study: histopathologically proven gastric cancers diagnosed through endoscopic biopsy; preoperative staging workup including multi-detector contrast-enhanced CT (MDCT) scans indicating unresectable disease owing to either the presence of distant metastasis or invasion of adjacent organs including the pancreas, liver, diaphragm, or colon; and palliative chemotherapy planned to control the unresectable AGC. PCT was performed in all 26 patients, among whom, five were excluded for the following reasons: refusal of palliative chemotherapy (n = 3); failure to start palliative chemotherapy due to the rapid progression of AGC with deterioration in performance status (n = 1); and failure to complete the scheduled chemotherapy due to intolerable toxicity (i.e., severe neutropenia with fever) (n = 1). Therefore, 21 patients (13 male, eight female; mean [± standard deviation] age, 53.7 ± 14.3 years [age range, 31–83 years]) ultimately comprised the study population (Fig. 1). The reasons for un-resectability were the presence of distant metastasis in 19 patients and invasion of the pancreas by AGC in the remaining two patients. In the 19 patients with distant metastasis, the location of distant metastasis on imaging examination included the liver (n = 8), peritoneum (n = 5), retroperitoneal lymph node (n = 4), lung (n = 1), and ovary (n = 1). All eight patients with liver metastasis, one patient with lung metastasis, and two with peritoneal seeding were diagnosed through histopathological examination using specimens obtained through percutaneous biopsy (liver metastases [n = 8] and lung metastasis [n = 1]) or diagnostic laparoscopy (peritoneal seeding [n = 2]). The remaining three patients with peritoneal seeding, one with ovarian metastasis, and all four patients with retroperitoneal lymph node metastases were diagnosed clinically. The histological subtypes of AGC included: moderately-differentiated adenocarcinoma (n = 5); poorly-differentiated adenocarcinoma (n = 10); and PCC (n = 6).
PCT Acquisition
All PCT examinations were performed using an MDCT scanner (Definition; Siemens Healthineers, Erlangen, Germany). All participating patients fasted for at least 6 hours before PCT acquisition, and each patient drank 500–1000 mL of water before the PCT examination to distend the stomach for better delineation of the gastric cancer lesion(s) (12172022). Hyoscine butylbromide (10 mg; Buscopan, Boehringer Ingelheim Korea, Seoul, Korea) was also injected intravenously 5 minutes before PCT acquisition if not contraindicated so as to minimize gastric movement during the examination, which could cause motion-related artifacts (1221). To minimize respiratory motion-related artifacts during the PCT examination, patients were asked to breathe as calmly as possible. For PCT acquisition, non-contrast images were initially acquired before contrast injection from the liver dome to the lower margin of the right kidney, and the exact location of the gastric cancer was identified. Thereafter, 40 mL of a nonionic iodinated contrast agent (350 mg I/mL; iobitridol, Xenetix 350, Guerbet, Aulnay-sous-Bois, France) was injected at a rate of 5 mL/s through an 18-gauge catheter placed into an antecubital vein, followed by a saline flush of 50 mL at the same rate using a power injector. PCT acquisition was started 6 seconds after contrast injection because there can be an approximately 10 seconds time interval between contrast injection and contrast arrival to the aorta (21). PCT scans were performed using the following parameters: scan range, 8 cm (according to the location of the AGC); gantry rotation time, 0.4 seconds; effective tube current, 100 mAs at 80 kVp power; reconstruction section thickness, 3 mm; cycle time, 3.6 seconds; and number of scans, 15, which lasted for 60 seconds. Mean dose length product of PCT in the 21 patients was 975.8 ± 261.9 mGy·cm (range, 675–1548 mGy·cm). The estimated mean effective radiation dose was 14.6 ± 3.93 mSv with a conversion factor of 0.015 mSv/mGy·cm (2123).
PCT Analysis
For the analysis of PCT data, a dedicated perfusion software program (VPCT body, Siemens Healthineers) using the maximum slope and delayed Patlak analysis models was used. PCT analyses of AGCs were performed by two different abdominal radiologists (with 9 and 5 years' experience in abdominal perfusion imaging, respectively) who were aware that the patients had AGCs and were treated with systemic chemotherapy, but were blinded to the response of AGC to chemotherapy. First, the reconstructed images were transferred to a workstation where the perfusion software program was installed. Thereafter, a motion correction algorithm using the non-rigid registration method was applied for each PCT examination so as to minimize analysis errors owing to motion during the PCT acquisition. Thereafter, the aorta was chosen as the input artery with regions of interest (ROIs) placed on the abdominal aorta in the representative axial plane. ROIs were manually drawn for the AGC lesion to be as large as possible on the representative axial plane, with special care taken not to include perigastric fat, or intragastric air or water (21). The mean area of the ROIs drawn on the tumor was 839.3 ± 511.2 mm2 (range, 261.2–1954.1 mm2). Finally, parametric perfusion maps were generated using a high-resolution, pixel-by-pixel calculation method which automatically calculated the ROI values of the following perfusion parameters: blood flow (BF) (mL/100 g/min); blood volume (BV) (mL/100 g); MTT (seconds); time to peak (TTP) (seconds); and PS (mL/100 g/min). These resultant perfusion parameters for AGC were recorded for further analysis.
Palliative Chemotherapy and Response Evaluation
After PCT examination, all patients underwent palliative chemotherapy using one of the three following regimens: XELOX, which is a combination of capecitabine (Xeloda®) and cisplatin and oxaliplatin in 10 patients; FOLFOX, a combination of infusional 5-fluorouracil (5-FU), leucovorin and oxaliplatin in 7 patients; and XP, a combination of capecitabine (Xeloda®) and cisplatin in 4 patients. Treatments were repeated every two or three weeks using the same regimen until disease progression and/or development of intolerable severe toxicity. Treatment response to chemotherapy was evaluated by one abdominal radiologist (with 9 years' experience in clinical radiology) using RECIST version 1.1 (6). Follow-up contrast-enhanced abdominal CT was performed and each patient was evaluated to determine treatment response. The mean interval between the start of chemotherapy and response evaluation was 61.3 ± 18.1 days (range, 23–90 days). After determination of the response category of each patient, patients were classified into two groups: the responder group for patients in whom complete response (CR) or partial response (PR) was observed; and the non-responder group for patients who were determined to have a stable disease (SD) or progressive disease (PD).
Statistical Analysis
To compare baseline characteristics, distribution of histological subtypes, chemotherapy regimens, as well as PCT perfusion parameters between those in the responder and non-responder groups, Fisher's exact test was used for categorical variables and the Mann-Whitney U test for continuous variables. When significant differences in perfusion parameters were found between the two groups, receiver operating characteristic (ROC) analysis was performed. The area under the curve (AUC) was estimated using ROC analysis with the determination of the optimal cut-off value to calculate sensitivity and specificity. In addition, the Mann-Whitney U test was used to compare PCT parameters between PCC and non-PCC type of AGCs.
To assess the measurement reproducibility of PCT perfusion parameters of AGC between the two radiologists, intraclass correlation coefficients (ICCs) with two-tailed p values were used. An ICC value > 0.81 was considered to represent almost perfect agreement, and values of 0.61–0.80, 0.41–0.60, and 0.21–0.40, to represent substantial, moderate, and fair agreement, respectively (12). An ICC value < 0.20 indicated slight agreement. In addition, the Bland-Altman method was used to calculate 95% limits of agreement for each perfusion parameter of AGC obtained from each radiologist.
To compare the survival rate after palliative chemotherapy, the study population was divided into two groups according to the cut-off PCT value determined by the ROC analysis. Patient survival after palliative chemotherapy for AGC was defined as the interval between start of treatment and patient death or the last follow-up visit before December 31, 2017, and estimated using the Kaplan-Meier method. A log-rank test was used to compare the survival rate between the patient groups. The Cox proportional hazard regression model was used to identify the significant determinant factors for survival after palliative chemotherapy for unresectable AGC. All statistical analyses were performed using SPSS version 22 (IBM Corp., Armonk, NY, USA) and MedCalc software version 12.2.1.0 (Mariakerke, Belgium); p < 0.05 was considered to indicate statistical significance.
RESULTS
Technical Success and Reproducibility of Measurements
Acquisition and analysis of PCT were possible in all 21 patients. ICC values of perfusion parameters between the two radiologists were 0.828 for BF, 0.869 for BV, 0.787 for TTP, 0.442 for MTT, and 0.843 for PS, indicating moderate to almost perfect agreement. The 95% limits of agreement assessed using the Bland-Altman plots were: −56.5–45.3% for BF; −55.7–39.9% for BV; −13.0–14.8% for TTP; −65.9–76.3% for MTT; and −82.4–103.4% for PS.
Response Evaluation after Chemotherapy
After chemotherapy, PR was achieved in six patients, SD in nine, and PD in six. No patients achieved CR after chemotherapy. Therefore, 6 patients with PR were allocated to the responder group (6/21 [28.6%]) and 15 (6 with PD and 9 with SD) to the non-responder group. There were no significant differences in chemotherapy regimens between the two groups (p = 0.983). In addition, there were no significant differences in all PCT parameters including PS and MTT between PCC and non-PCC histological subtypes (p > 0.05 for all PCT parameters).
Predictors of Treatment Response
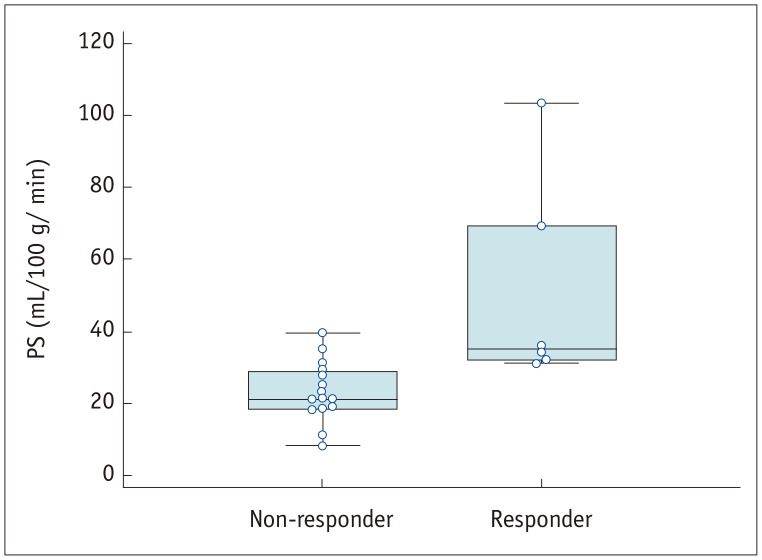
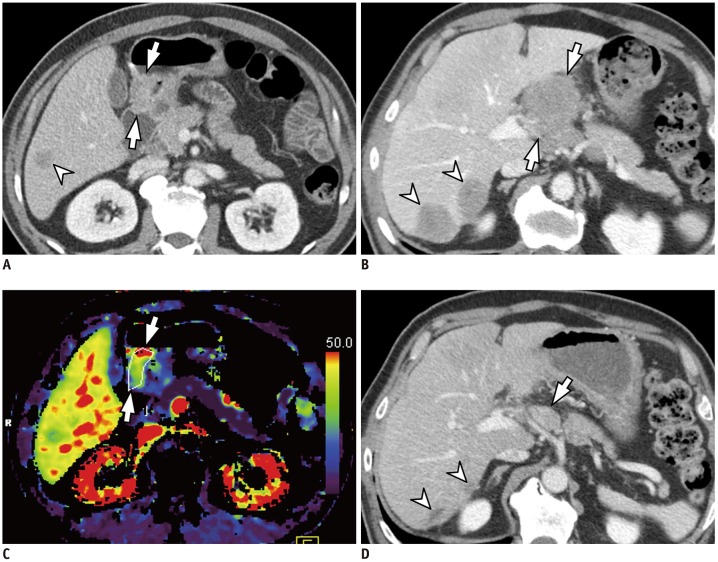
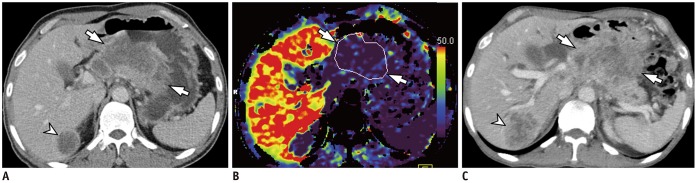
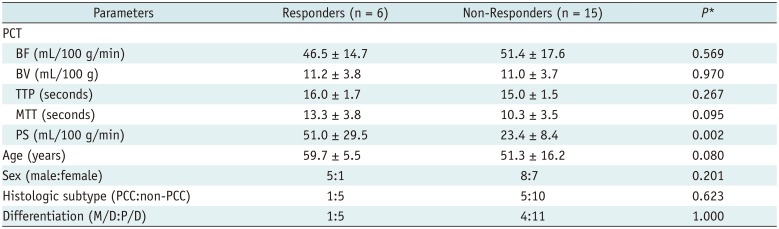
Predictors of treatment response to systemic chemotherapy in patients with unresectable AGCs are summarized in Table 1. Mean PS value (51.0 mL/100 g/min) of AGCs in the responder group was significantly higher than in the non-responder group (23.4 mL/100 g/min) (p = 0.002) (Figs. 2,3,4). The other perfusion parameters were not revealed to be significantly different between the two groups. Histological subtype (PCC versus non-PCC) and differentiation (moderately differentiated versus poorly differentiated) of gastric cancer also did not significantly differ between the groups.
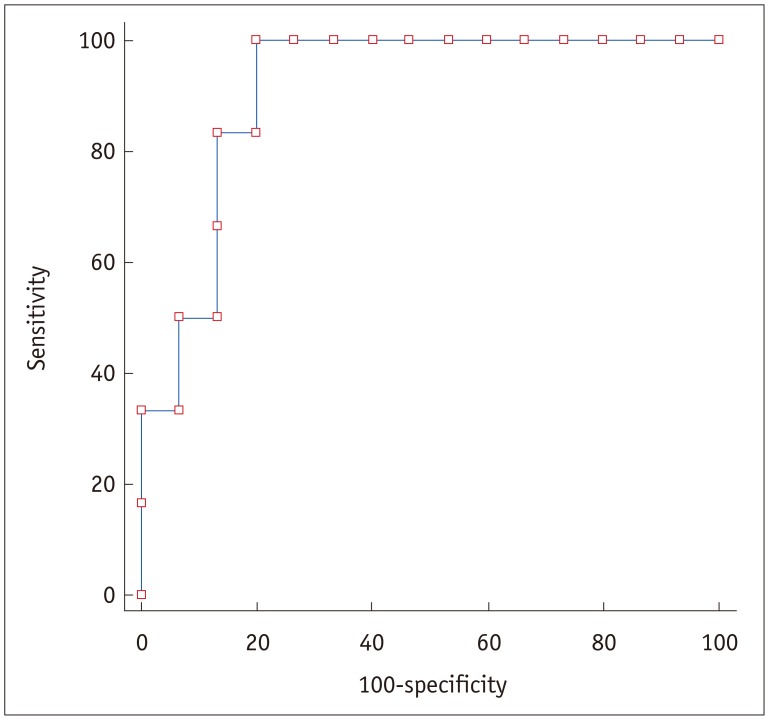
ROC analysis revealed that the AUC for PS was 0.911 (95% confidence interval [CI] 0.780–1.000; p < 0.001) (Fig. 5). A sensitivity of 100% (6/6) and a specificity of 80% (12/15) for chemotherapy response were achieved at a cut-off value of 29.7 mL/100 g/min for the PS value. The corresponding positive predictive value was 66.7% (6/9) and the negative predictive value was 100% (12/12).
Survival Outcome
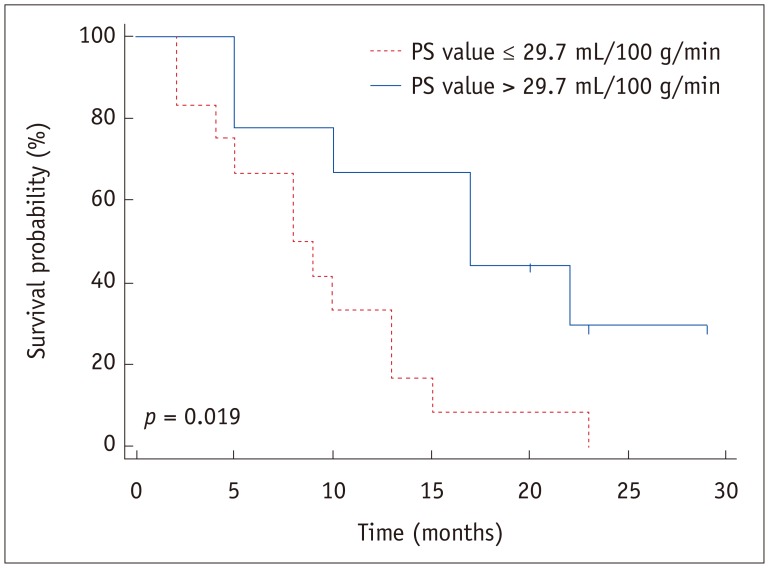
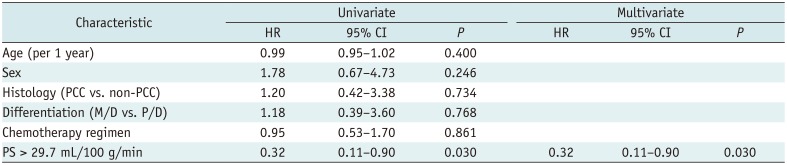
After a mean and median follow-up of 12.4 ± 7.8 months and 10.0 months, respectively, 18 patients died due to the progression of AGC, and the remaining three patients were still alive at the end of the study period. The estimated 1-year survival after palliative chemotherapy for AGC in all 21 patients was 47.6%. The estimated 1-year survival in nine patients with > 29.7 mL/100 g/min of PS value was 66.7% and was significantly higher than in the 12 patients with PS value ≤ 29.7 mL/100 g/min (33.3%) (p = 0.019) (Fig. 6). Cox proportional hazard regression analysis revealed that PS value of AGC > 29.7 mL/100 g/min was the only significant predictive factor for better survival (hazard ratio 0.320 [95% CI 0.11–0.90]; p = 0.030) (Table 2). Other parameters, such as chemotherapy regimen, did not significantly affect patient survival.
DISCUSSION
In our study, perfusion parameter data were successfully acquired from PCT in all patients with unresectable AGCs, with moderate to almost perfect agreement between the two radiologists. In addition, the mean PS value (51.0 mL/100 g/min) of AGCs in the responder group was significantly higher than in the non-responder group (23.4 mL/100 g/min) (p = 0.002). This suggests that PCT parameters specifically, the PS value may be used as a predictive marker for the treatment response to systemic chemotherapy. Furthermore, PS value > 29.7 mL/100 g/min was the only significant predictive factor for better survival after palliative chemotherapy, probably due to better response to chemotherapy in this patient group. According to our results, the difference in mean PS values between the responder and non-responder groups was 27.6 mL/100 g/min, a difference of 118%. Considering that the 95% limits of agreement for the PS value between the radiologists was −82.4–103.4%, and that this difference of 118% was beyond the 95% limits of agreement, our results can be interpreted with confidence. Recently, PCT has emerged as an attractive functional imaging modality that can provide information regarding both the vascularity and neo-angiogenesis process of tumors in oncologic fields (13141516). It has also been shown to provide prognostic information regarding the treatment response to systemic chemotherapy (24). Therefore, our study results reconfirm the value of PCT in providing clinically relevant information in patients with unresectable AGCs.
By definition, PS values can reflect the contrast media transmission rate from the intravascular space to the extravascular and extracellular space. Therefore, it can provide information regarding the integrity of endothelial cells and vascular permeability (17). In addition, previous studies have reported that malignant tumors often have higher PS values than normal tissue, owing to the large number of fenestrations, and discontinuous or absent basement membranes in the tumor capillaries and neovasculature (2526). In specific application, Bellomi et al. (27) reported that PS values of rectal cancer were significantly higher than that of the normal rectal wall. Considering this theoretical background, higher PS values can be considered to reflect more permeable and leaky tumor vasculature. Therefore, this more permeable tumor vasculature may provide better access to chemotherapeutic agents, which in turn may lead to a more favorable response to systemic chemotherapy (1228). In fact, according to a recent article by Kruk-Bachonko et al. (22), neoadjuvant therapy was shown to be more effective in gastric cancer patients with higher PS values. Our study findings also correlate well with this recent result. The potential importance of vascular permeability in the prediction of treatment response to chemotherapy in patients with malignant tumors has also been reported in perfusion MRI. According to Lim et al. (29), locally advanced rectal cancers with high Ktrans values, which also reflects vascular permeability, responded favorably to neoadjuvant chemoradiation therapy. Our group also recently reported that Ktrans values of AGCs obtained from multi-parametric MRI, including perfusion MRI, was a significant predictive factor for treatment response as Ktrans values in responder-group patients were significantly higher than that of non-responder-group patients (12). Considering the results of these previous studies, as well as our study, we believe that the PS value obtained from PCT could be useful in the prediction of treatment response in patients with AGCs treated with systemic chemotherapy.
In our study, all CT perfusion parameters, including MTT and PS of PCC type of AGC, were not significantly different from those of non-PCC type of AGC. This result was somewhat different from the result of our previous investigation (21), in that PS and MTT values of PCC type of AGC were significantly higher than those of non-PCC type AGC. We believe that this difference can, in large part, be explained by the difference in reference standard between two studies: endoscopic biopsy in this study versus surgical specimen after gastrectomy in the previous study (21). In fact, according to the previous report, only 53.3% (8/15) of PCC cases were correctly diagnosed as PCC on preoperative endoscopic biopsy, and the remaining 46.7% (7/15) of PCC cases diagnosed using surgical specimen(s) were misdiagnosed as adenocarcinoma in preoperative endoscopic biopsy (21). Therefore, there would be some limitations in the diagnosis of PCC using endoscopic biopsy, which could explain the difference in results regarding perfusion parameters of AGC between the current study and previous studies (21).
Although PCT has emerged as an attractive functional imaging modality in oncologic fields, there have been continuous challenges to acquiring perfusion parameters for the gastrointestinal tract, including the stomach, such as motion-related artifacts during PCT (21). The potential increase in radiation exposure during PCT has been another major drawback that has prevented the widespread use of PCT. In our study, we used 80 kVp with 100 mAs, instead of the standard 120 kVp to reduce the radiation dose of PCT. Furthermore, the scan range of PCT was meticulously adjusted to the location of the lesion, which was demonstrated on precontrast CT scan and endoscopic images for further reduction of PCT radiation dose. Consequently, the mean effective radiation dose of PCT in this study was 14.6 mSv, which is not much higher than the routine abdominal multiphasic CT dose of 10–15 mSv, probably due to the use of low tube voltage and tight adjustment of scan range.
There are several limitations to this study that should be acknowledged. First, owing to the relatively small study population, our statistical power was not strong. Furthermore, because our investigation was a single-center study, selection bias may have been introduced. Therefore, to confirm the results of our study and to establish the exact role of PCT in the management of AGC patients, further multicenter studies with a larger number of patients are strongly warranted. Second, only one available software program from one specific vendor was used in our study. According to the results of several previous studies, however, there may be some discordance in perfusion parameters obtained from different software programs and, therefore, the results from different software programs may not be interchangeable (303132). Therefore, to generalize our study results, further studies using different software programs from different vendors using various perfusion models are strongly warranted. Third, because we did not perform follow-up PCT examinations after palliative chemotherapy for unresectable AGC, we could not assess changes in perfusion parameters, especially PS, after the cycles of palliative chemotherapy. In fact, we believe that the assessment of changes in perfusion parameters of AGC during or after chemotherapy would be an interesting and important topic. Therefore, further studies including both baseline and follow-up PCT examinations after the chemotherapy cycles would be needed to address this issue.
In conclusion, perfusion parameter data acquired by PCT may be used as predictive imaging biomarkers for the evaluation of treatment response to systemic chemotherapy, given that the PS value in the responder group was significantly higher than that of non-responders.
 XML Download