

 PDF
PDF ePub
ePub Citation
 Print
Print


INTRODUCTION
Computed tomography (CT) has been widely utilized as a non-invasive diagnostic modality for visualizing coronary arteries and excluding coronary artery diseases. However, motion artifacts caused by rapid cardiac movements remain a major challenge for better image quality and higher diagnostic accuracy in predicting coronary artery disease (12).
To reduced motion artifact and improve diagnostic accuracy, CT scanners with higher temporal resolutions and wide detector arrays have been developed. In addition to this hardware development, motion-correction algorithm (MCA) has recently been introduced to compensate for coronary motion artifacts. MCA can characterize vessel motions (both path and velocity) using information from adjacent cardiac phases within a single cardiac cycle and determine the actual vessel location at the prescribed target phase (3).
Previous studies have shown MCA's beneficial effect on the image quality of coronary CT angiography in patients with a high heart rate (HR) or without HR control (45). However, most studies were performed with a 64-slice single-source dual-energy CT scanner. Liang et al. (6) demonstrated that the use of MCA on a 256-detector row multi-detector CT scanner could significantly improve image quality and diagnostic performance in patients with HR ≥ 75 beats per minute (bpm). However, the effect of HR on motion correction was not analyzed in their study.
Thus, the purpose of this study was to investigate the efficacy of MCA in improving coronary artery image quality and measurement accuracy using an anthropomorphic dynamic heart phantom and 256-detector row CT scanner.
MATERIALS AND METHODS
Anthropomorphic Dynamic Heart Phantom
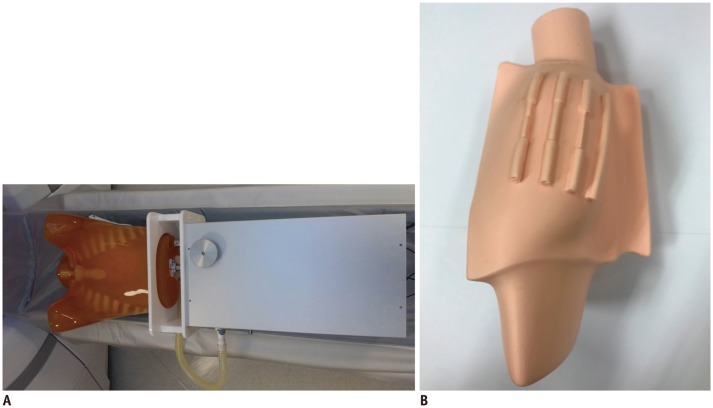
An anthropomorphic dynamic heart phantom (PH-48; Kyoto Kagaku Corporation, Kyoto, Japan) was used to simulate different HRs. This phantom consists of a chest phantom, diaphragm, simulated heart, and mechanical system. Four coronary arteries with no stenosis (4 mm in diameter) or variable stenosis degrees (25% stenosis [3 mm], 50% stenosis [2 mm], and 75% stenosis [1 mm]) were attached on the heart phantom (Fig. 1). This dynamic heart phantom was controlled by a tablet personal computer, which enabled selection of variable HRs, ejection fraction, and stroke volume. The ejection fraction was set at 60% and stroke volume, at 70 mL.
CT Scanning Protocols
All CT images were acquired using 256-detector row CT (Revolution CT; GE Healthcare, Waukesha, WI, USA). First, we scanned the cardiac phantom at a static condition to confirm the lumen size and the degree of stenosis in the simulated coronary arteries. Then, we scanned the phantom at eight simulated HRs (50–120 bpm with 10-bpm increments) once each. We used the prospectively electrocardiogram-triggered axial scan during 20–80% of the R-R interval, with a padding of 80 ms for MCA (Snapshot Freeze; GE Healthcare). Other scanning parameters were a tube voltage of 100 kVp, tube current of 228 mA, scan range of 160 mm, and gantry rotation time of 0.28 s/rot. For all HRs, data at 45% of the R-R interval were selected for reconstruction because data at this interval show minimal motion artifacts. The reconstruction interval/slice thickness, weight of the iterative reconstruction (adaptive statistical iterative reconstruction-V), reconstruction matrix, and reconstruction algorithm were 0.625 mm/0.625 mm, 50%, 512 × 512, and standard, respectively. To evaluate the effect of MCA, we reconstructed both images using conventional reconstruction and motion-correction reconstruction for all HRs.
Image Analysis of the Coronary Arteries
The reconstructed images were sent to a dedicated work station for image analysis (Advantage Workstation 4.6; GE Healthcare). Images were displayed at a window width of 800 HU and a window level of 100 HU; however, the reviewers were allowed to modify the window width and level for image quality analysis. Image analysis for coronary artery image quality and measurement accuracy was performed by two independent, blinded radiologists who had 10 and 9 years of experience in cardiothoracic imaging, respectively. The average values of the measurements were used for statistical analysis for image quality and measurement accuracy analysis.
Image Quality Analysis
Axial and curved multiplanar reformatted images of the coronary artery were used for subjective analysis of the coronary artery image quality. Image quality was graded using a four-point scale for each level as follows: 1, excellent (no motion artifact); 2, good (minor blurring artifact); 3, fair (moderate blurring artifact); and 4, poor (significant blurring or doubled appearance of structure) (7). Grade 4 was considered to provide non-diagnostic image quality.
Measurement Accuracy
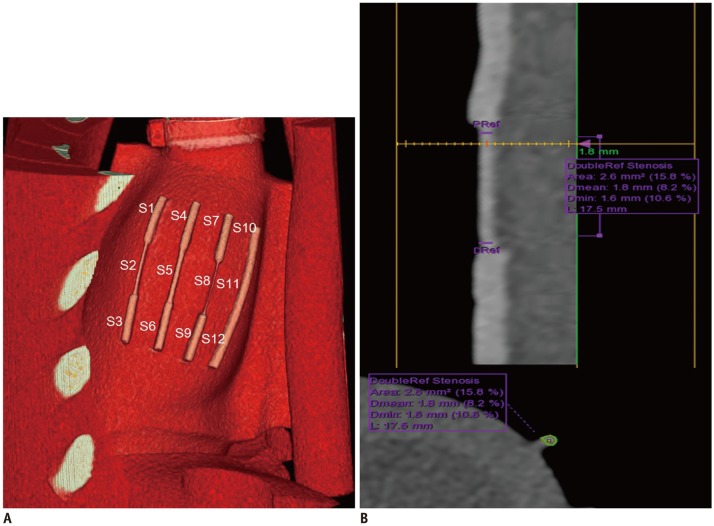
Measurement accuracy was determined using the measurement errors of the minimal luminal diameter (MLD) and minimal luminal area (MLA). Using the dedicated work station, the MLD and MLA in the 12 segments were semi-automatically measured (Fig. 2). The MLD and MLA of each segment were compared with those corresponding to the motion-free segment as a reference, and the measurement error was calculated using the following equation (8910):
Measurement error (%) =

The measurement errors of the MLD and MLA were compared for all segments at rest and eight stimulated HRs.
Radiation Dose Analysis
The effective radiation dose associated with the CT examination was calculated by multiplying the dose-length product (DLP) by a chest-specific conversion coefficient (k = 0.014 mSv·mGy−1·cm−1), as described by the European Guidelines for Multislice Computed Tomography (11).
Statistical Analysis
Statistical analysis was performed using PASW Statistics software (ver. 18.0; SPSS Inc., Chicago, IL, USA). Continuous variables were expressed as means ± standard deviations and categorical data, as percentages. Inter-observer reproducibility was calculated using the intra-class correlation coefficient (ICC), where ICCs less than 0.50, between 0.50 and 0.75, between 0.75 and 0.90, and greater than 0.90 are indicative of poor, moderate, good, and excellent reliabilities, respectively (12).
The Shapiro-Wilk test was used to assess the normality of continuous variables. To compare the image quality and measurement errors among the eight different HRs, the Kruskal-Wallis test was followed by pair-wise comparisons using the Mann-Whitney test because the raw data were non-normally distributed. The Bonferroni correction, which utilized a stricter p value of less than 0.002, was used to evaluate differences in the image quality and measurement errors among the eight HRs. To compare image quality and measurement error between conventional algorithm (CA) and MCA, normally distributed data were tested using a paired Student's t test and nonparametric distributed data were tested using a Wilcoxon signed-rank test. A p value < 0.05 was considered to indicate statistical significance.
RESULTS
Image Quality Improvement by MCA under Different HRs
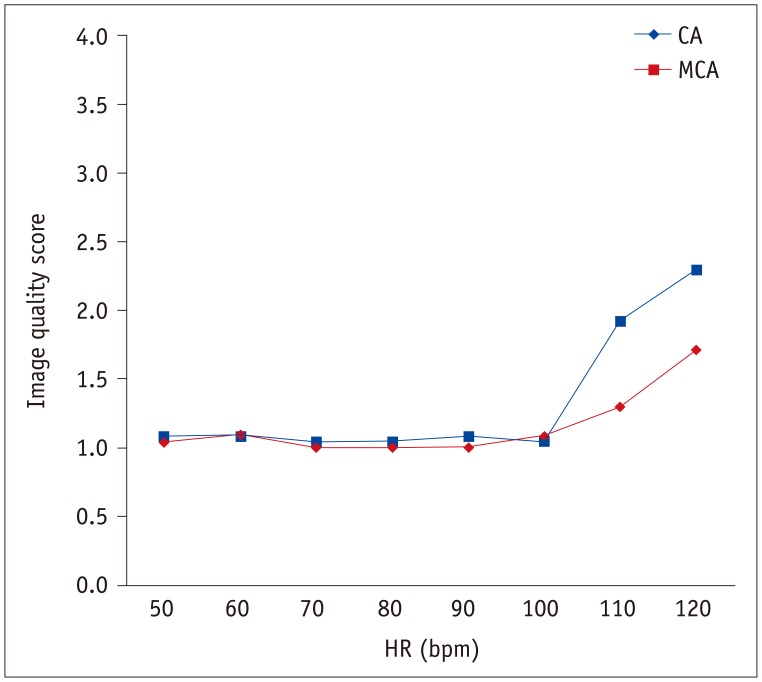
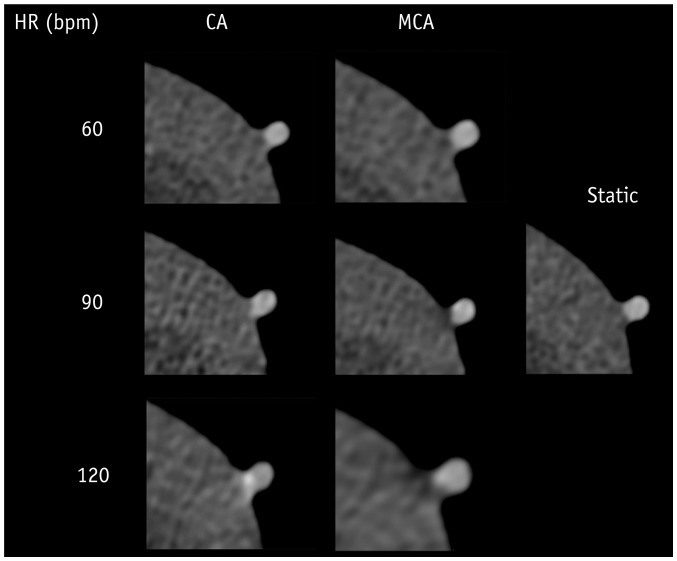
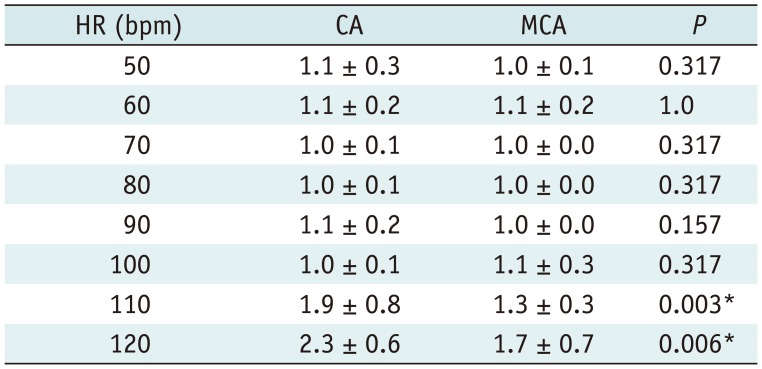
There was good inter-observer reproducibility for subjective image quality scoring (ICC = 0.809). Table 1 and Figure 3 show the mean image quality scores of CT images reconstructed by CA and MCA. Image quality scores tended to decrease with higher HRs at 110 bpm and 120 bpm. The Kruskal-Wallis test followed by pair-wise comparison using the Mann-Whitney test and Bonferroni correction showed that the image quality score at 120 bpm was significantly higher than those at 50–110 bpm (all p values, < 0.001). At 50–100 bpm, both reconstruction algorithms achieved similar image quality scores. At 110 bpm (1.9 ± 0.8 for CA, 1.3 ± 0.3 for MCA; p = 0.003) and 120 bpm (2.3 ± 0.6 for CA, 1.7 ± 0.7 for MCA; p = 0.006), MCA achieved better image quality than did CA (Table 1). Using MCA, mean image quality score was improved for all coronary segments at 110 bpm (75% stenosis [3 for CA vs. 1.5 for MCA], 50% stenosis [1.5 for CA vs. 1 for MCA], 25% stenosis [2.5 for CA vs. 1.5 for MCA], no stenosis [1.9 for CA vs. 1.3 for MCA]) and at 120 bpm (50% stenosis [3 for CA vs. 2 for MCA], 25% stenosis [3 for CA vs. 2 for MCA], no stenosis [2.3 for CA vs. 1.7 for MCA]) except for coronary segments with 75% stenosis at 120 bpm (2 for CA vs. 2 for MCA). Figure 4 images reconstructed by CA and MCA at static condition, 60, 90, and 120 bpm also demonstrated reduced motion artifact, with a significant improvement at higher HR. The image interpretability of CA and MCA were 100% at all HRs.
Measurement Accuracy Improvement by MCA under Different HRs
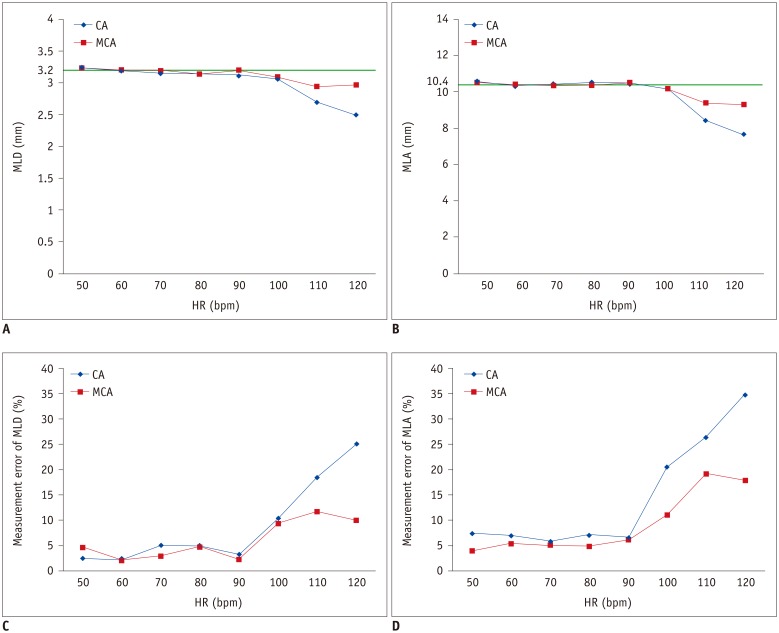
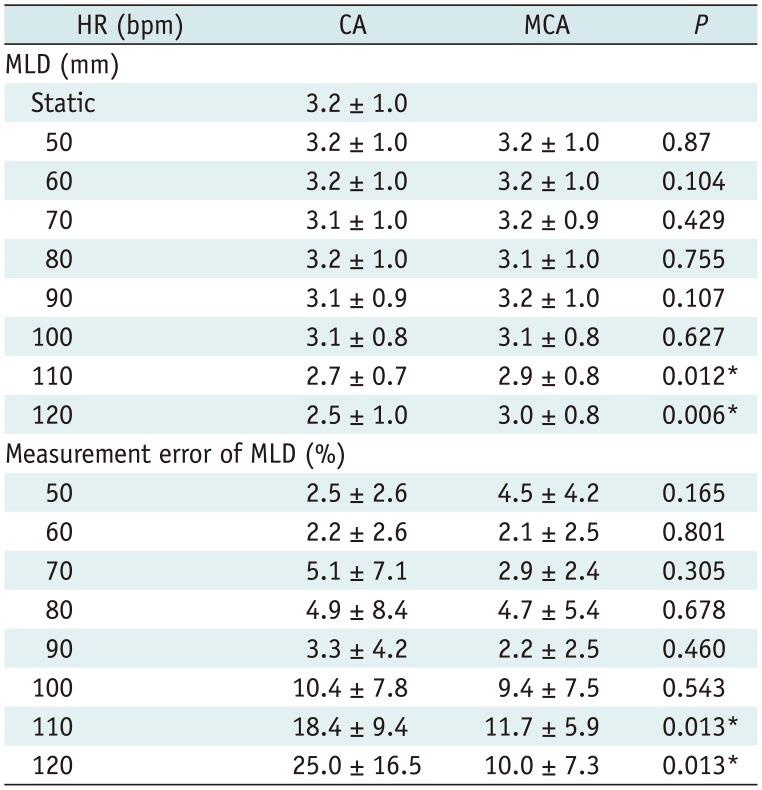
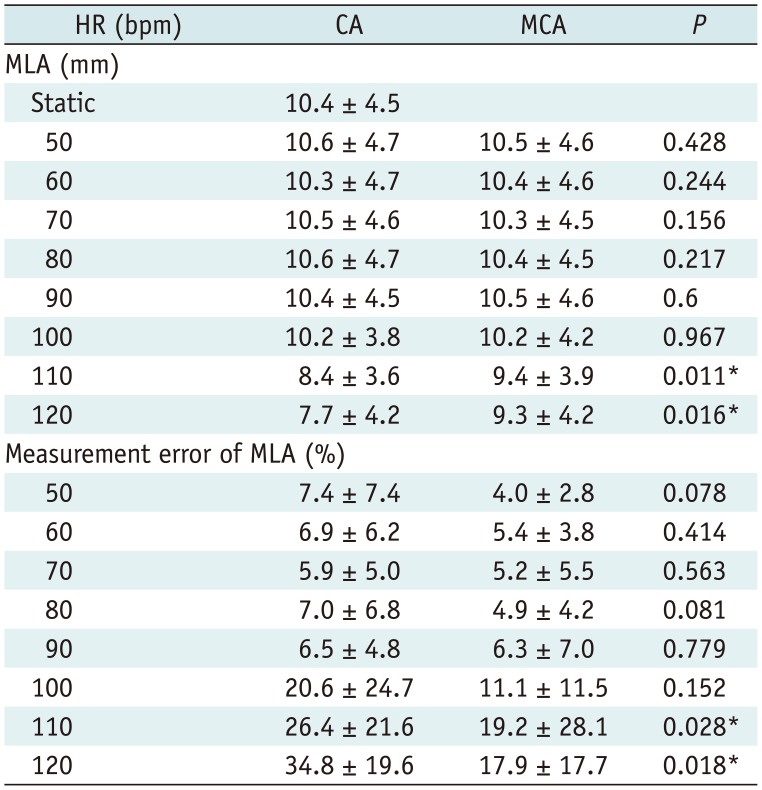
A good to excellent inter-observer reproducibility was observed for MLD (ICC = 0.76) and MLA (ICC = 0.973). Figure 5 shows the MLD, MLA, and their measurement errors. The MLD and MLA of both CA and MCA decreased with higher HRs, while the measurement errors of both CA and MCA increased with higher HRs especially at 110 bpm and 120 bpm. Tables 2 and 3 show that MCA could significantly improve the measurement errors of the MLD and MLA at 110 bpm (measurement error of the MLD, 18.4 ± 9.4% for CA vs. 11.7 ± 5.9% for MCA, p = 0.013; measurement error of the MLA 26.4 ± 21.6% for CA vs. 19.2 ± 28.1% for MCA, p = 0.028) and 120 bpm (measurement error of the MLD, 25.0 ± 16.5% for CA vs. 10.0 ± 7.3% for MCA, p = 0.013; measurement error of MLA, 34.8 ± 19.6% for CA vs. 17.9 ± 17.7% for MCA, p = 0.018).
DISCUSSION
This phantom study confirms that 256-detector row CT yields an acceptable image quality of the coronary artery at HR ≤ 120 bpm. MCA significantly increased the image quality score and decreased the measurement error at a high HR.
Motion artifacts are a major factor that limits the image quality of heart CT. To reduce motion artifacts, beta-blocker use is recommended, in accordance with the Society of Cardiovascular Computed Tomography guidelines for performance of and image acquisition by coronary CT angiography (13). However, contraindications to beta-blocker use and lack of treatment response make it impossible to achieve target HRs in some patients. For this reason, several methods have been introduced to improve the diagnostic performance in patients with high HRs. They include the use of dual-source CT, wide-detector CT, increased gantry rotation speed, and image reconstruction during the optimal phase of the cardiac cycle (141516). A recently developed MCA can further correct the motion artifact by utilizing both coronary artery path and velocity from adjacent cardiac phases in a single cardiac cycle (3).
Prior studies have documented beneficial effects of MCA in terms of image quality and diagnostic accuracy using a pulsating coronary phantom (Mocomo; Fuyo Corp, Tokyo, Japan) (817). Cho et al. (8) demonstrated that the coronary artery image quality and diagnostic accuracy (i.e., measurement errors of the MLA and MLD) improved on using MCA at high HRs (i.e., 80 bpm and 100 bpm), although there was no benefit at low HRs (i.e., 60 bpm). Xing et al. (17) also showed that the coronary artery image quality improved on using MCA at 70–100 bpm (10-bpm interval) on monochromatic levels of 50, 60, and 70 keV in their phantom study using dual-energy spectral CT. Their results have similar trends to our results. However, they used a 64-slice single-source dual-energy CT scanner, and their maximum HR was set at 100 bpm.
Our phantom study used 256-detector row CT with a single heartbeat acquisition. Therefore, the mean effective radiation dose of 0.8 mSv in this study was lower than those of previous studies that evaluated the effect of MCA using 64-slice CT (451819). Liang et al. (6) evaluated the effect of MCA on image quality and diagnostic accuracy in patients with high HRs using 256-detector row multi-detector CT. However, the effect of HR on motion correction was not analyzed. Thus, the advantage of our study is that MCA improves the HR-dependent image quality and measurement accuracy using anthropomorphic dynamic heart phantom and 256-detector row CT scanner.
This study has several limitations. First, an anthropomorphic phantom represents a surrogate for actual situations only; thus, the results need to be validated in in vivo studies. However, we could avoid the confounders of unexpected arrhythmia, changing HRs due to contrast medium injection, vagal tone during breath-hold, or anxiety because the HRs in our phantom study were well controlled. Second, we evaluated the effect on the image quality and measurement accuracy in a regular heartbeat simulation setting. The effect of MCA in an arrhythmic setting remains to be established. Third, we could not analyze the effect of MCA on subjective image quality and measurement errors of the MLD and MLA according to different stenotic degree using statistical analysis because of small sample size. Finally, we could not evaluate the influence of plaque characteristics on motion correction because our heart phantom has stenotic coronary arteries without a plaque. Further investigation with larger sample size is needed to evaluate the effect of MCA according to stenotic degree and plaque type.
In conclusion, MCA can improve the coronary artery image quality and measurement accuracy at high HRs using an anthropomorphic dynamic heart phantom and 256-detector row CT scanner. Prospective clinical trials should aim at establishing and validating our results in the clinical population setting.
 XML Download