

 PDF
PDF ePub
ePub Citation
 Print
Print


INTRODUCTION
Quantitative imaging in the medical field has been rapidly developing because of advances in computational methods and technologies. However, accuracy and reproducibility are essential for implementing quantitative imaging in clinical practice, and the technical parameters in imaging protocols should be carefully determined.
In CT, the reconstruction kernel is an important technical parameter, and kernel selection involves a trade-off between spatial resolution and image noise (1) because sharper kernels increase spatial resolution and image noise. Reconstruction kernel selection also depends on the structure being evaluated, e.g., while a sharp kernel is appropriate for the lung, a smooth kernel is better for the mediastinum. Because kernel selection affects quantitative analysis (234), CT images with different reconstruction kernels would be necessary for various diagnostic or quantitative purposes.
Although raw CT data are required to reconstruct CT images with different kernels, the data are usually not stored owing to their large file sizes and space limitations. On the other hand, multiple reconstructions with different kernels for all cases will increase the number of images that are generated, transmitted, and stored. These limitations in CT reconstruction have led to concerns regarding the comparability of quantitative results among different reconstruction kernels (2), and this problem is particularly evident in retrospective or longitudinal studies that cannot control technical parameters. Therefore, attempts to develop post-processing techniques that permit interconversion among CT images obtained with different kernels have been made (5678). Gallardo-Estrella et al. (9) demonstrated that normalization of CT data reconstructed with different kernels reduces variation in emphysema quantification. However, the emphysema index (EI), which is derived from CT data reconstructed using the reference kernel (Siemens b31f), was altered after normalization, implying that the normalized EI does not exactly correspond to the EI obtained in original CT.
Kim et al. (10) recently demonstrated that convolutional neural networks (CNNs) can be taught differences between high- and low-resolution images (residual images) and that CNNs can be used to accurately and rapidly convert low-resolution images to high-resolution images. We hypothesized that this is also applicable for interconverting CT images obtained using different kernels because CT images between different kernels share most information. As EI is an established and widely accepted predictor for survival and acute exacerbation (1112) as well as disease status in patients with chronic obstructive lung disease (13), it was selected as a performance measure after kernel conversion in our study. Thus, the purpose of this study was to develop and validate a CNN architecture to convert CT images reconstructed with one kernel to images with different reconstruction kernels without using a sinogram.
MATERIALS AND METHODS
This retrospective study was approved by the Institutional Review Board, which waived the requirement for informed consent from patients (approval number: 2017-0951).
Datasets
The first dataset included CT images from 10 patients (five men and five women; mean age, 63.0 ± 8.6 years), obtained using Somatom Definition Edge (Siemens Healthineers, Forchheim, Germany) in May 2016. This dataset was initially used for developing an optimal protocol for quantification in patients with chronic obstructive pulmonary disease. CT images were reconstructed using the B10f, B30f, B50f, and B70f kernels, from smooth to sharp, according to the Siemens naming convention. This dataset was used to develop a kernel conversion algorithm and to evaluate its performance (referred to as Dataset 1).
The second dataset consisted of 300 CT scans obtained using Somatom Definition Edge from April to June 2017. The second dataset included two series of CT images reconstructed with the B30f and B50f kernels for the mediastinum and lung, respectively. We randomly selected 20 examinations for training another CNN model with an architecture identical to that of the model in Dataset 1. To validate this model for clinical quantitative use, we used EI, and 30 chest CT scans among the remaining CT images in Dataset 2 that showed emphysema on visual assessment were selected by a chest radiologist.
Development of CNN Architecture
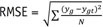
The proposed CNN architecture is shown in Figure 1 and consists of six convolutional layers with a 3 × 3 kernel size. Each layer, except the last one, has 64 filter banks that enabled the extraction of 64 distinctive feature maps. To maintain original resolution throughout the network, we excluded a pooling layer in the CNN structure. A rectified linear unit was used as an activation function at the end of each convolutional layer. As we applied the concept of residuals, the proposed CNN was trained to learn the difference between the target and input images.
Data preprocessing involved deconstruction of three-dimensional CT volumes to multiple two-dimensional images. We used the original matrix size of 512 × 512 for both input and output images. For each distinct reconstruction kernel pair, we also generated a residual image by subtracting the target image from the input image.
The prepared image database was fed into the deep learning processing server with the Linux operating system (Ubuntu 14.04; Canonical, London, England) along with the Caffe deep learning framework (http://caffe.berkeleyvision.org; Berkeley Vision and Learning Center, Berkeley, CA, USA) and CUDA 8.0/cuDNN 5.1 dependencies (Nvidia Corporation, Santa Clara, CA, USA) for graphics processing unit acceleration. The computing server had the Intel Xeon E5-2600 processor (Intel, Santa Clara, CA, USA), 64-GB RAM, and an Nvidia Titan X and two GeForce GTX 1080 graphics processing units.
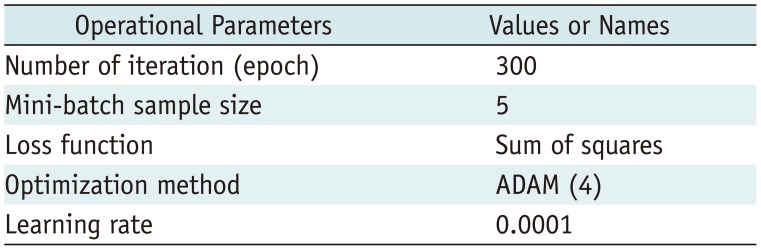
We divided Dataset 1 into six, two, and two cases for training, validation, and testing, respectively. The six training image sets included 1990 images, and the validation set contained 679 images. Operational parameters for training are presented in Table 1.
Dataset 1 contains twelve distinctive conversion pairs and we developed 12 CNN models, corresponding to each of the 12 pairs, to obtain images with the desired CT reconstruction kernels from the given image(s). For Dataset 2, separate CNN models were prepared using the [B30f → B50f] and [B50f → B30f] kernels.
Testing CNN Architecture
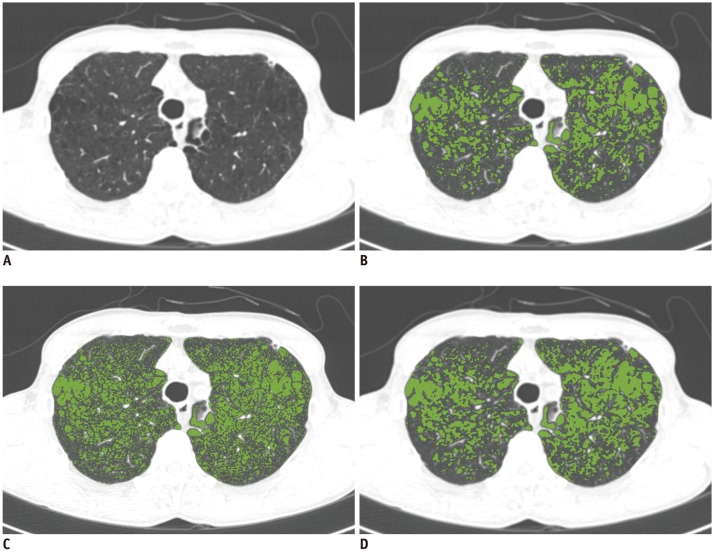
Two image sets (Test 1 and Test 2) from Dataset 1 that included 631 CT images were used to test the performance of the proposed CNN. We calculated the root mean square error (RMSE) values for each conversion pair as a quantitative measurement using the following formula:
Where, yg is the voxel value of the CT volume generated using the proposed CNN and ygt is the voxel value of the target CT volume.
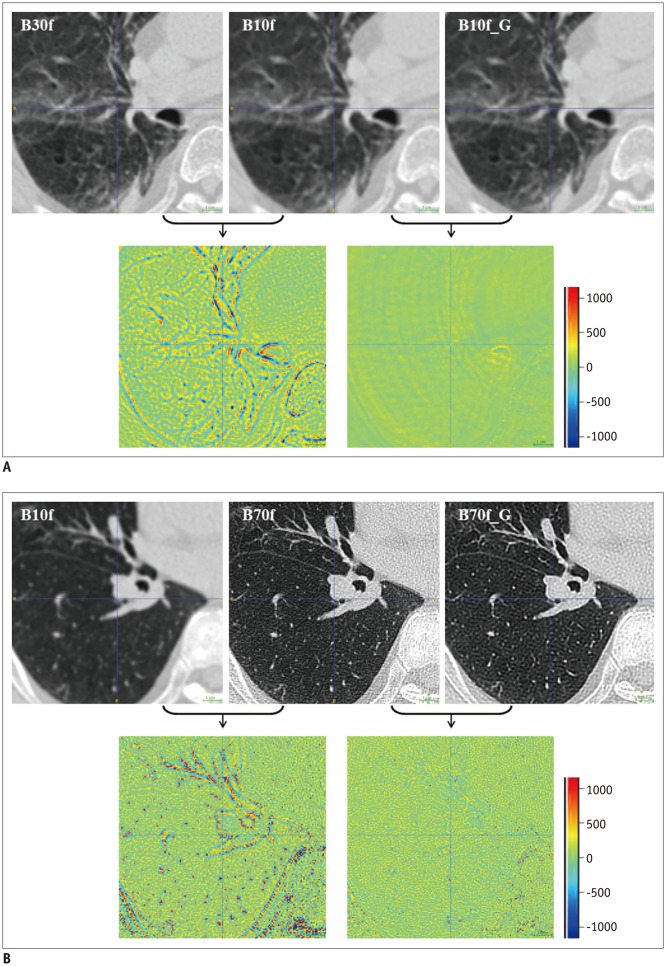
In Dataset 2, we quantified the EI on CT images reconstructed with B30f, B50f, converted B30f, and converted B50f using a commercial software (Aview, Coreline Soft, Seoul, Korea) as well as RMSE. The quantified EIs on B50f and converted B30f images were compared with the EI from B30f images, because quantification of EI on CT images acquired using B30f is a widely acceptable approach (14).
CT Acquisition
CT images were acquired at full inspiration in the supine position without contrast enhancement, and the acquisition protocol was as follows: 120 kVp; 100–200 mAs; 1-mm slice thickness; 1-mm intervals; and collimation of 0.75 mm.
Statistical Analysis
All values are expressed as mean ± standard deviation. For continuous variables, the normality of distribution was assessed using the Kolmogorov-Smirnov test. In Dataset 2, Bland-Altman plots were used to assess differences between EI with B30f and that with other reconstruction kernels (15). EI comparisons among different kernels were performed using the Wilcoxon signed-rank test. All statistical analyses were performed using MedCalc, v.17.8 (MedCalc Software, Mariakerke, Belgium). P values of < 0.05 were considered significant.
RESULTS
Performance in Dataset 1
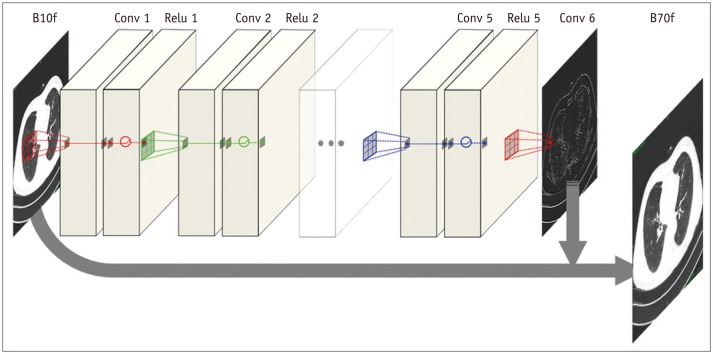
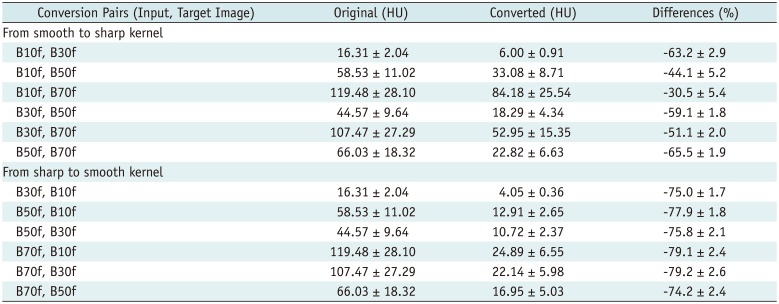
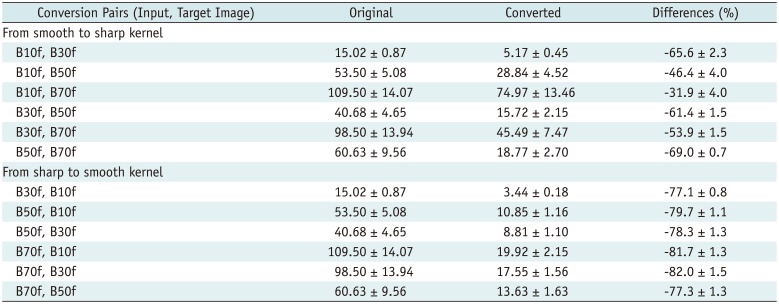
Performance test results of the proposed CNNs for each conversion pair in the two image sets are shown in Tables 2 and 3, respectively. The mean reduction in RMSE for the converted images was 64.4 ± 16.1% (range, 29.5–79.4%) in Test 1 and 67.0 ± 16.1% (range, 31.5–82.2%) in Test 2. In pooled data for Tests 1 and 2, the converted images showed a substantial reduction in RMSE values (mean reduction, 65.7 ± 15.8%) for all conversion pairs except images converted from B10f to B70f in Test 1, where the decrease in RMSE values was much lower at 29.5% compared with those in the original images.
Our model demonstrated good conversion ability from smooth to sharp kernels, with a mean RMSE reduction of 51.9% in Test 1 and 54.6% in Test 2, and from sharp to smooth kernels, with a mean RMSE reduction of 77.0% in Test 1 and 79.4% in Test 2.
Among the kernel conversion pairs used, B30f to B10f in Test 2 yielded the lowest RMSE (3.44 ± 0.18 Hounsfield unit [HU]), whereas B10f to B70f in Test 1 showed the highest RMSE (84.18 ± 25.5 HU). RMSE values tended to increase during conversion from smooth to sharp kernels and between much different kernels (Fig. 2). For all conversion pairs, RMSE values were lower in Test 2 than in Test 1. This CNN could rapidly generate conversion results at a rate of 0.065 s/slice and took approximately 20 seconds for converting one entire volume.
Performance in Dataset 2
The reduction in RMSE was −59.6 ± 5.5% between (B30f, B50f) and (converted B50f, B50f) and −78.7 ± 1.8% between (B50f, B30f) and (converted B30f, B30f).
The mean EIs from B30f, B50f, converted B30f, and converted B50f images were 5.4 ± 7.2%, 15.3 ± 7.2%, 5.9 ± 7.3%, and 16.8 ± 7.5%, respectively (Fig. 3). Kolmogorov-Smirnov test revealed that the EI distributions in B30f and converted B30f images were not normal (p = 0.003 and p = 0.012, respectively), whereas those in B50f and converted B50f images were normal (p = 0.059 and p = 0.090, respectively). Comparisons between B30f and other kernels, namely B50f, converted B30f, and converted B50f, showed significant differences (p < 0.001, p = 0.001, and p < 0.001, respectively).
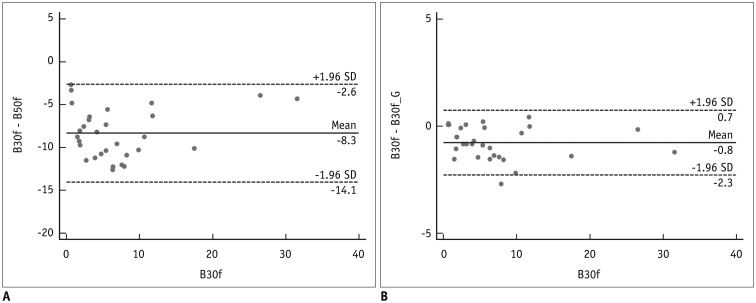
Bland-Altman plots showed that the 95% limits of agreement between B30f and other kernels (B50f and converted B30f) ranged from −14.1% to −2.6% (mean, −8.3%) and from −2.3% to 0.7% (mean, −0.8%), respectively (Fig. 4).
DISCUSSION
In our study, we described a new CNN method to convert CT images from different kernels and demonstrated an adequate model performance during clinical use by comparing EI quantifications between original and converted images.
The necessity of CT image conversion among different reconstruction kernels has remained consistent, because controlling the protocols used for image acquisition is not always possible. Several studies have attempted to develop a convenient and universal method for image conversion among different reconstruction kernels. Schaller et al. (1) introduced a method to simulate smoother kernels by using a Gaussian filter to approximate the ratio between smooth and sharp kernels. Ohkubo et al. (8) reported an advanced filtering method to create CT images with different kernels. However, these studies did not evaluate the suitability of the converted images for quantification, and these methods require additional CT scans for calculating conversion parameters such as the point-spread function. Gallardo-Estrella et al. (9) demonstrated that normalization of CT data reconstructed using different kernels reduced variation during emphysema quantification. They used energy coefficients, which were obtained by analyzing the energy in different frequency bands in scans with the reference kernel. Although the method did not require additional CT, it is difficult to directly predict normalized EI even in reference images.
Our proposed CNN-based method of kernel conversion has several advantages over the other published methods described above (589). First, our model generated converted CT images from any reconstruction kernel using an identical architecture. We presented data from 12 pairs of kernel conversions using the same CNN model and showed that changing the input data according to a desired kernel alone was sufficient for obtaining target images, making our proposed CNN-based model easily adaptable and expandable. The method used here could feasibly be adapted to other CT applications such as noise reduction in low-dose CT and vendor-based differences in images (16).
Second, our model uses the original CT resolution (512 × 512) throughout the conversion process with an end-to-end way. Many other CNN-based studies used pre-trained networks originally trained using data from ImageNet, and it was necessary to reduce the image size to 256 × 256 and lower 12-bit HU values to 8-bit red, green, and blue values. However, we aimed to use the original size of CT images and the complete range of attenuation values (HU). To achieve these goals, we devised a simpler CNN model and decomposed the three-dimensional scans into two-dimensional slices to compensate for limitations owing to small dataset size. This scheme was performed in the end-to-end manner and required no additional calculation of parameters. This can enhance the robustness of the proposed scheme.
Third, we incorporated residual learning in the model, i.e., for converting B10f to B70f images, B10f images are input to a specific CNN model and residual images are generated as the output. The final image is obtained by adding residual images to the input. This scheme improved performance and reduced the training time of our CNN models because the training time and RMSE values for conversion from B10f to B70f were 4.5 hours and 75.0 HU, respectively, with 300 iterations. However, without residual learning, the performance was > 3 times lower (RMSE, 250.7 HU), and we could not achieve comparable results even with a 10-fold increase in training time. These observations attest to the effectiveness of residual learning in the proposed method.
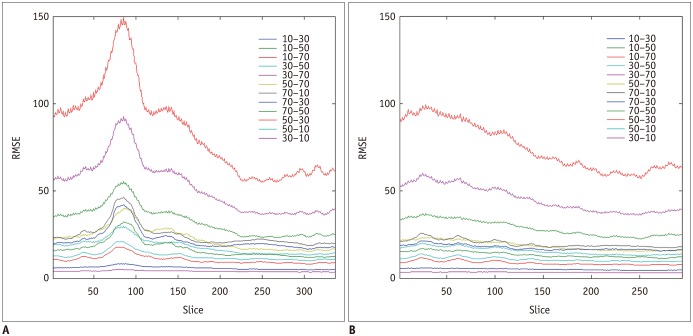
Interestingly, there were differences in the RMSE along the z direction (Fig. 5). We found a trend of an increase from the upper to lower thorax. This might be caused by several reasons. First, the upper part is more stable than the lower part from breathing. Second, the spatial variability of abdominal organs could make the training the CNN models more difficult.
Kernel conversion from B50f to B30f showed considerably reduced agreement for EI quantification. Gallardo-Estrella et al. (9) revealed that bias and limits of agreement decreased from 7.7% (2.4%, 12.9%) to 0.3% (−1.0%, 1.5%) after normalization of B45f to B31f. Although we reported slightly wider agreement values compared with Gallardo-Estrella et al. (9), we believe that this could be attributed to differences in the study population and reconstruction kernel used between two studies. In addition to the advantages mentioned above, we believe that our method would substantially improve along with advances in deep learning techniques.
Nonetheless, our study has several limitations. First, only a small sample was included in our study. As each image was used for CNN development, validation, and testing, we believe that the sample was sufficient in this regard. In EI measurement, our study population did not represent the entire spectrum of patients with varying degrees of emphysema, owing to the rarity of patients with severe emphysema. However, Bland-Altman plots demonstrated that measurement differences showed no association with the extent of emphysema. Next, CT quantification was performed using only one CT protocol and CT scanner type. Therefore, an external validation under different conditions is necessary to test the wide applicability of our CNN model.
In conclusion, CT kernel conversion based on CNNs showed adequate performance with high accuracy and speed and offered potential for clinical applications.
 XML Download