

 PDF
PDF ePub
ePub Citation
 Print
Print


INTRODUCTION
Fat quantification is often very useful in various clinical settings such as assessment of hepatic steatosis, detection of pancreatic fat infiltration in obese patients, and evaluation of bone marrow lesions to exclude malignancy (1234). Many studies have attempted to use various techniques to quantify local fat amounts by noninvasive techniques. Among these, single-voxel magnetic resonance spectroscopy (MRS) is generally considered the clinical gold standard noninvasive technique for localized in vivo fat quantification (567891011). However, MRS is technically demanding, time-consuming, and subject to sampling errors associated with a low spatial resolution (481213). Therefore, in clinical practice, various fat quantification techniques based on magnetic resonance imaging (MRI) have been attempted as alternatives.
Recently, chemical shift-encoding water-fat imaging, called the Dixon method, has been applied for rapid measurement of fat content with high spatial resolution (38). Many Dixon variants with two or more echo times have been developed to allow more consistent separation of fat and water signals after consideration of many confounding factors, including main magnetic field inhomogeneity effects, the presence of multiple peaks in the fat spectrum, T2* effects, T1 effects, eddy current effects, and the presence of susceptibility-induced fat resonance shifts (81314). A modified Dixon method is a Dixon variant that allows two echo times in-phase and out-of-phase between the water and fat signals to be flexibly used (1516). This new Dixon method has been validated against the gold standard, single-voxel proton (1H)-MRS, for liver and pancreatic fat assessment, but not for vertebral bone marrow fat assessment (217). It is important to validate this new method in measurements of bone marrow fat for the following reasons: fat fraction (FF) for organ fat (i.e., the liver and pancreas) is usually lower than 50% and usually homogeneously distributed. Conversely, bone marrow fat can show a more wide range of fat-signal fractions from 0% to 80%, and may be distributed heterogeneously (18). In addition, the presence of trabecular bones shortens the T2* of the surrounding water and fat components, necessitating some additional technical considerations in comparison with assessments of other organs (38141920). Validation for the vertebral bone marrow is especially important for clinical application, because it shows dynamic differences in comparison with the bone marrow of any other part, and vertebral MRI is frequently performed for a wide variety of clinical reasons. Only a few studies have been performed before to investigate the relationship of vertebral bone marrow FF measurements between chemical shift-encoding water-fat imaging and single-voxel 1H-MRS, and none of them have used the novel six-echo modified Dixon sequence (6-echo m-Dixon) image-based method (8182021).
Therefore, the purpose of this study was to compare FF measurements in the vertebral bone marrow derived from the 6-echo m-Dixon method with single-voxel 1H-MRS as the standard of reference.
MATERIALS AND METHODS
Patients and Measurement Targets
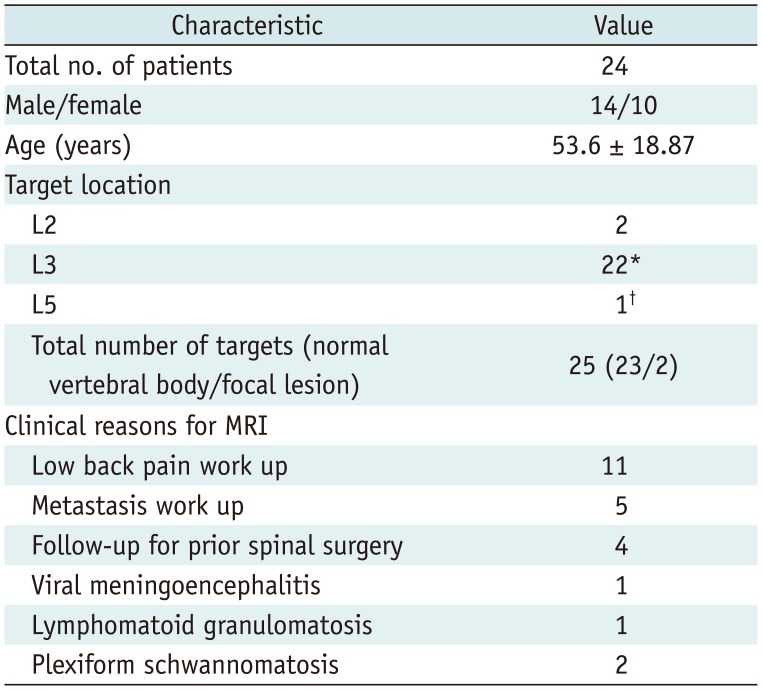
This prospective study was approved by our Institutional Review Board (H-1411-071-626). Between January 2015 and May 2016, 24 patients (14 men and 10 women; mean age, 53.6 years; age range, 22–86 years) were recruited consecutively in the study. They fulfilled the following inclusion criteria: 1) patients aged > 19 years; 2) patients who were referred to lumbar spine MRI; and 3) patients who provided informed and written consent prior to MRI. Subjects were referred for MRI for the following clinical reasons: low back pain work-up (n = 11), metastasis work-up (n = 5), follow-up for prior spinal surgery (n = 4), follow-up for benign neurologic diseases (viral meningoencephalitis [n = 1], lymphomatoid granulomatosis [n = 1], and plexiform schwannomatosis [n = 2]). Our primary target for measurement was the normal L3 vertebral body, because it is the location that is frequently used to measure bone marrow fat (1822). One of the four patients who had previously undergone spinal surgery underwent metallic posterior instrumentation at the L3–5 level. Metallic artifacts induced by the instruments were limited below the superior endplate of the L3 vertebral body, so we analyzed the L2 vertebral body in the patient instead. Three patients had focal bone lesions in the lumbar spine: osteoporotic compression fracture on L3 (n = 1) and bone metastasis on L5 (n = 2). These focal bone lesions were also included for the measurement, in order to analyze a wide spectrum of FFs. In each of the three patients, a normal vertebral body (L2, L3, and L3, respectively) was measured in addition to an abnormal one with a focal bone lesion, resulting in total of 27 measurement targets. Among these, two lesions were excluded because their size was too small size to place a region-of-interest (ROI) for a focal bone lesion on the MRI (bone metastasis on L5 vertebral body, from lung cancer) or because of technical failure (i.e., too severe noise artifacts of the MRS spectrum on the normal L3 vertebral body). None of the patients had any contraindications for MRI acquisition, such as cardiac pacemaker implants or other metallic foreign body objects. Finally, 24 patients with 25 vertebral body segments were included in our study. The patient and target characteristics are summarized in Table 1.
MRI and 1H-MRS Acquisition
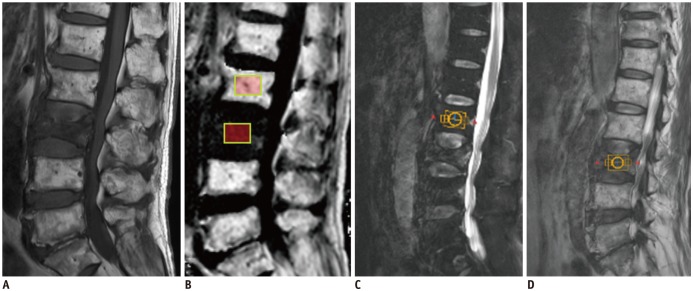
MRI was performed using a 3T MR scanner (Ingenia; Phillips Healthcare, Best, the Netherlands) with a 16-channel total spine array coil in the supine position with the spine along the symmetry axis of the coil system. Standard clinical MRI including the lumbar spine for individual clinical needs was performed, including sagittal turbo-spin echo T1- and T2-weighted imaging, as well as trans-axial T2-weighted fast spin echo sequence. Next, three-dimensional (3D) gradient-echo chemical shift-encoded images with a 6-echo m-Dixon; sagittal acquisition; repetition time (TR), 7.2 ms; echo time (TE), 1.21 ms; echo spacing, 1.1 ms; flip angle, 3°; slice thickness, 3 mm; interslice gap, 0 mm; matrix size, 192 × 171; field of view, 300 × 300 mm; imaging time, 50 seconds-allowing FF quantification were obtained. To avoid T1 saturation, a low excitation flip angle of 3° was applied. R2*(= 1/T2*) maps were estimated from the six-echo sequences and corrected for T2* effects, because trabecular bone shortens the T2* values of water and fatty components, inducing rapid decay of the measured gradient-echo signal with TE (814). A 7-peak spectral model with several lipid components was also used in the calculation of the FF map, which allows better modeling of heterogeneous fat distribution in the bone marrow (1923). After T2* correction, FF maps were automatically reconstructed by computing the FF value as the ratio of the mean fat signal with the sum of mean fat and water signals (Fig. 1A, B).
As a standard of reference, a point-resolved spectroscopy (PRESS) sequence was acquired. Using 3-plane standard clinical sequences, a radiologist with 7 years of experience in spinal MRI positioned a single spectroscopy voxel in the center of the target vertebral body, which was devoid of any detectable focal lesion (Fig. 1C). If there was a focal hypointense bone lesion in any vertebral segment on T1-weighted images, additional acquisition was performed for the focal bone lesion (Fig. 1D). The parameters were as follows: TR, 3000 ms; TE, 35 ms; acquired points, 2048; number of signals acquired, 2; volume of interest (VOI), 2 × 2 × 1.5 cm3; total scan time, 1 minute 42 seconds. The voxel size was kept the same for all subjects. Magnetic field inhomogeneity was corrected by adjusting the static gradient during the preparation phase. Iterative volume shimming was used with B0 off-center correction. The positioning of the spectroscopy voxels was saved as screenshots with other images in the workstation as a reference for positioning VOIs in the evaluation of the imaging-based FF measurements (Fig. 1C, D).
MRI and MRS Analysis
On the automatically reconstructed FF maps from 6-echo m-Dixon sequences, we drew a 2 × 1.5 cm2 rectangular ROI on the image of the sagittal slice centered on the normal target vertebral body or abnormal focal bone lesion, and the adjacent six bilateral para-median sagittal images, in order to best match the volumetric coverage of the spectroscopy voxel (Fig. 1B). We next calculated the mean of all the seven values (Dixon MR-based fat fraction [FFdix]) obtained from the FF map. All imaging-based measurements on the workstation were independently performed by two radiologists with 3 and 7 years of experience in spinal MRI, respectively, who were blinded to the spectroscopic results. Both used Picture Archiving and Communication System workstations (INFINITT; Infinitt Healthcare, Seoul, Korea) after training on ROI placement using sample image sets. The averages of the values from both readers were used for further analysis.
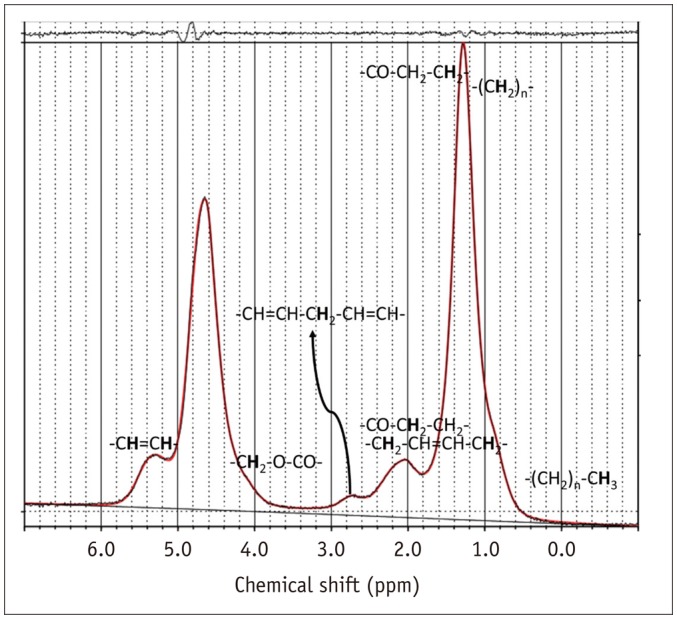
The spectroscopy data were processed using a commercial spectroscopy tool (LCModel version 6.3-1K; LCModel Inc., Oakville, Canada), which involves post-processing and quantifications, including noise filtering, apodization, baseline, and phase correction, signal fitting of the peaks within the acquired spectra, and integration to find the area under each spectral peak of interest. The software yielded peak areas for the fat at 0.90, 1.30, 1.59, 2.00, 2.25, 2.77, 4.20, and 5.31 ppm and water peaks at 4.65 ppm (Fig. 2). Spectroscopy-based FF (FFmrs) was calculated as the ratio of all the fat peak areas to the sum of all the fat peak and water peak areas (8).
Statistical Analysis
All continuous values are reported as means ± standard deviation. The Kolmogorov-Smirnov test indicated that the age and all FF values were normal. Comparisons of age and FF values were made between men and women using Student t test. Correlations between age and FF values were assessed by Pearson's correlation analysis; two focal lesions that did not follow the normal aging process of bone marrow were excluded in these correlation assessments. Intraclass correlation coefficient (ICC) values were used to test for the agreement between FFdix measurements of both readers. Correlations between FFdix and FFmrs measurements were assessed using Pearson's correlation values. A paired t test was used to test for significant differences between FFdix and FFmrs. The 95% limits of agreement between the two measurements were obtained using Bland-Altman analysis. Additional subgroup analysis by age was performed by dividing the patients into three age groups (younger than 40 years, 41–60 years, and older than 60 years). Pearson's correlation and Bland-Altman analysis were performed for each age subgroup to investigate any significant differences in correlation and/or agreement between FFdix and FFmrs according to age.
P values less than 0.05 were considered statistically significant. An ICC value of 0 indicated poor agreement, whereas 0.01–0.20 indicated slight agreement, 0.21–0.40 indicated fair agreement, 0.41–0.60 indicated moderate agreement, 0.61–0.80 indicated good agreement, and 0.81–1.00 indicated excellent agreement (4). All statistical analyses were performed with commercially available software (SPSS version 22; IBM Corp., Armonk, NY, USA and MedCalc version 16.2.1; MedCalc Software, Ostend, Belgium).
RESULTS
Measurements were performed within the normal marrow of the L2 (n = 2) or L3 (n = 21) vertebral body. In two patients, additional measurements were obtained within the acute compression fracture of the L3 vertebral body or bone metastasis of the L5 vertebral body.
Interobserver agreement in quantitative MRI measurements was excellent, with an ICC of 0.999 (p < 0.001). The mean FFmrs and FFdix of the total targets were 55.7 ± 21.0% (range, 1.7–88.7%) and 52.4 ± 19.3% (range, 8.4–81.1%), respectively. There was no significant difference in age (p = 0.814), FFmrs (p = 0.487), and FFdix (p = 0.307) between men and women. In the 23 normal marrow targets, there were significant correlations between age and FFmrs (r = 0.73, p < 0.001), and between age and FFdix (r = 0.80, p < 0.001).
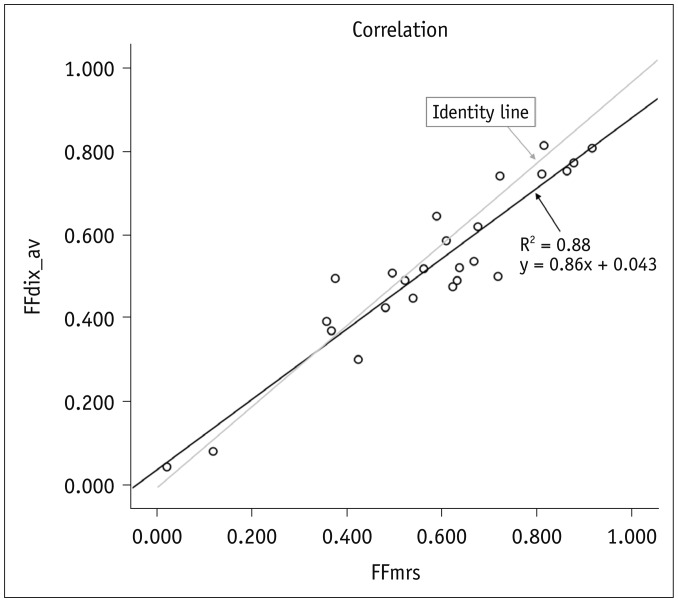
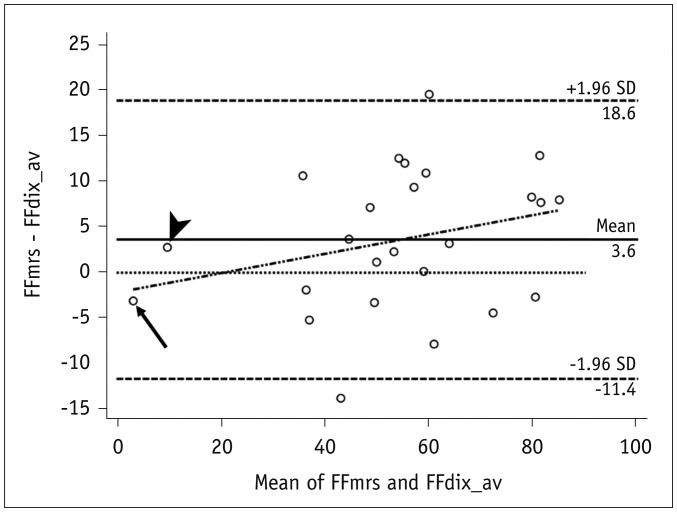
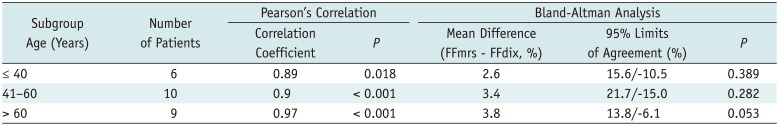
There was a significant linear correlation between FFmrs and FFdix (R2 = 0.88, p < 0.001) (Fig. 3). On average, the FFdix was slightly lower than the FFmrs (p = 0.028) with a mean measurement bias of 3% and limits of agreement ranging from −11% to 18% in the corresponding Bland-Altman analysis (Fig. 4). The Bland-Altman plot revealed a slight but systematic error, which showed slight overestimation of small FF (< 20%) and underestimation of high FF (> 20%) (Fig. 4). Subgroup analysis showed no remarkable age dependence in correlation and agreement between FFmrs and FFdix, all showing significant correlations without significant mean differences (Table 2).
DISCUSSION
Our study demonstrated that the 6-echo m-Dixon with T2* correction correlates well with the 1H-MRS method for fat quantification in the vertebral bone marrow. On average, the 6-echo m-Dixon with T2* correction yielded lower FF values in the vertebral body when compared to 1H-MRS (p = 0.04). Thus, the 6-echo m-Dixon with T2* correction can be a valuable tool for rapid and accurate fat quantification in the vertebral bone marrow.
Generally, MR image-based fat quantification methods have several advantages over 1H-MRS. FFdix measurement does not require a high level of operator expertise in voxel prescription; thus, it can be a less time-consuming method. In addition, it provides an automatically reconstructed FF map as a quick and easy quantification tool even considering the heterogeneous distribution and spatial patterns of vertebral body fat (2).
Several studies have been conducted to validate MR image-based fat quantification methods in various in vivo settings over the past decades. Hu et al. (1) showed that a 3D imaging technique called Iterative Decomposition with Echo Asymmetry and Least squares estimation is a rapid breath-hold technique that can provide robust separation of fat-water signals and accurate estimation of FFs in the liver and pancreas. Livingstone et al. (2) demonstrated that the two-point modified Dixon method with flexible echo times exhibited a good correlation with 1H-MRS for assessment of FFs in the liver and pancreas. They reported that the modified Dixon method yielded consistently higher fat values by about 3–5% in both liver and pancreas when compared to 1H-MRS, which might be due to systematical overestimation by the algorithm used in their study and the absence of consideration for the T2* effect and the multiple peaks in the fat spectrum (2). For bone marrow fat quantification, there are additional challenging issues such as the heterogeneous fat distribution and presence of trabecular bones. However, early validation studies of the Dixon method demonstrated good correlations between MR image-based and MRS-based bone marrow fat measurements. Régis-Arnaud et al. (21) showed excellent correlation (R2 = 0.85) between the mean values of FF obtained with MRI and the spectroscopic values, although they did not consider many confounding factors that could influence the fat quantification, including the T2* effect and the presence of multiple peaks in the fat spectrum. Shen et al. (18) compared the two-point Dixon technique with T2* correction and 1H-MRS for measuring bone marrow fat in the L3 vertebra and showed good correlation between them (r = 0.78). They explained that the discrepancy between the methods was caused by the heterogeneous marrow fat distribution, partial volume effect, and miscalculations at approximately 45% fat content due to ambiguity of the dominant constituent (i.e., water or fat) (18). Karampinos et al. (820) showed a good equivalency between MR image-based and MRS-based FF after accounting for the effect of short T2* species for the bone marrow fat quantification in the femur and vertebra. They minimized the water-fat chemical shift displacement in single-voxel MRS localization by employing the MR spectra acquired with two different center frequencies on the main fat and water peaks, because chemical shift displacement effects can induce over- or underestimation of FF depending on the fat content distribution in the region surrounding the MRS voxel (820). They also emphasized the presence of the short T2* water species, because the area of the short T2* water species ends up being considered within the water peak area, inducing an underestimation of the MRS-based FF compared to the imaging-based FF (8). However, even in their study, the correlation coefficient decreased after considering the effect of short T2* species, suggesting the presence of additional unknown factors in consideration for the short T2* species (8).
Our study employed advanced Dixon method accounting for many confounding factors, but we did not take account the difference in T2 relaxation times between the water and fat components and the short T2* water species in MRS data processing. The short T2* effects would not bias our results because the PRESS applied in our study used a longer TE compared to the Stimulated Echo Acquisition Mode (STEAM) used in Karampinos' study, so the short T2* effect would have been small or negligible in the creation of MR signals in the MRS (24). However, the T2 decay effect would have affected our results by yielding the T2-weighted FF rather than the proton density FF (PDFF), independent of the effects of any confounding factors, because we employed a single-TE MRS measurement and did not use any T2 correction (2425). The T2-weighted FF usually shows higher values than PDFF, which may be one of reasons for the overestimation of MRS-based FF compared to FFdix in our study (25).
In contrast to the underestimation of the mean value of FFdix compared to MRS-based FF, the Bland-Altman plot showed a slight overestimation of the FFdix in the small FF range (< 20%). This result is quite similar to that reported in Livingstone's study (2) on pancreatic fat analysis, where pancreatic FF values obtained by m-Dixon tended to be larger than those obtained by 1H-MRS if the mean FF value was small. This could be associated with partial volume averaging artifacts due to the extremely small size of the lesions with the surrounding relatively high-FF marrow, and the noise-related bias caused by the extremely low fat content within the lesion (26). However only two measurement targets showed low FF (< 20%), and only one of them showed overestimation of FFdix. Further studies on a larger number of subjects with low FF are needed to confirm such trends of bias in our study.
The present study has some limitations. Although our study employed the 6-echo m-Dixon using T2* correction by acquiring six echoes, we did not perform similar T2* corrections for MRS and did not account for the presence of short T2* water components in the MR spectra (1). Karampinos et al. (20) predicted an underestimation of the MRS-based FF compared to the image-based FF when the MRS model does not account for the presence of the short T2* water species. Our study result, however, contradicts such predictions and showed overestimation of the MRS-based FF. Further studies and validation are needed to fully utilize the MRS-based FF that considers the effect of short T2* species as the reference of standard. Second, the presently employed method assumes a common T2 value for both water and fat components. To improve the accuracy further, individual water and fat T2 relaxation times should be adopted (1). Third, we did not compare the FF values from the 6-echo m-Dixon method to those from 2-point or 3-point Dixon. Previous studies have demonstrated that the 6-echo m-Dixon method could provide a more accurate FF assessment than 2-point and/or 3-point Dixon methods in liver or muscle (13141727). Reeder et al. (28) suggested that it is necessary to acquire at least six echoes for optimal separation of water and fat signals with T2* correction, which might be the possible explanation for the better accuracy of the 6-echo m-Dixon method. We still need a further study to verify that this tendency applies equally to the vertebral bone marrow. Fourth, we used the PRESS sequence as the gold standard MRS method. However, recent studies have shown that STEAM is superior to PRESS for fat quantification because STEAM is less sensitive to J-coupling effects and T2 signal loss from short T2 water peak (2429). Therefore, further studies are also required for comparing 6-echo m-Dixon to STEAM-MRS in vertebral bone marrow fat quantification. Finally, the number of the subjects studied in the present study is relatively small. Unlike recent studies that tried to validate image-based FF against MRS-based FF on the normal bone marrow, we also included analysis of focal bone lesions as well as normal vertebra to ensure applicability to various clinical situations. However, the number of the subjects with measurable bone lesions was smaller than we had expected. Therefore, most of the targets were normal bone marrow with high FF values, resulting in limitations to the validation of their correlation over a wide range of FF, especially at the low FF range.
In conclusion, 6-echo m-Dixon could be the potential alternative for gold standard MRS for noninvasive vertebral bone marrow fat quantification in routine clinical settings.
 XML Download