

 PDF
PDF ePub
ePub Citation
 Print
Print


INTRODUCTION
Liver cirrhosis (LC) is one of the leading causes of morbidity and mortality worldwide, with the majority of preventable LC cases being attributed to viral hepatitis B or C, excessive alcohol consumption, or non-alcoholic fatty liver disease (NAFLD) (123). Fibrosis and cirrhosis are the consequences of a sustained wound healing response to chronic liver injury from various causes including viral, autoimmune, drug-induced, cholestatic, and metabolic diseases (4). Cirrhosis is the common endpoint of many hepatic diseases and represents a relevant risk for liver failure and hepatocellular carcinoma (5). Assessment of liver function is crucial to predicting the prognosis of patients with chronic liver disease (CLD) or LC (6). In addition, liver function estimation is clinically important, as it is an essential part of making treatment decisions in patients with hepatocellular carcinomas (HCC) (789). Although a serological test is frequently used in practice, it is often associated with false-negative results (10). Currently, several methods, including indocyanine green retention at 15 minutes (ICG R15), 99mTc-galactosyl serum albumin scintigraphy, and hepatic volumetric assessments, are frequently used for the estimation of hepatic function (111213). However, liver function estimation using ICG R15 or scintigraphy reflects the degree of total liver damage or global hepatic function, rather than remnant liver function after a resection or other treatments (14).
Magnetic resonance imaging (MRI) using hepatobiliary contrast agents such as gadoxetic acid (Gd-EOB-DTPA, Primovist®, Bayer Healthcare, Berlin, Germany) has recently been proven to be a valuable tool in evaluating focal liver lesions including HCC (151617181920). After administration of gadoxetic acid, temporary intracellular accumulation of gadoxetic acid in hepatocytes results in the enhancement of the liver parenchyma on T1 or T2*-weighted images (212223). Thus, the uptake of gadoxetic acid in hepatocytes can be quantified with T1 or T2* relaxometry (242526). For T2* relaxometry, a breath-hold (BH) multiple gradient-recalled echo (GRE) technique is traditionally used to acquire a series of images with increasing echo times (TE) at each slice position, and requires a long acquisition time for full coverage of the liver (27). Recently, BH 3D multi-echo gradient-recalled echo (GRE) sequences, which correct several confounding factors, including T1 bias and T2* decay, are widely available from major MRI vendors for hepatic proton density fat fraction estimation (2829). Multi-echo Dixon sequences have shown promising results for hepatic fat quantification, illustrating their value as one of the ancillary sequences in liver MRI examination (2829). Interestingly, during the process of T2* decay correction for hepatic proton density fat fraction estimation, a T2* map is obtained as a byproduct (30). Therefore, we hypothesized that T2* mapping from the multi-echo Dixon sequence for hepatic fat quantification could also be used for the estimation of liver function (313233).
The purpose of this study was to evaluate the validity of using T2* mapping of the liver from the multi-echo Dixon sequence for hepatic fat quantification as a quantitative tool to estimate liver function.
MATERIALS AND METHODS
Study Population
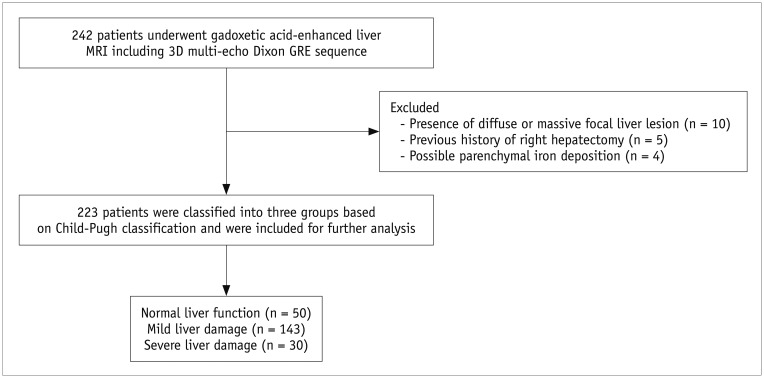
This retrospective study was approved by our Institutional Review Board, and the requirement of informed consent was waived. From September 2015 to July 2016, a total of 242 patients (M:F = 156:86; mean age, 61.0 ± 11.0 years) underwent gadoxetic acid-enhanced liver MRIs (Ingenia, Philips Healthcare, Best, the Netherlands), in our institution, at 3T. Eligibility criteria for the study population were 1) available MR images including pre- and post-contrast 3D GRE sequencing; 2) no diffuse or massive focal liver lesions which may hamper the parenchymal measurement; 3) no diffuse iron deposition in either the liver or spleen parenchyma on the T2* corrected multi-echo chemical shift imaging sequence; 4) no history of a right hemihepatectomy; and 5) no bile duct obstruction. Among 242 patients, 15 (M:F = 9:6) were excluded because of diffuse liver lesions that hampered parenchymal measurement (n = 10) or history of a right hemihepatectomy (n = 5). Four patients (M:F = 2:2) were removed from the analysis because of low pre-contrast T2* values that suggest iron deposition. The cut-off value used in determining possible iron deposition was 6.7 ms (34). Finally, 223 patients (M:F = 145:78; mean age = 60.9 ± 11.0 years) were included (Fig. 1).
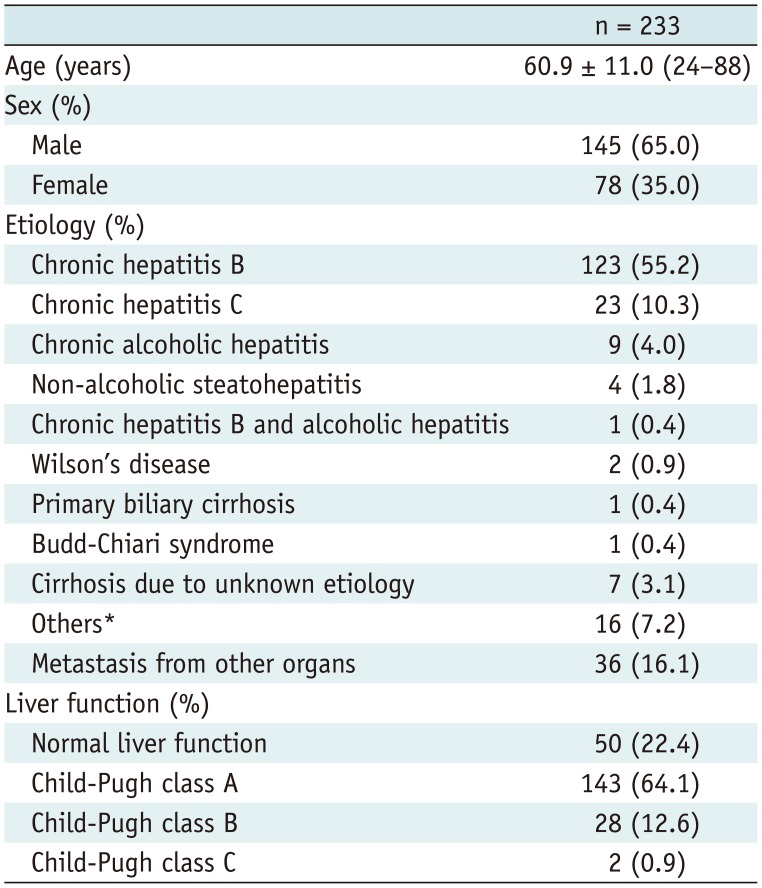
Albumin level, total bilirubin level, prothrombin time, presence and etiology of underlying liver disease data were obtained from electronic medical records for all patients. Based on clinico-laboratory findings, patients were classified into one of three groups: normal liver function (NLF) group, mild liver damage (MLD) group and severe liver damage (SLD) group. The NLF group included patients without any risk factor for CLD (n = 50; liver metastasis [n = 36], benign focal liver lesion [n = 13], and no liver lesion [n = 1]) and who showed no abnormal results on liver enzyme tests. The MLD group consisted of patients with CLD or compensated LC patients (Child-Pugh class A) (n = 143). The SLD group included patients with decompensated cirrhosis (n = 30; Child-Pugh class B [n = 28] and C [n = 2]). Decompensated cirrhosis was defined as having symptomatic complications related to cirrhosis, including those related to hepatic insufficiency (jaundice), and those related to portal hypertension (ascites, variceal hemorrhage, or hepatic encephalopathy) (35). Detailed characteristics of the study population, including clinico-laboratory findings, are provided in Table 1.
MRI Acquisition
MR images were obtained at a 3T unit (Ingenia, Philips Healthcare) using a 32-channel torso phased-array coil. Baseline MR sequences included a BH T2-weighted half Fourier single-shot turbo spin-echo (TSE) sequence, a respiratory-triggered T2-weighted TSE, BH T1-weighted 3D spoiled GRE sequence, a 3D multi-echo Dixon GRE sequence, and diffusion weighted images. For all patients, 3D multi-echo Dixon GRE sequences were obtained before, and 10 minutes after, gadoxetic acid administration. A standard dose of gadoxetic acid (0.025 mmol/kg) was injected at a rate of 1.0 mL/s through an intravenous line placed in a cubital or cephalic vein and was flushed with 30 mL of saline at the same speed.
3D Multi-Echo Dixon GRE Sequence
For liver fat quantification and T2* mapping, a BH 3D multiple echo GRE sequence (mDixon-Quant, Philips Medical systems, Best, the Netherlands), based on the mDixon technique, was performed using the following parameters: a 40 × 40 cm2 field of view, 256 × 259 matrix, 3 mm slice thickness (50% interpolation), 64 slices, 3-degree flip angle, ± 125 kHz receiver bandwidth, time to repetition: 7.8 ms, 6 echoes (initial time to echo: 1.20 ms, interval of TE: 1.98 ms), and acceleration factor of 3 (36). The sequence utilized a low flip angle, multi-echo, multi-peak method including T2*, R2*, and eddy current compensation for accurate and reproducible fat quantification in a single BH time (37). mDixon-Quant (Philips Medical systems) automatically generated a fat fraction map and a T2* map.
Image Analysis
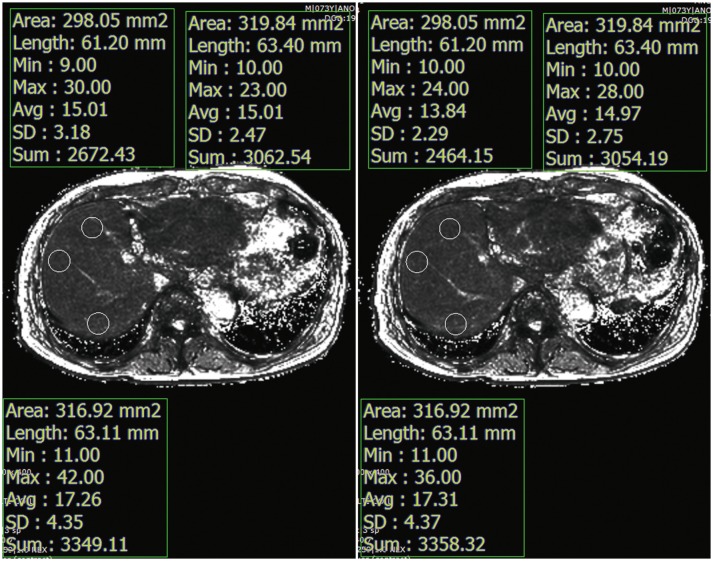
T2* values were measured by drawing regions of interest (ROIs) manually in the liver on pre- and post-contrast T2* maps (Fig. 2). Three circular ROIs (mean area = 301 ± 48 mm2) were placed in the right liver lobe on pre-contrast T2* maps. Every effort was made to avoid focal hepatic lesions, major branches of hepatic vessels, and imaging artifacts. The ROIs drawn on pre-contrast T2* maps were copied and pasted onto the corresponding locations on the post-contrast T2* maps. The average T2* value of the three ROIs was considered as the representative T2* value of the liver. A reduction rate of T2* values between pre- and post-contrast images was calculated following the definition from a previous study (38):

Statistical Analysis
The distribution of parameters was tested using the Kolmogorov-Smirnov test. A paired sample t test was used to compare pre- and post-contrast T2* values in each group. Pre-contrast T2* values, post-contrast T2* values and, T2* reduction rates were compared among the three liver function groups using one-way ANOVAs, followed by paired sample t tests, to determine pairs with statistical significance. A p value of less than 0.05 was considered to indicate statistical significance. A box-plot was created to compare pre- and post-contrast T2* values in each group, as well as to compare reduction rates among different liver function groups. A receiver operating characteristic (ROC) curve analysis was performed to evaluate the diagnostic performance of using T2* reduction rates for the assessment of decompensated LC.
All statistical analyses were performed using commercially available software (MedCalc, version 12, MedCalc Software, Mariakerke, Belgium; IBM SPSS Statistics, version 22.0, SPSS Inc., Armonk, NY, USA).
RESULTS
Among the major clinico-laboratory findings of the three groups, sex (p < 0.001), liver enzyme values (p < 0.001 for albumin, total bilirubin, and prothrombin time/international normalized ratio [PT/INR]), and age (p = 0.019) were different among the three groups (Table 2).
Intra- and Inter-group Comparison of Pre- and Post-Contrast T2* Values
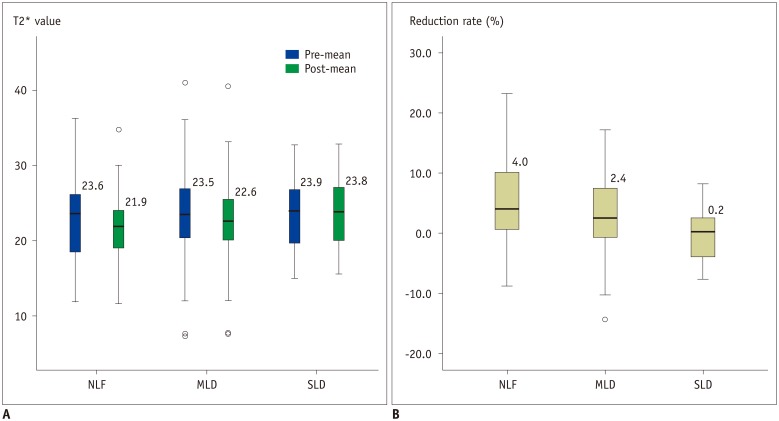
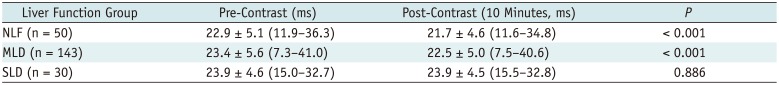
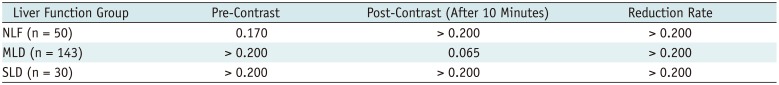
Pre- and post-contrast T2* values of the liver are summarized and visualized in Table 3 and Figure 3A, respectively. T2* values obtained in the three ROIs were consistent for both pre- (average standard deviation: 1.89) and post-contrast measurements (average standard deviation: 1.75). A Kolmogorov-Smirnov test showed that both pre- and post-contrast T2* values, as well as reduction rates, in all three liver function groups were normally distributed (Table 4). In the NLF and MLD groups, post-contrast T2* values were significantly higher than pre-contrast T2* values (p < 0.001). However, pre- and post-contrast T2* values did not show a significant difference in the SLD group (p = 0.886). Finally, there was no significant difference in either the pre-contrast (p = 0.735) or post-contrast T2* values (p = 0.131) among the three groups.
Comparison of Reduction Rate of T2* Values
The reduction rates for the three groups were as follows: NLF 5.0 ± 6.9%, MLD 3.2 ± 6.0%, and SLD −0.2 ± 4.2%. A one-way ANOVA analysis showed that there was a significant difference in reduction rate among the three groups (p < 0.001). While there was no significant difference between NLF and MLD (p = 0.303), there was a significant difference between MLD and SLD (p = 0.003), and between NLF and SLD (p = 0.002) (Fig. 3B).
ROC Curve Analysis
According to a ROC curve analysis, the area under the ROC curve (AUROC) using the T2* reduction rate to differentiate SLD patients from NLF patients was 0.74 (95% confidence interval [CI]: 0.63–0.83). Table 5 summarizes AUROC values, sensitivities and specificities for using a T2* reduction rate to differentiate various liver function groups.
DISCUSSION
Our study showed that there is a significant difference in the reduction rate of T2* values between the MLD and SLD groups (p = 0.002), and between the NLF and SLD groups (p = 0.006). A ROC curve analysis showed that the AUROC of T2* reduction rates for differentiating the SLD group from the NLF group is 0.74 (95% CI: 0.63–0.83). In addition, the cut-off value for using a reduction rate to distinguish patients NLF patients from SLD patients (Child-Pugh class B or C) was 1.60. Our study results are in agreement with the results of a previous study by Katsube et al. (38), which used multi-echo 2D T2*-weighted GRE imaging with Gd-EOB-DTPA to show that the reduction rate of the T2* value in the SLD group was significantly smaller than that of the NLF group. The reduction rate of T2* values of SLD patients being significantly smaller compared to that of the NLF patients can be explained by reduced intracellular Gd-EOB-DTPA uptake by hepatocytes due to decreased function of organic anion-transporting polypeptide (OATP) or a decreased number of OAPT on hepatocytes in patients with decreased liver function.
The standard protocol in our hospital for obtaining liver MRIs includes obtaining pre- and post-contrast T2* maps. Patients' agreements were waived as T2* mapping requires only 15 seconds of BH sequencing and the technique poses minimum radiation risk. Given that the acquisition of a T2* map using multi-echo Dixon sequencing requires only one BH, and post-contrast T2* maps can be obtained in between dynamic imaging and hepatobiliary phase imaging (between 3 and 20 minutes after Gd-EOB-DTPA injection), T2* mapping can easily be incorporated as part of a routine liver MR examination. Furthermore, considering that multi-echo Dixon sequences have been accepted as a promising and accurate tool for fat quantification (2829), we believe that multi-echo Dixon sequencing can be a useful tool for detecting CLDs, including NAFLD or chronic hepatitis C, that cause hepatic dysfunction and increased hepatic triglycerides.
To note, there was no significant difference in pre-contrast T2* values, post-contrast T2* values or reduction rates between the MLD and SLD groups. These results were different from the results of a previous study, which demonstrated a significant difference in the reduction rates between the two groups (38). Such a discrepancy is mainly due to the difference in acquisition time, study population and the sequences used for T2* mapping. First, in the previous study, the difference in the T2* reduction rates between the MLD and SLD groups at 3 and 8 minutes after gadoxetic acid administration was significant (38), while our study acquired T2* values 10 minutes after the contrast injection, which may have been too long to observe a significant difference in the reduction rate. Therefore, further study regarding optimal time for T2* mapping is required. Second, the proportion of SLD patients in the total study group was much smaller in the current study (13.5%) compared to that of the previous study (30%), although the study population was much larger in the current study (242 patients) than that of the previous study (35 patients). In addition, hepatic B viral infection was the main cause of CLD in our study, while hepatitis C viral infection was the main cause of CLD in the previous study. Third, 2D T2*-weighted GRE sequences (2D fast field echo [FFE] in the previous study) may have provided higher sensitivity for field inhomogeneity caused by Gd-EOB-DTPA than the 3D six-echo modified Dixon sequence used in this study. Yet, the 3D six-echo modified Dixon sequence used in our study has additional advantages over the 2D T2*-weighted FFE sequence in terms of its capability to cover the whole liver in one BH and for its fat quantification capability. Other mapping sequences including T1 hepatobiliary phase imaging requires additional BH and thus requires 3–5 minutes of additional acquisition time.
Several studies showed that a Gd-EOB-DTPA enhanced liver MRI can be useful for evaluating liver function (15242526394041). Until now, three different approaches have been reported: direct measurement of hepatic parenchymal signal intensity, measurement of T1 or T2* relaxation time changes using MR relaxometry, and the dynamic contrast-enhanced (DCE)-MRI technique (26). Although signal intensity measurements on T1-weighted images, before and after the administration of gadoxetic acid, is the simplest and easiest method, the measurements may be affected by the use of the parallel imaging technique and signal inhomogeneity correction methods (2426). Furthermore, the signal intensity does not correlate linearly with contrast media concentration (42). Although the DCE-MRI technique enables the measurement of serial hepatic uptake of Gd-EOB-DTPA, and allows for the consideration of liver blood flow, it requires complicated software and a long acquisition time, leading to lower practicability (26). On the contrary, MRI-based T1 or T2* relaxometry can be a more robust quantitative measurement tool compared to traditional signal intensity measurements (2438394344). Until now, the T1 mapping approach, using either a variable flip angle or Look-Locker, has been the preferred method to evaluate liver function compared to T2* mapping due to its shorter acquisition time (152440). However, these T1 mapping protocols cannot produce stable T1 values in vivo compared to inversion recovery sequences, the standard method for T1 mapping, mainly due to B1 inhomogeneity (45).
Interestingly, the 3D six-echo modified Dixon sequence used in our study for T2* mapping was originally developed for fat quantification, as T2* correction is necessary to estimate the proton density fat fraction of the liver (37). Considering that the sequence can allow quantification of hepatic steatosis, as well as T2* values of the liver within one BH, while having the capability of full liver coverage, we believe that the T2* mapping approach for the assessment of liver function using the 3D six-echo modified Dixon sequence is quite practical. Recently, Cassinotto et al. (46) reported that T1 liver mapping using a modified Look-Locker sequence shows higher diagnostic accuracy than liver and spleen diffusion-weighted imaging and T2 mapping for assessing cirrhosis severity. However, there has been no study comparing T1-relaxometry and T2*-relaxometry for assessing the severity of hepatic dysfunction, thus warranting further study.
This study has several limitations. First, this study was designed retrospectively, so there is unavoidable selection bias. Second, a limited number of Child-Pugh class B and C patients were included, so it was impossible to compare the reduction rate of T2* value between Child-Pugh class B and C patients. Third, we did not compare T2* reduction rates with established quantitative liver function tests such as ICG R15 (47). Finally, patient diagnosis was based merely on clinico-laboratory characteristics and radiological data, and not on biopsy findings or hepatic venous pressure gradient measurements.
In conclusion, T2* mapping using a 3D multi-echo Dixon GRE sequence provided moderate sensitivity to assess liver function deterioration in patients with LC, and could be incorporated as part of a routine liver MR examination for the evaluation of CLDs.


 XML Download