

 PDF
PDF ePub
ePub Citation
 Print
Print


INTRODUCTION
Screening mammography is useful for detecting early breast cancer and reducing breast cancer mortality (1). Assessment of the diagnostic performance of screening mammography has become increasingly important to promote cancer prevention and improve the quality of screening programs. The Breast Cancer Surveillance Consortium (BCSC) is a research initiative funded by the National Cancer Institute that incorporates seven mammography registries, and features a Statistical Coordinating Center that collects and analyzes mammography and pathology data in the United States. The BCSC is a valuable resource when it is sought to assess the delivery and quality of breast cancer screening and patient-related outcomes (2). Several studies have reported the diagnostic performance for screening mammography from BCSC data, including recall rates of 4.0–19.6%, sensitivity 73.0–95.0%, specificity 83.0–98.5%, positive predictive value (PPV) 2.6–8.0%, and cancer detection rate (CDR) 2.0–4.7 per 1000 examinations (345678). They also provided desirable goals and the threshold of minimally acceptable interpretive performance for screening mammography (469).
In Korea, women age 40 years or older have undergone biannual mammography screening under the auspices of the National Cancer Screening Program (NCSP) since 1999 (10). However, no database allowing assessment of the quality of such screening has yet been established. Therefore, we organized the Alliance for Breast Cancer Screening in Korea (ABCS-K); 11 institutions agreed to analyze and report on the diagnostic performance of screening mammography (11). It was recently shown that, between 2005 and 2010, the sensitivity and CDR of screening mammography among ABCS-K institutions were comparable to those of Western programs. However, the recall rate, PPV, and specificity were suboptimal despite significant improvements during the study period.
Some authors have identified participant factors affecting the diagnostic performance of screening mammography (5781213), but no such report has emanated from Korea. In the present study, we explored participant factors affecting the diagnostic performance of screening mammography in Korea; we used the ABCS-K data to this end.
MATERIALS AND METHODS
Study Population
Our study was approved by the Institutional Review Board of all the participating hospitals; the need for informed participant consent was waived.
We collected data from participating hospitals between January 2005 and December 2010; the data were linked with the NCSP database. We excluded mammographic data on women with histories of breast cancer, those who received interstitial injections, and those who could not be reliably identified. We enrolled 128756 women examined in 10 hospitals over 6 years. The study population and data collection methods were described in our previous report (11).
Screening Mammography
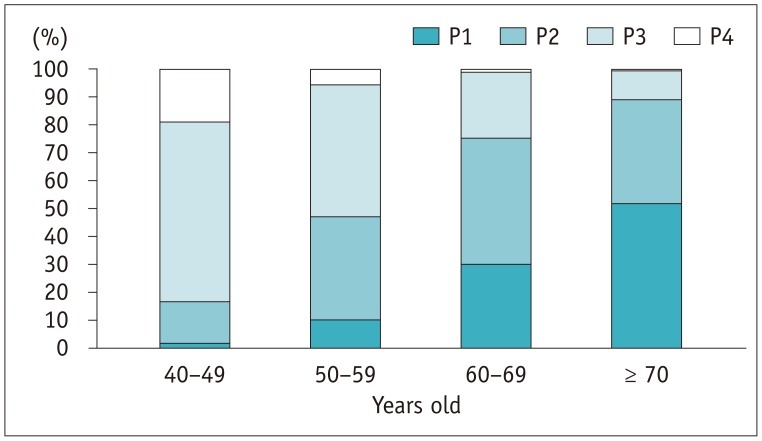
We obtained two mammographic images, in the mediolateral oblique and craniocaudal planes. Each mammographic report contained a visual assessment of breast density as defined by the American College of Radiology (ACR) Breast Imaging-Reporting and Data System, on a scale of 1 to 4. Pattern 4 (P4) is “extremely dense” breast tissue that may lower the sensitivity of mammography; pattern 3 (P3) is “heterogeneously dense” tissue that may prevent detection of small masses; pattern 2 (P2) features “scattered fibroglandular densities”; and pattern 1 (P1) describes breasts that are “almost entirely fat” (14). Breasts of patterns 1 and 2 were considered to be fatty breasts, and those of patterns 3 and 4 were considered to be dense breasts.
Outcome Measurements and Statistical Analysis
We used the National Health Insurance Service (NHIS) database. The data were linked with the NCSP database and National Cancer Center registry for breast cancer. We collected information on participants, radiologists, and facilities with the approval of the Institutional Review Boards of all participating hospitals. These were merged into the NHIS database.
We calculated performance indicators including the recall rate, CDR per 1000 examinations, PPV, sensitivity, specificity, false-positive rate (FPR), and interval cancer rate (ICR) per 1000 negative examinations. The performance indicators were defined in our previous report (11). We analyzed all data by age, breast density, and the number of visits to the same institution; we calculated odds ratios (ORs) (both crude [cORs] and adjusted [aORs], with 95% confidence intervals). The OR reference values were those for women aged 40–49 years, with breasts of density P1, and who visited screening institutions only once. Each performance indicator was adjusted for other factors. Of the cORs and aORs, the latter were more meaningful because possible confounding factors were controlled.
We also analyzed trends among indicators evident among the various grades; a p value of less than 0.05 was considered significant. We used logistic regression to compare differences among grades, and the trends afforded by the indicators. We used SAS ver. 9.2 (SAS Institute, Cary, NC, USA), to this end.
RESULTS
Demographic Factors
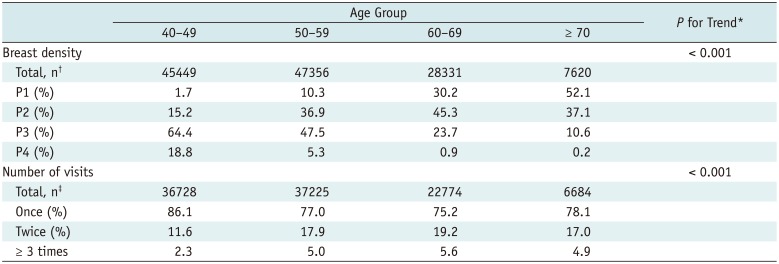
Table 1 shows breast densities and the numbers of visits to the same institution by age group. Supplementary Table 1 (in the online-only Data Supplement) shows the distribution of the enrolled participants by participating hospital. Breast density differed significantly by age group; the proportion of dense breasts decreased significantly with increasing age (Table 1, Fig. 1). The number of visits to the same institution differed significantly by age group, increasing significantly with advanced age (Table 1).
Diagnostic Performance
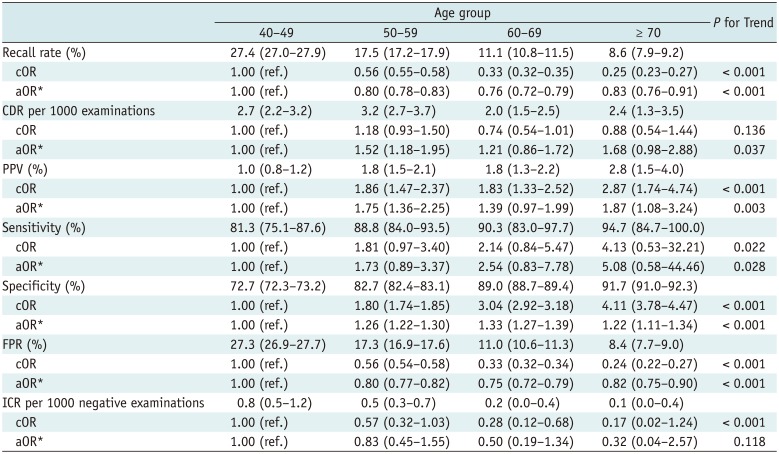
Table 2 shows the diagnostic performance of screening mammography by age group. The recall rates of older women were significantly lower than that of women in their 40s. The recall rate decreased significantly with increasing age. The CDR of women in their 50s was highest among all age groups, but the CDR improved with increasing age after adjusting for breast density and number of visits to the same institution. The PPVs of women in their 50s and 70s were higher than those of women in their 40s, but the PPVs of women in their 60s did not differ. The trend in PPV was upward with increasing age. The sensitivities did not differ among the age groups, but trended significantly upward with increasing age. The specificities of older women were higher than that of women in their 40s and trended upward with increasing age. The FPRs of older women were lower than that of women in their 40s and trended downward with increasing age. The ICR did not differ among the age groups and did not trend up or down with increasing age after the adjustment.
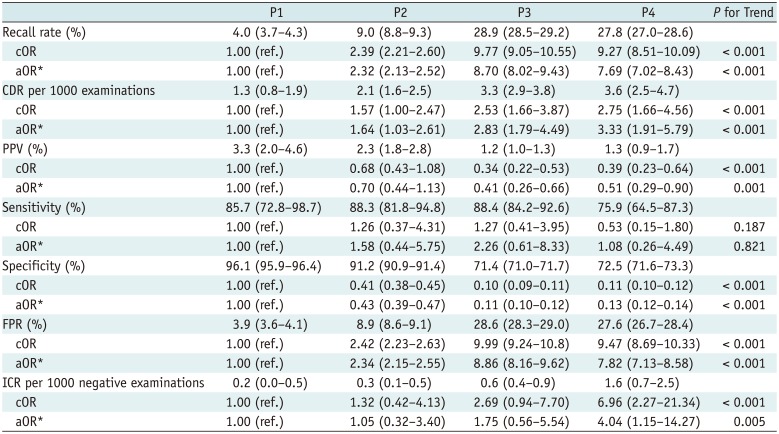
Table 3 shows the diagnostic performance of screening mammography by breast density. The recall rates of higher density groups were significantly higher than that of the P1 group. The rate trended significantly upward with increasing breast density. The CDRs of higher density women were greater than that of the P1 group and trended upward with increasing breast density. The PPVs of women with P3 and P4 breasts were lower than those of P1 women, but the PPVs of those with P2 did not differ from those of P1 women. The trend was downward with increasing density. The sensitivities of the density groups did not significantly differ and no trend up or down was evident as breast density increased. The specificities of the higher density groups were lower than that of the P1 group and trended downward with increasing density. The FPRs of the higher density groups were greater than that of the P1 group and trended upward with increasing density. The ICR of only the P4 group was higher than that of the P1 group, but values generally trended upward with increasing breast density.
The diagnostic performances upon division of women into two groups by breast density (fatty and dense) are shown in Supplementary Table 2 (in the online-only Data Supplement). The OR reference standard was based on data from women with fatty breasts (grades P1 and P2). The recall rates, CDRs, FPR, and ICRs were significantly higher in women with dense breasts after adjusting for age and the number of visits. The PPVs and specificities were lower among women with dense breasts. The sensitivities did not differ significantly between the groups, even after the adjustment.
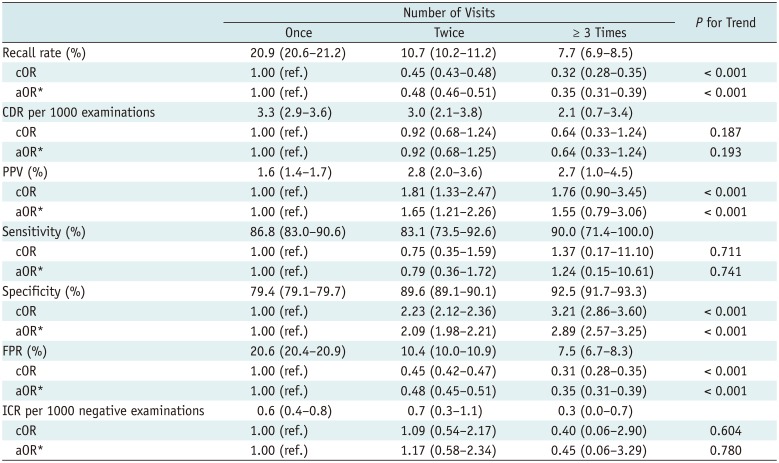
Table 4 shows the diagnostic performance of screening mammography according to the number of visits to the same institution. The recall rates were significantly lower after successive visits than after one visit. The recall rate trended significantly downward with increasing numbers of visits. The PPVs associated with two visits were higher than those associated with one visit. The PPV generally trended upward as the number of visits increased. The specificities associated with successive visits were higher than that associated with one visit, and trended upward with increasing numbers of visits. The FPR of women who visited repeatedly was lower than that of one-visit women. None of CDR, sensitivity, or ICR differed by numbers of visits; no trend was evident.
DISCUSSION
We recently reported on the diagnostic performance of, and annual trends in, screening mammography conducted from 2005 to 2010 (11). Compared with the desirable goals of the ACR and benchmarks of the BCSC, the sensitivity (86.5%) and CDR (2.7) were comparable, while the specificity (81.1%) and PPV (1.4%) were low and the recall rate (19.1%) was high (614).
We suggested that many factors affect mammographic performance. In the present study, we show that participant factors including age, breast density, and the number of visits to the same institution constantly affected the recall rate, PPV, specificity, and FPR. Younger age and higher breast density were associated with a higher recall rate and FPR, and lower PPV and specificity impairing the efficacy of mammography screening. By contrast, successive visits to the same institution were associated with lower recall rate and FPR, and higher PPV and specificity, thus improving quality of mammography screening.
In our study, the proportion of dense breasts was slightly higher than that of fatty breasts. However, it was similar to other studies (58). The distribution of age was also similar to that of other studies (568). Women in their 40s and 50s accounted for more than half. Among them, women in their 50s constituted the greatest proportion of participants in this study. Although the incidence of breast cancer peaks in women aged in their late 40s in Korea (15), the CDR was highest among women in their 50s in the present study, probably attributable to the fact that most women studied were in their 50s.
We found that younger women had high proportions of dense breasts (Table 1, Fig. 1). This may affect mammographic performance because high breast density is a confounding factor. Therefore, to evaluate each diagnostic parameter, we adjusted for the other factors. We adjusted for breast density and the number of visits to the same institution when evaluating diagnostic performance by age; we adjusted for age and numbers of visits when evaluating performance by breast density; and we adjusted for age and breast density when evaluating performance by number of visits. This rendered the aORs more meaningful. We offer an example of the difference between cOR and aOR: the CDR trended downward with increasing age after adjustment. However, the cOR was not apparent (Table 2), whereas, the ICR trended downward with increasing age when the cOR was evaluated. Notably, after the adjustment, no significant trend was apparent (Table 2).
It has long been known that dense breast tissue may obscure breast cancers, decreasing the sensitivity of screening mammography (161718). The lower sensitivity of mammography in younger women, especially those aged 40–49 years, may be attributable to the fact that their breasts are radiographically dense. Rapid tumor growth in younger women may also cause more interval cancers and may be the prime explanation as to why sensitivity of screening mammography is lower in younger women (7192021).
However, we found that sensitivity did not differ by age and breast density. Sensitivity generally trended upward with increasing age, but the significance of the trend was lower than that of other significant parameters. This may be explained by the very high recall rates; these were optimal only in women aged more than 70 years (8.6% vs. 11.1–27.4%) with P1 breast densities (4.0% vs. 27.8–28.9%); the proportions of those aged over 70 years and those with breasts of P1 density were minor. Thus, unnecessarily high recall rates may conceal limitations imparted by younger age and dense breasts on the effectiveness of mammography screening. Also, ICR was not affected by younger age.
It has been reported that dense breast tissue per se is an independent risk factor for breast cancer (2223). We found that the CDR and ICR increased as breast density rose, even after the adjustment (Table 3); this is in line with those of other studies (1722).
Successive visits to the same institution improved the quality of screening mammography. Comparison of current and prior mammograms significantly improves overall performance and reduces the recall rate (24). By contrast, the CDR trended downward as the number of visits increased, but this did not attain statistical significance. This may be associated with a lower rate of incident cancers compared with prevalent cancers.
We found that participant age, breast density, and the number of visits to the same institution affected the overall diagnostic performance, but not the sensitivity, of screening mammography. Neither age nor breast density is modifiable, but participant behavior may be changed via education, which should be imparted to women undergoing screening mammography. Several studies have suggested that relevant education programs about breast cancer screening could improve participant behavior (252627). It is important to decrease the unnecessarily high recall rate, especially among younger women with dense breasts; this would improve the quality of screening mammography. In addition, as screening mammography has certain limitations in young women with dense breasts, supplementary ultrasound or digital tomosynthesis (28) evaluation should be explored.
Our present study had several limitations. First, we did not evaluate certain risk factors, including family history, because the study was retrospective in nature and such information was not available. Second, we encountered some “interval” cancers, but could not differentiate false-negative from true interval cancers because the Personal Information Protection Law dictated that we were to be given only the numbers of screening-detected and interval cancers; we were denied detailed information on the cancer patients. Interval cancer does not always indicate false-negativity, although it could be regarded as a false negative in population-based screening programs (21). Third, the participant factors recorded differed somewhat by screening institution (Supplementary Table 1 in the online-only Data Supplement) (11). However, our study is meaningful because this is the first multicenter work exploring the effects of participant factors on the efficacy of the screening mammography run by the NCSP in Korea.
In conclusion, younger age and higher breast density negatively affected the diagnostic performance of screening mammography in terms of the recall rate, PPV, specificity, and FPR; successive visits to the same institution had a positive effect. If examinees were encouraged to successive visits to the same institution, this would improve the diagnostic performance of breast-cancer screening.
 XML Download