Journal List > Korean J Radiol > v.18(1) > 1027304

Kim, Hong, Im, Suh, Park, Kim, Chang, Lee, Hur, Kim, and Choi: Myocardial T1 and T2 Mapping: Techniques and Clinical Applications

Abstract

Cardiac magnetic resonance (CMR) imaging is widely used in various medical fields related to cardiovascular diseases. Rapid technological innovations in magnetic resonance imaging in recent times have resulted in the development of new techniques for CMR imaging. T1 and T2 image mapping sequences enable the direct quantification of T1, T2, and extracellular volume fraction (ECV) values of the myocardium, leading to the progressive integration of these sequences into routine CMR settings. Currently, T1, T2, and ECV values are being recognized as not only robust biomarkers for diagnosis of cardiomyopathies, but also predictive factors for treatment monitoring and prognosis. In this study, we have reviewed various T1 and T2 mapping sequence techniques and their clinical applications.

INTRODUCTION

Cardiac magnetic resonance (CMR) imaging is widely used in various fields related to cardiovascular diseases (1). The main advantage of CMR is its potential for characterization of myocardial tissues. Recent technological developments have enabled T1-mapping, which allows the instant detection of myocardial abnormalities beyond the ability of detection by conventional qualitative assessment. T1 and T2 mapping CMR sequences are rapidly becoming the gold standard and have been integrated into routine CMR imaging protocols (2).
The major advantage of T1 mapping sequences is their potential for quantitative objective assessment of myocardial abnormalities. Conventional signal intensity-based CMR techniques involve qualitative nonparametric sequences. Although these sequences allow semi quantitative analysis using region-of-interest (ROI) or threshold-based methods, their ability is limited to the evaluation of diffuse myocardial changes such as myocarditis or diffuse fibrosis (34). In contrast, T1 and T1 mappings are parametric quantitative sequences, which provide tissue-specific T1 and T2 values. They allow the comparison of quantified myocardial parameters with normal reference values acquired under the same scanning conditions such as scanner type, contrast agent, and scan time (5). The other advantage of T1 and T2 mapping is the simplicity of T1 and T2 map acquisition and parametric T1 and T2 value measurement. Myocardial T1 and T2 maps can be generated using the single breath-hold technique (678).
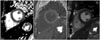
T1 times can be determined either using manual or automatic ROIs or by applying automatic thresholds. Furthermore, the measurements are obtained directly on the maps, wherever they are displayed, and the use of a picture archiving and communications system is dispensable (9). Native T1, T2, and extracellular volume fraction (ECV) values are representative parameters acquired by T1 and T2 mapping CMR imaging (Fig. 1). In 2013, Moon et al. (5) documented the recommendations for T1 mapping sequence acquisition and quantification for clinical and research use, based on published data and expert consensus.
In the present study, we will review the T1 and T2 mapping parameters, a few of the available T1 and T2 mapping sequence techniques, and the clinical feasibility of T1 and T2 mapping parameters in various aspects of cardiomyopathy.

T1 and T2 Mapping Parameters

Native T1

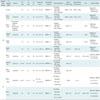
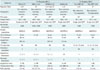
T1 relaxation time, which is also referred to as spin-lattice or longitudinal relaxation time, is a biological magnetic resonance (MR) parameter. T1 relaxation time indicates how quickly nuclei recover towards thermodynamic equilibrium along the B0 direction. The value of T1 relaxation time depends on the rate of energy transfer from an excited proton to its surroundings. The native T1 value is a tissue-specific time constant used to distinguish different tissues. The rate of energy transfer varies according to the state of the molecular environment (e.g., molecular size, shape, viscosity, temperature, and magnetic field strength). T1 values increase with the increase in field strength (10). T1 values reported by various studies vary slightly according to the sequence used. Normal myocardial native T1 values acquired using the modified Look-Locker inversion recovery (MOLLI) MR method have been reported to be 930 ± 21 ms at 1.5 T and 1052 ± 23 ms at 3T (11). Table 1 presents the reference T1 mapping values reported by various studies according to the acquisition sequences and field strengths (Table 1). The native T1 value of the myocardium is also dependent on age and sex—men and older subjects exhibit slightly higher values than do women and younger subjects (2). Tissues generally contain water and a variety of large molecules. Since pathological processes alter the water composition or local molecular environment of tissues, they also generally alter the T1 values. Representative myocardial pathologies leading to T1 changes include diffuse myocardial fibrosis (121314), edema (151617), inflammation (18), infiltrative diseases (9) such as amyloidosis (1213), Fabry disease (FD) (19), and hemosiderosis (2021), a condition where abnormal substances are deposited in the myocardium. Native T1 is thus regarded as a promising method for the detection of myocardial abnormalities without the necessity of administration of gadolinium contrast agent.

T2 Relaxation Time

T2 relaxation time, also referred to as spin-spin or transverse relaxation time, is another biological parameter of CMR imaging. Similar to T1 relaxation time, T2 relaxation time is also a tissue-specific time parameter used to distinguish between normal and abnormal myocardial tissues. The increase in water content of myocardial tissues is the main cause for longer T2 relaxation times. Therefore, myocardial edema is the main pathology responsible for variation in T2 values. T2 mapping sequences are useful for the detection of myocardial edema in patients with acute myocardial infarction (AMI) (22), myocarditis (2324), stress cardiomyopathy (23), sarcoidosis (25), and cardiac allograft rejection (26). Normal myocardial T2 values acquired using steady-state free precession (SSFP) MR imaging have been reported to be 52.18 ± 3.4 ms at 1.5T (27) and 45.1 ms at 3T (28).

Extracellular Volume Fraction Values

The myocardium can be divided into its cellular and extracellular or interstitial components (2930). The cellular components include cardiac muscles (involuntary striated muscle fibers), which are interconnected by intercalated discs, structural components, nuclei, sarcolemma, sarcoplasmic reticulum, and vascular and neuronal elements. The interstitial component is the complex three-dimensional extracellular space in which the cellular components of the myocardium are embedded (31); this space comprises fluid, collagen, elastin, fibrils, and other glycoproteins (32). The interstitium is a complex and dynamic environment, which is vital for normal cardiac structure and function. Interstitial extracellular space expansion is a distinctive feature of myocardial pathology and an important factor in ventricular remodeling. It could also be a potential therapeutic target (33). Myocardial fibrosis, a common pathology of end-stage heart diseases and a major independent predictor of a major adverse cardiac event (31), is the major cause of extracellular space expansion. Other pathologies such as edema and inflammation may also cause extracellular space expansion. Previously, invasive endomyocardial biopsy was the only available method for the quantification of diffuse fibrosis (33). However, currently, T1 mapping techniques have enabled the quantitative estimation of myocardial interstitial remodeling and extracellular space expansion, and they are increasingly being used in the evaluation of myocardial ECV (33). The robustness of CMR-quantified ECV quantification has been proven by several studies (343536). In a state of dynamic equilibrium with regard to contrast distribution between the blood cavity and myocardium, the partition coefficient for the two structures can be calculated from their pre and post-contrast T1 values. The myocardial ECV is derived by correcting for the hematocrit level (37). It can be calculated using the following equation:
ECV = {(ΔR1 of myocardium / ΔR1 of left ventricular [LV] blood pool)} × (1 - hematocrit level), where R1 = 1 / T1 and ΔR1 = post-contrast R1 - pre-contrast R1.
Post-contrast T1 values are known to vary depending on the gadolinium dosage and clearance rate, scanning time, body composition, and hematocrit levels. However, ECV is known to be a more stable and biologically significant biomarker (3839).
Myocardial ECVs in healthy volunteers were reported to be similar at field strengths of 1.5T (0.25 ± 0.04) and 3T (0.26 ± 0.04) (Table 1) (40). According to the consensus recommendation of Moon et al. (5), a “bolus only” injection is sufficient for ECV measurement, while, for post-contrast T1 mapping acquisition time point, a minimum delay of 15 minutes is recommended for reaching a state of dynamic equilibrium (3441). According to a recent multi-ethnic study of atherosclerosis based on the evaluation of CMR data, although women exhibited higher ECV than men, they exhibited relatively less ECV change over time (42). In healthy subjects, ECV is known to increase slightly with age (39). It allows the quantification of diffuse myocardial pathologies and exhibits great potential for the visualization of fibrosis, edema, amyloid, iron overload, and lipids (43).

Technical Review

Evolution of the Cardiac T1 Mapping Sequence

Cardiac T1 mapping has attracted attention as an important diagnostic imaging tool. As recently as a few years ago, T1 mapping was challenging because of severe time constraints related to cardiac and respiratory motion (44). Standard inversion recovery (IR) measurement requires a long repetition time, approximately five times as long as the T1 value, in order to allow complete restoration of longitudinal magnetization (45). This measurement technique is not applicable to the heart because the breath-hold time is insufficient for calculating an accurate T1 value, especially since samples are required for at least six to ten time points along the T1 recovery curve (46). The Look-Locker (LL) sequence was introduced (47) for the measurement of T1 relaxation times at multiple time points after an initial preparation pulse. It was subsequently adapted to the MOLLI (48) sequence. In particular, the MOLLI sequence was the first to allow pixelwise T1 mapping for cardiac MR imaging. It facilitated intuitive interpretation and quantitative analysis using high-resolution T1 maps and inspired various T1 mapping methods. The recently developed saturation recovery (SR) single-shot acquisition (SASHA) and saturation pulse prepared heart-rate-independent inversion recovery techniques have been shown to outperform MOLLI (749). Several myocardial T1 mapping methods currently incorporate single breath-holding with electrocardiogram gating to freeze cardiac motion on a specific phase, thus eliminating tissue motion, and employ longitudinal magnetization preparation pulses such as inversion or SR pulses to yield a heavy T1 weighting. Active T1 mapping development is progressing towards achieving improved accuracy and precision in as short a scan time as possible. We will briefly review representative T1 mapping methods including the LL, MOLLI, shortened MOLLI (ShMOLLI), and SASHA methods to clarify the basic concepts and limitations of each technique. Although this review mainly focuses on T1 mapping methods, we will briefly address one of the T2 mapping methods as well as the parameters for T1 and T2 mapping sequences (Table 2) to facilitate understanding.

Look-Locker Sequence

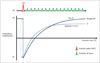
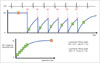
The LL sequence, also known as the “inversion time (TI) scout” sequence, has been broadly implemented in most MR imaging protocols. In 1970, Look and Locker (47) proposed an efficient method for the measurement of T1 time using a continuous and periodic train of radiofrequency (RF) pulses after the inversion pulse. Conditional upon a number of factors, including the type of readout sequence and tissue characteristics, longitudinal magnetization recovers to steady-state quicker than undisturbed equilibrium magnetization (50), as shown in Figure 2.
For this reason, the LL sequence measures the apparent recovery time (referred to as T1*) instead of “true T1”, the actual longitudinal recovery time. T1* is usually less than the true T1.
The apparent recovery curve follows a three-parameter exponential recovery model, S(t) = A - B exp (-t / T1*), where S(t) is the signal intensity at TI t. The values of A, B, and T1* are estimated by curve-fitting using the three-parameter model. T1* can be corrected by applying an LL correction: T1 = T1* (B / A-1) (50).
The LL method acquires approximately 20 images with a variety of readout sequences such as the SSFP and fast low-angle shot sequences throughout the cardiac cycle, without regard for gating to a specific phase in order to mitigate cardiac motion during a single long breath-hold (51). Therefore, it would be difficult to create a pixel-based T1 map from an LL sequence because of the variability of heart rate (HR) (52) as well as the partial volume effect (53) resulting from physiological motion and misregistration.

Modified Look-Locker Inversion Recovery Sequence

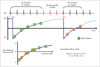
The MOLLI technique was designed to overcome the limitations of the LL sequence. It was first brought into widespread use for myocardial T1 mapping. The MOLLI technique is used to acquire IR-weighted images at different prescribed TIs using single-slice, single-shot readouts throughout one breath-hold within a cardiac cycle in a specific phase, following which the images are sorted into a single data set according to consecutive TIs (48). The original MOLLI was a 3(3)3(3)5 protocol. This protocol code indicates the number of inversion pulses and samples and the recovery period—the unbracketed numbers are the numbers of images acquired after the inversion pulse, and the bracketed ones are the numbers of RR intervals for T1 recovery. Figure 3 presents a simple example of a MOLLI sequence with a 5(3)3 protocol (54). This protocol involves two inversion pulses and a recovery period of three RR intervals, with five or three images acquired after the first and second inversions. To obtain a pixel-wise T1 map, the acquired images are sorted according to the TI, following which, three-parameter model fitting, including LL correction, is performed as described for the LL method. Although MOLLI uses a gated-SSFP readout, the three-parameter model fitting and LL correction are adequately effective when using a low flip angle on the readout. To achieve a superior signal-to-noise ratio and reproducibility, a balanced SSFP readout is employed along with aggressive parallel imaging techniques, thus providing a narrow acquisition window and minimizing myocardial misregistration (44). The sensitivity of MOLLI towards HR can be mitigated by employing a single inversion or increasing the time between inversions to ensure a more complete recovery (104054).

Shortened Modified Look-Locker Inversion Recovery Sequence

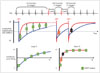
The ShMOLLI sequence is one modification of the MOLLI sequence. It provides a faster acquisition time within a short breath-hold duration of only nine heartbeats, in contrast to MOLLI, which requires a 17-heartbeat duration and is less HR-dependent (6).The ShMOLLI sequence is very similar to MOLLI. However, the former does not require the full recovery of longitudinal magnetization because of the conditional data analysis algorithm, as shown in Figure 4. During the process of T1 estimation, the conditional data analysis algorithm distinguishes a set of samples according to the T1 times using curve-fitting errors. In regions of long T1, the set of samples from the first inversion is fitted using the three-parameter model, while the samples from the first and second inversions are fitted for short T1. For very short T1, the samples from all inversions are used. ShMOLLI with seven samples might exhibit increased variability because of the insufficient number of images for T1 curve-fitting. Reduced precision with ShMOLLI is considered a trade-off for reduced scan time and breath-hold requirement.

Saturation Recovery Single-Shot Acquisition Sequence

Saturation recovery methods for T1 mapping have begun to attract attention as surrogates for IR methods. The SR pulse non-selectively saturates the longitudinal magnetization to zero, independent of previous acquisitions. Recovery periods are, therefore, not required between successive saturation pulses because recovery always begins from a saturated state. The best-known T1 method is SASHA (7).
Saturation recovery single-shot acquisition protocols involve the acquisition of ten single-shot balanced steady-state free precession (bSSFP) images over consecutive heartbeats. The first image is initially acquired without any saturation preparation, using equilibrium magnetization as an anchor point for curve-fitting, and the remaining images are acquired after a saturation pulse with a different saturation delay over the RR interval (7), as shown in Figure 5. The accuracy and precision of the T1 map varies depending on the use of a two or three-parameter fitting model. Two-parameter model fitting, defined by S(t) = A (1 - exp [-t / T1]), greatly reduces variability at the cost of systematic bias resulting from the assumption of ideal saturation efficiency. In other words, it can improve the precision of the T1 map, but at the cost of accuracy. On the other hand, the three-parameter model, defined by S(t) = A - Bexp (-t / T1), is unaffected by any imperfection in the saturation RF pulse; it is, therefore, highly accurate but sensitive to noise. In the fitting model, A indicates the scaling factor, and B indicates the saturation efficiency (1055).
Recent improvements to the SASHA method include the application of a variable readout flip angle, two-parameter fitting, and high-performance saturation pulses, all of which have remarkably improved its accuracy and precision (56). To improve the saturation efficiency, an adiabatic or optimized RF pulse is needed to more completely saturate the residual longitudinal magnetization of the myocardium in the B0 and B1 field variations (57).

Accuracy and Precision of T1 Mapping

In T1 mapping techniques, the accuracy and precision of the T1 map is influenced by whether or not magnetization preparation pulses are used between IR and SR pulses.
The IR pulse inverts the longitudinal magnetization vectors from +M0 to −M0. Afterwards, the inverted vectors begin their recovery from −M0 to +M0. This wide dynamic range can help acquire various IR-weighted images and improve the precision of T1 mapping. In contrast, the SR pulse is used for nullifying the longitudinal magnetization vectors by followed a spoiling gradient pulse. The initial part of T1 recovery has poor signal-to-noise ratio because of insufficient T1 recovery. The precision of T1 maps obtained from SR-weighted images is lower compared to that obtained with the IR pulse (1058).
In terms of accuracy of T1 maps, SR pulse sequences can produce T1 maps of excellent accuracy, because the nullifying of the SR pulse relieves the effect of previous longitudinal magnetization, thus rendering the T1 map less sensitive to T2-dependence, magnetization transfer effect, and dependence on saturation efficiency. However, with IR pulse sequences, the accuracy of the T1 map is largely influenced by the degree of restoration of inverted magnetization vectors before the succeeding IR pulse. Other factors affecting the accuracy of T1 maps with IR pulse sequences are T2-dependence, magnetization transfer effect, and dependence on inversion efficiency (1058).

Myocardial T2 Mapping Technique

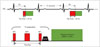
T2 mapping is another promising tissue characterization technique. Two types of T2 mapping sequences are used in cardiac MR imaging—dark-blood turbo spin-echo (TSE) and bright-blood T2-preparation pulse-based sequences. TSE-based T2 mapping has some limitations, including the appearance of ghosting artifacts from blood flow, which result in an increase in the appearance of bright subendocardial rims, and through-plane motion, which results in signal loss and can significantly limit the clinical applicability of this method (515960). In contrast, T2-preparation-based methods are less sensitive to TSE-associated artifacts (5961), and a T2-decay curve can be created using spin-spin relaxation to adjust the T2 preparation time. This method involves two steps— a T2-preparation module and a rapid imaging sequence that includes bSSFP or rapid gradient echo sequence, as illustrated in Figure 6. The T2-preparation module comprises non-selective 90° and 180° pulses to create spin-spin relaxation between two 90° pulses. After preparation, the magnitude of longitudinal magnetization depends on the degree of T2 decay. This magnitude can be adjusted by varying the duration of the T2-preparation module. The imaging sequence, either a balanced SSFP or gradient echo sequence, is run immediately after preparation. A T2 map is generated by two-parameter model fitting, defined by S(t) = A exp (-t / T2), where S indicates the signal intensity, A, the scaling factor, and t, the T2 preparation time.

Clinical Applications of T1 and T2 Mapping Sequences

Non-Ischemic Cardiomyopathy

Dilated Cardiomyopathy

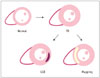
Dilated cardiomyopathy (DCM) is a cardiac muscle disease with unknown or variable etiology. It is characterized by ventricular dilation and impaired systolic function without evidence of other loading conditions (6263). Diffuse myocardial fibrosis is a fundamental factor for cardiac remodeling (36264). The degree of myocardial fibrosis is a prognostic factor associated with the progression of cardiac dysfunction (65). Late gadolinium enhancement (LGE) is a powerful imaging tool that can detect the presence, location, and extent of myocardial fibrosis (66). In DCM, mid-wall fibrosis, determined by LGE, is predictive of the combined endpoint of an adverse cardiac outcome (67686970). However, LGE often fails to detect diffuse fibrosis in the absence of normal myocardium, since the detection of fibrotic myocardium on LGE images is based on the difference in signal intensity between fibrotic and normal myocardium (3). In fact, many patients with DCM do not exhibit myocardial LGE (36467). However, patients with LGE-negative myocardium with a normal appearance have been reported to exhibit significantly higher native T1 and ECV values than normal control patients (Fig. 7) (1464). In patients with DCM, native T1 and ECV values are known to be significantly higher and post-contrast T1 values are known to be lower compared to those of control subjects (147172). In addition, patients with DCM also exhibit increased T2 values (737475). Native T1 imaging can help differentiate between normal and abnormal myocardia with a high level of diagnostic accuracy (71). ECV, which reflects the myocardial collagen content in patients with DCM, is also useful (76). Native T1 and ECV values correlate with LV functional parameters (6473) such as LV ejection fraction, global strain, and other biomarkers (14). Additionally, ECV can detect diffuse subclinical myocardial abnormalities even in cases of early-stage DCM (7677). The increase in T2 signal is possibly due to myocardial edema consequent to injury and inflammation related to the process of cardiomyopathy (7578). Recently, native T1 and ECV values were reported to be independent prognostic factors of adverse clinical outcome in patients with DCM (377980).

Hypertrophic Cardiomyopathy

Hypertrophic cardiomyopathy (HCMP) is the most common heritable myocardial disease. It is caused by mutations in genes that encode sarcomeric proteins (81). The disease is diagnosed morphologically and defined by the presence of a hypertrophic, non-dilated LV in the absence of another cause of LV hypertrophy (LVH) (63). Myocardial fibrosis is also a hallmark of HCMP (82). Cardiac MR imaging is useful for the evaluation of myocardial morphology as well as the extent of myocardial fibrosis in patients with HCMP. Significant increases in native T1 and ECV values are observed in regions affected by HCMP. In patients with HCMP, T1 mapping is useful for detecting myocardial fibrosis while overcoming the limitations of LGE (Fig. 8). Native T1 sequences can depict the presence and pattern of myocardial fibrosis even in fibrotic areas that go undetected by LGE (1483). In addition, native T1 values have been found to correlate with disease severity and increase along with increase in wall thickness in HCMP (14). Post-contrast T1 values, which have been correlated with diastolic dysfunction, are significantly low in patients with HCMP because of diffuse interstitial fibrosis (84). In patients with HCMP, the ECV values have also been found to correlate well with the collagen volume fraction. Previous studies have suggested that ECV could be a potential biomarker of HCMP, which could help distinguish between groups with and without sarcomere-related gene mutations (85).

Fabry Disease

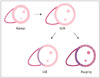
Fabry disease is an X-linked glycosphingolipid storage disorder caused by mutation of the gene that encodes alpha-galactosidase, resulting in deficient enzyme activity (86).
The most common cardiac manifestation of FD is LVH, followed by conduction disorders, valve dysfunction, and arrhythmias, resulting from the accumulation of globotriaosylceramide in cardiomyocytes, valves, and the conduction system (86). It is important to differentiate FD from other myopathies, such as HCMP, that can cause LVH. Notably, 50% of patients with FD exhibit the characteristic feature of LGE on the inferolateral LV wall (87).
In addition to the evaluation of LGE, T1 mapping is a useful complementary tool for the evaluation of cardiac involvement in FD (Fig. 9). Decreased T1 value is a distinctive feature of myocardial involvement in FD, and it is especially significant in the LV septum.
This phenomenon occurs because the presence of glycosphingolipids in myocytes causes a reduction in the T1 value. A previous study demonstrated that the decrease in the septal native T1 value is a characteristic feature that can help distinguish FD from other cardiomyopathies (77). Reduction in native T1 value prior to the onset of LVH can be an early marker of FD and has been correlated with diastolic and systolic dysfunction (88). In contrast to other diseases, FD does not cause variations in the ECV (89).

Amyloidosis

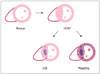
Amyloidosis is a disease characterized by the deposition of insoluble misfolded protein aggregates with a characteristic β-sheet structure in tissues throughout the body (9091). Cardiac involvement is common with the immunoglobulin light chain (AL) and transthyretin types of amyloidosis, and it is associated with poor prognosis (92), particularly in the AL type of the disease (9394). Cardiac amyloidosis, histologically characterized by infiltration and expansion of the interstitial space by amyloid proteins, is usually diagnosed by an endomyocardial biopsy (95). The appearance of global, circumferential subendocardial LGE with distribution in non-coronary arterial regions is a hallmark of cardiac involvement in amyloidosis. However, characteristic LGE patterns appear late in the disease course and do not always occur (12). T1 mapping is a useful noninvasive method for the diagnosis of cardiac amyloidosis. Marked increases in native T1 and ECV values are distinguishing features of cardiac amyloidosis (Fig. 10) (9697). The use of gadolinium contrast agent is relatively contraindicated in cases of severe renal failure, which is common in patients with systemic AL amyloidosis (98). Therefore, native T1 is a useful tool for the diagnosis of cardiac amyloidosis. In a previous study, Karamitsos et al. (12) proved that native T1 value is reflective of disease severity and correlates well with the indices of systolic and diastolic dysfunction. Native T1 is useful for not only diagnosis, but also quantification of the amyloidosis burden and monitoring of disease progression (99100). In amyloidosis, ECV is also a potentially useful parameter that enables direct measurement of the amyloid burden and serves as an early marker for diagnosis, disease monitoring, and prognosis. In a recent study, Banypersad et al. (99) demonstrated that native T1 values > 1044 ms and ECV values > 45% were associated with hazard ratios for death of 3.84 (95% confidence interval [CI], 1.53–9.61) and 5.39 (95% CI, 1.24–23.4), respectively. Therefore, measurement of native myocardial T1 and ECV values facilitates the risk stratification of patients with cardiac amyloidosis. However, T2 values do not exhibit significant changes with this condition and, therefore, would not provide much diagnostic assistance (101).

Myocarditis

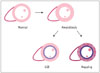
Myocarditis is an acute or chronic inflammatory process of the myocardium caused by various toxins, drugs, or infectious agents (63). Diagnosis of myocarditis is clinically challenging because its clinical symptoms are nonspecific and similar to those of other diseases such as the acute coronary syndrome. Approximately 75% of patients with acute chest pain and elevated serum troponin levels at presentation receive a diagnosis of acute myocarditis (102). However, such diagnoses were often made on a clinical basis because of the lack of a reliable noninvasive test (103). The LGE pattern associated with myocarditis is predominantly subepicardial and mid-wall (84.4%) in nature and localized most frequently to the lateral and inferior walls (104). However, LGE in myocarditis is often subtle. T1-mapping CMR imaging can be a useful noninvasive tool for the diagnosis of myocarditis. In particular, non-contrast mapping parameters such as T1 and T2 values are useful for the diagnosis of the disease (Fig. 11). In patients with myocarditis, native T1 values are significantly elevated as a result of the pathological processes of myocardial inflammation and edema (418105). Native T1 mapping imaging is superior to T2-weighted imaging and LGE and provides a high level of diagnostic accuracy and high positive and negative predictive values (18104). Native T1 imaging can detect myocardial abnormalities to a greater extent than T2-weighted imaging and LGE. The authors of a previous study suggested that native T1 imaging could discriminate between the acute and convalescent stages of myocarditis (18). The values of ECV also increase in patients with acute myocarditis. Radunski et al. (4) evaluated the accuracy of T1 mapping parameters in 104 patients with myocarditis. Quantification of ECV yielded the best diagnostic accuracy among all single CMR parameters including native T1 and post-contrast T1 and T2 values, ECV, and T2-weighted ratio. However, in another study, the diagnostic accuracy of ECV for myocarditis was not found to be superior to that of native T1 mapping (102106). Myocardial T2 mapping is another non-contrast quantitative imaging technique used for the evaluation of myocardial edema in patients with acute myocarditis, without the limitations associated with T2-weighted imaging (23). T2 mapping enables objective quantification of myocardial edema and is less sensitive to motion artifacts, surface-coil inhomogeneity, and subendocardial blood flow (22). A recent study found that myocardial T2 values are useful for differentiating acute myocarditis from recent-onset heart failure, where the native T1 and ECV values both exhibit an increase (107).

Ischemic Cardiomyopathy

Acute Myocardial Infarction

Myocardial infarction (MI) is defined by myocardial cell death due to ischemic insult. It is most commonly caused by coronary artery disease (108). MR imaging is useful in both diagnosis and risk stratification of AMI, based on the evaluation of infarct tissue (size, location, and transmurality), area at risk (AAR), microvascular obstruction (MVO), and hemorrhage. Historically, LGE has been the gold standard for the evaluation of infarcted myocardium, with several studies having validated its efficacy (109), and the black-blood T2-weighted IR technique is widely used for the detection of edema (110). However, T1 and T2 mapping techniques are emerging as useful tools for the evaluation of AMI.
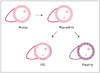
Native T1 imaging with an appropriate cut-off value is useful for the highly accurate detection of AMI. Native T1 imaging can detect acute myocardial edema because the free water content prolongs both T1 and T2 values (17). Native T1 imaging and T2 mapping provide similar quantitative results in the determination of AAR after AMI (15111). Native T1 mapping can differentiate MVO in infarcted myocardium; it is characterized by T1 values higher compared to those of remote myocardium but lower compared to those of infarcted myocardium (16112). T1 mapping can also provide information regarding the degree and severity of myocardial damage. Dall'Armellina et al. (112) reported a significant relationship between non-contrast T1 mapping and the degree of myocardial damage assessed by means of LGE or T2-weighted imaging and noted that T1 values could predict functional recovery after AMI. In patients with MI, native T1 imaging can detect intramyocardial hemorrhage, which exhibits a T1 shortening effect (21). Quantitative T2 mapping reliably identifies myocardial edema without the limitations associated with T2-weighted short tau IR imaging (22). For the evaluation of AAR, T2 mapping sequences exhibit good agreement with the AAR of a microsphere (15). In AMI, post-contrast T1 mapping can provide useful information regarding the size of the infarcted myocardium, which is evaluated on the basis of T1 shortening in the infarcted myocardium (16).
Evaluation of ECV by MR imaging provides a more stable measurement of the degree of fibrosis in both of infarcted and non-infarcted myocardium (113), which might be linked to adverse remodeling in cases of AMI (114).

Chronic Myocardial Infarction

In chronic MI (CMI), MR imaging plays useful roles in both diagnosis and risk stratification based on the evaluation of edema, scar size, complications, and LV remodeling. As is the case in AMI, LGE is the gold standard for the evaluation of infarcted myocardium in CMI (108). However, mapping techniques can provide valuable information regarding CMI. Native T1 and T2 mapping can differentiate chronic and acute MI based on the absence of myocardial edema (16). Myocardial edema resolves within 6 months after an acute insult. Given the very low T1 value of fatty tissue, native T1 mapping can detect areas of lipomatous metaplasia in CMI (115). Messroghli et al. (16) reported that pre-contrast T1 values lack accuracy with regard to CMI delineation. However, Kali et al. (116) reported that native T1 values could reliably characterize CMI during threshold-based detection at 3T. Scar size can be evaluated by T1 mapping and ECV. The post-contrast T1 mapping and ECV parameters allow the accurate detection of CMI based on an ECV cut-off value of 42% (117). Agreement between the infarct sizes measured by T1 mapping and delayed gadolinium imaging was higher for chronic infarcts than acute infarcts (16).

Other Cardiomyopathies

T1 and T2 mapping techniques are also useful for the diagnosis and management of other cardiomyopathies. T1 mapping is useful for the detection of subclinical myocardial changes, which are common in patients with autoimmune diseases such as systemic lupus erythematosus (118), systemic sclerosis (119), and rheumatoid arthritis (120). In patients with muscular dystrophies such as Duchenne and Becker muscular dystrophy, T1 mapping enables the early detection of cardiac involvement (121). Myocardial iron overload is characterized by a decrease in T1 values. T1 mapping is, therefore, useful for the quantification of cardiac iron (20). T2 mapping is useful in patients with cardiac transplants. In a pilot study, Usman et al. (26) demonstrated that quantitative T2 mapping is useful for the detection of myocardial edema consequent to acute rejection and suggested its use as a novel noninvasive tool for monitoring patients following transplantation. T1 and T2 mapping techniques are also useful for the detection of myocardial edema in patients with stress-related takotsubo cardiomyopathy (23).

CONCLUSION

T1 and T2 mapping are rapidly becoming robust techniques for application in patients with various cardiomyopathies. Currently, T1 and T2 mapping parameters play an important role in clinical decisions. Several studies have reported the efficacies of these techniques for the early and accurate diagnosis of cardiomyopathies. Further studies are required to prove the usefulness of these biomarkers for treatment monitoring and prognosis.

Figures and Tables

Fig. 1

Representative short-axis images of native T1, post-contrast T1 and T2, and extracellular volume fraction (ECV) maps of control subject.

Pixels in generated map represent corresponding T1, T2, and ECV values of regions of interest in myocardium or other cardiac structures. Myocardium and other cardiovascular structures each have tissue-specific T1, T2, and ECV values.
kjr-18-113-g001
Fig. 2

Apparent T1* and true T1 recovery.

Comparison of longitudinal magnetization using standard inversion recovery and Look–Locker (LL) T1 mapping methods. With LL method, T1 recovery to steady state is achieved more rapidly and often denoted as apparent T1 (T1*). IR = inversion recovery, RF = radiofrequency
kjr-18-113-g002
Fig. 3

Modified Look–Locker inversion recovery (MOLLI) with 5(3)3 protocol.

MOLLI method features several modifications intended to improve accuracy and precision. This protocol employs two inversions and acquires three or five images after first and second inversions, with three RR intervals for T1 recovery. Images are sorted according to inversion time to perform pixel-wise three-parameter fitting. ECG = electrocardiogram, RR = the time interval between two consecutive R waves in the electrocardiogram, SSFP = steady-state free precession
kjr-18-113-g003
Fig. 4

Shortened modified Look–Locker inversion recovery (ShMOLLI).

ShMOLLI method employs conditional analysis algorithm that can distinguish between short and long T1 values using curve-fitting errors and, therefore, features shorter scan time than original MOLLI. Long T1 samples use set of samples from first inversion to estimate T1, whereas short T1 samples use set of samples from all inversions. ECG = electrocardiogram, SSFP = steady-state free precession, TI = Inversion time
kjr-18-113-g004
Fig. 5

Saturation recovery single shot (SASHA).

SASHA method acquires data at successive heartbeats by saturation recovery over RR-interval at different saturation times, using initial unperturbed image. Accuracy and precision depend on choice of two- or three-parameter fitting model. ECG = electrocardiogram, RR = the time inverval between two consecutive R waves in the electrocardiogram
kjr-18-113-g005
Fig. 6

T2 mapping scheme with T2 preparation modules.

T2-weighted images are acquired with different T2 preparation times, with same trigger delay time (TD), to ensure same cardiac cycle phase during breath-hold. T1 recovery time is needed to allow complete T1 recovery. This preparation module employs 90° and 180° pulses to create T2 decay via spin-spin relaxation during T2 preparation time. Module concludes with spoiler gradient for removal of residual transverse magnetization. ECG = electrocardiogram, GRE = gradient echo, SSFP = steady-state free precession
kjr-18-113-g006
Fig. 7

T1 mapping in dilated cardiomyopathy (DCM).

DCM is characterized by ventricular dilation and systolic dysfunction without other loading conditions. Approximately 30% of patients with DCM exhibit mid-wall late gadolinium enhancement (LGE) in regions that do not correspond to coronary artery territories. This imaging characteristic is known to be prognostic factor for DCM. However, many patients do not exhibit LGE—they usually present with increased native T1 and extracellular volume fraction values in areas without LGE. T1 mapping can detect diffuse myocardial abnormalities in areas that appear normal on LGE sequences.
kjr-18-113-g007
Fig. 8

T1 mapping in hypertrophic cardiomyopathy (HCMP).

HCMP is cardiac muscle disease characterized by abnormal left ventricle hypertrophy (LVH) in absence of another cause of LVH. Multifocal late gadolinium enhancement (LGE) is usually observed in hypertrophied muscles. T1 mapping can detect myocardial abnormalities in areas that do not exhibit LGE.
kjr-18-113-g008
Fig. 9

T1 mapping in Fabry disease (FD).

Left ventricle hypertrophy and late gadolinium enhancement (LGE) of inferolateral left ventricle wall are characteristic features of FD. However, only 50% of patients with FD exhibit LGE. In T1 mapping, decrease in septal native T1 value is characteristic feature that distinguishes FD from other cardiomyopathies.
kjr-18-113-g009
Fig. 10

T1 and T2 mapping in amyloidosis.

Global, circumferential, subendocardial late gadolinium enhancement (LGE) with distribution in non-coronary arterial territory is hallmark of amyloidosis. However, characteristic LGE patterns do not always occur. In patients with amyloidosis, marked elevations in native T1 and extracellular volume fraction values are characteristic imaging features, which do not overlap with those of other diseases. However, T2 values are not increased in patients with amyloidosis.
kjr-18-113-g010
Fig. 11

T1 and T2 mapping in myocarditis.

Late gadolinium enhancement (LGE) pattern in myocarditis is usually observed on lateral inferior wall of left ventricle, with subepicardial and mid-wall distribution. Non-contrast mapping parameters and T1 and T2 values are useful for diagnosis of myocarditis.
kjr-18-113-g011
Table 1

Reference T1 Mapping Values According to Acquisition Sequence and Field Strength

kjr-18-113-i001
Magnetic Field (Tesla) T1 Mapping (Ref.) Pattern TR (ms) TE (ms) FA (°) Voxel Size (mm3) Acceleration Imaging Study Population Native T1 Value (ms) Post-Contrast T1 Value (ms) ECV Contrast Media
1.5T LL (52) - 2.2 1.1 50 2.1 × 2.2 × 8 GRAPPA = 2 14 healthy volunteers 57% male, 38 ± 10.9 years 1000.4 ± 126 984 ± 28 - Magnevist® (Bayer) 0.14–0.2 mmoL/kg
MOLLI (52) 3(3)3(3)5 2.2 1.1 35 1.9 × 2.2 × 8 Turbo factor = 8 14 healthy volunteers 57% male, 38 ± 10.9 years 1029.4 ± 56.8 418.1 ± 70.2 - Magnevist® (Bayer) 0.14–0.2 mmoL/kg
MOLLI (58) Pre-contrast mapping: 5(3)3 3.1 1.5 35 1.9 × 2.5 × 8 SENSE = 2 7 healthy volunteers 57% male, 38 ± 19 years 1052 ± 41 - ~0.27 MultiHance (Bracco) 0.1 mmoL/kg
Post-contrast mapping: 4(1)3(1)2
ShMOLLI (58) 5(1)1(1)1 3.1 1.5 35 1.9 × 2.5 × 8 SENSE = 2 7 healthy volunteers 57% male, 38 ± 19 years 959 ± 56 - ~0.26 MultiHance (Bracco) 0.1 mmoL/kg
SASHA (58) - 3.1 1.5 70 1.9 × 2.5 × 8 SENSE = 2 7 healthy volunteers 57% male, 38 ± 19 years 1202 ± 56 - ~0.18 MultiHance (Bracco) 0.1 mmoL/kg
SASHA (7) - 2.6 1.3 70 2.5 × 1.85 × 8 GRAPPA = 2 10 healthy volunteers 60% male, 54 ± 6 years 1170 ± 9 568 ± 40 - Magnevist® (Bayer) 0.15 mmoL/kg
MOLLI (11) 3(3)3(3)5 3.3 1.64 50 1.8 × 1.8 × 8 SENSE = 2 34 healthy volunteers 53% male, 41 ± 17 years 930 ± 21 415 ± 11 0.25 ± 0.04 Gadovist® (Bayer) 0.1, 0.15, or 0.2 mmoL/kg
ShMOLLI (2) 5(1)1(1)1 1.9–2.2 1.0–1.07 35 1.8 × 1.8 × 8.0 GRAPPA = 2 342 healthy volunteers 50% male, 11–69 years 962 ± 25 - - -
MOLLI (122) 3(3)3(3)5 2.8 1.2 35 2.2 × 1.4 × 8.0 GRAPPA = 2 40 healthy volunteers 50% male, 20–35 years 984 ± 28 - - -
3T MOLLI (28) 3(3)3(3)5 2.6–2.7 1.0–1.1 35 1.6–1.8 × 1.6–1.8 × 8 GRAPPA = 2 60 healthy volunteers 50% male, 20–80 years 1158.7 411.2 - Gadovist® (Bayer) 0.1, 0.15, or 0.2 mmoL/kg
MOLLI (11) 3(3)3(3)5 3.3 1.64 50 1.8 × 1.8 × 8 SENSE = 2 32 healthy volunteers 53% male, 41 ± 17 years 1052 ± 23 421 ± 13 0.26 ± 0.04 Gadovist® (Bayer) 0.1, 0.15, or 0.2 mmoL/kg

ECV = extracellular volume fraction, FA = flip angle, GRAPPA = generalized autocalibrating partially parallel acquisition, LL = Look-Locker, MOLLI = modified Look-Locker inversion recovery, SASHA = saturation recovery single shot acquisition, SENSE = sensitivity encoding for fast MRI, ShMOLLI = shortened MOLLI, TE = echo time, TR = repetition time

Table 2

Imaging Parameters of T1 and T2 Mapping Sequences

kjr-18-113-i002
Sequence T1 Mapping (Ref.) T2 Mapping (Ref.)
MOLLI (7) MOLLI (10) ShMOLLI (5) SASHA (6) T2p-SSFP (5) T2p-SSFP (59)
Magnetic field 1.5T 3T 1.5T and 3T 1.5T 1.5T 3T
Preparation Non-selective inversion recovery Non-selective inversion recovery Non-selective inversion recovery Non-selective saturation recovery Non-selective T2-preparation Non-selective T2-preparation
Flip angle 35° 35° 35° 70° 40° 70°
Image matrix 192 × 128 256 × 180 144 × 192 108 × 192 96 × 160 176 × 144
Acquisition Single shot SSFP Single shot SSFP Single shot SSFP Single shot SSFP Single shot SSFP Single shot SSFP
Bandwidth (Hz/pixel) 1090 1045–1028 1090 1090 1488 1093
Parallel acquisition SENSE/2 GRAPPA/2 GRAPPA/2 GRAPPA/2 GRAPPA/2 GRAPPA/2
Slice thickness TI increment 8 mm 6 mm 8 mm 8 mm 8 mm 6 mm
TI increment 80 ms - 80 ms 76 ms NA NA
Acquisition window 202 ms - 206 ms 175 ms - -
T2-prep time NA NA NA NA 0, 24, 55 (ms) 0, 24, 55 (ms)
Inversion/ saturation 3 3 3 9 NA NA
Acquisition heartbeats 3, 3, 5 3, 3, 5 5, 1, 1 10 3 3
Recovery heartbeats 3, 3, 1 3, 3, 1 1, 1, 1 0 4 4
Acquisition time 17 RR 17 RR 9 RR 10 RR 7 RR 7 RR
TI/saturation time 100 ms 91 ms 100 ms 119–885 ms NA NA
Echo spacing 2.5 ms 2.6–2.7 ms 2.14 ms 2.6 ms 2.6 ms 2.4 ms

GRAPPA = generalized autocalibrating partially parallel acquisition, MOLLI = modified Look-Locker inversion recovery, NA = not applicable, RR = the time inverval between two consecutive R waves in the electrocardiogram, SASHA = saturation recovery single shot acquisition, SENSE = sensitivity encoding for fast MRI, ShMOLLI = shortened MOLLI, SSFP = steady-state free precession, TI = inversion time

Acknowledgments

We are pleased to acknowledge Ms. Inseon Park who illustrated FigureS 7, 8, 9, 10, 11.

Notes

This study was supported by a Basic Science Research Program through the National Research Foundation of Korea (NRF), funded by the Ministry of Science, ICT, and Future Planning (NRF-2014R1A1A3050905).

References

1. Yoon YE, Hong YJ, Kim HK, Kim JA, Na JO, Yang DH, et al. 2014 Korean guidelines for appropriate utilization of cardiovascular magnetic resonance imaging: a joint report of the Korean Society of Cardiology and the Korean Society of Radiology. Korean J Radiol. 2014; 15:659–688.
2. Piechnik SK, Ferreira VM, Lewandowski AJ, Ntusi NA, Banerjee R, Holloway C, et al. Normal variation of magnetic resonance T1 relaxation times in the human population at 1.5 T using ShMOLLI. J Cardiovasc Magn Reson. 2013; 15:13.
3. Mewton N, Liu CY, Croisille P, Bluemke D, Lima JA. Assessment of myocardial fibrosis with cardiovascular magnetic resonance. J Am Coll Cardiol. 2011; 57:891–903.
4. Radunski UK, Lund GK, Stehning C, Schnackenburg B, Bohnen S, Adam G, et al. CMR in patients with severe myocarditis: diagnostic value of quantitative tissue markers including extracellular volume imaging. JACC Cardiovasc Imaging. 2014; 7:667–675.
5. Moon JC, Messroghli DR, Kellman P, Piechnik SK, Robson MD, Ugander M, et al. Myocardial T1 mapping and extracellular volume quantification: a Society for Cardiovascular Magnetic Resonance (SCMR) and CMR Working Group of the European Society of Cardiology consensus statement. J Cardiovasc Magn Reson. 2013; 15:92.
6. Piechnik SK, Ferreira VM, Dall'Armellina E, Cochlin LE, Greiser A, Neubauer S, et al. Shortened Modified Look-Locker Inversion recovery (ShMOLLI) for clinical myocardial T1-mapping at 1.5 and 3 T within a 9 heartbeat breathhold. J Cardiovasc Magn Reson. 2010; 12:69.
7. Chow K, Flewitt JA, Green JD, Pagano JJ, Friedrich MG, Thompson RB. Saturation recovery single-shot acquisition (SASHA) for myocardial T(1) mapping. Magn Reson Med. 2014; 71:2082–2095.
8. Messroghli DR, Greiser A, Fröhlich M, Dietz R, Schulz-Menger J. Optimization and validation of a fully-integrated pulse sequence for modified Look-Locker inversion-recovery (MOLLI) T1 mapping of the heart. J Magn Reson Imaging. 2007; 26:1081–1086.
9. Maestrini V, Treibel TA, White SK, Fontana M, Moon JC. T1 mapping for characterization of intracellular and extracellular myocardial diseases in heart failure. Curr Cardiovasc Imaging Rep. 2014; 7:9287.
10. Kellman P, Hansen MS. T1-mapping in the heart: accuracy and precision. J Cardiovasc Magn Reson. 2014; 16:2.
11. Dabir D, Child N, Kalra A, Rogers T, Gebker R, Jabbour A, et al. Reference values for healthy human myocardium using a T1 mapping methodology: results from the International T1 multicenter cardiovascular magnetic resonance study. J Cardiovasc Magn Reson. 2014; 16:69.
12. Karamitsos TD, Piechnik SK, Banypersad SM, Fontana M, Ntusi NB, Ferreira VM, et al. Noncontrast T1 mapping for the diagnosis of cardiac amyloidosis. JACC Cardiovasc Imaging. 2013; 6:488–497.
13. Bull S, White SK, Piechnik SK, Flett AS, Ferreira VM, Loudon M, et al. Human non-contrast T1 values and correlation with histology in diffuse fibrosis. Heart. 2013; 99:932–937.
14. Dass S, Suttie JJ, Piechnik SK, Ferreira VM, Holloway CJ, Banerjee R, et al. Myocardial tissue characterization using magnetic resonance noncontrast t1 mapping in hypertrophic and dilated cardiomyopathy. Circ Cardiovasc Imaging. 2012; 5:726–733.
15. Ugander M, Bagi PS, Oki AJ, Chen B, Hsu LY, Aletras AH, et al. Myocardial edema as detected by pre-contrast T1 and T2 CMR delineates area at risk associated with acute myocardial infarction. JACC Cardiovasc Imaging. 2012; 5:596–603.
16. Messroghli DR, Walters K, Plein S, Sparrow P, Friedrich MG, Ridgway JP, et al. Myocardial T1 mapping: application to patients with acute and chronic myocardial infarction. Magn Reson Med. 2007; 58:34–40.
17. Ferreira VM, Piechnik SK, Dall'Armellina E, Karamitsos TD, Francis JM, Choudhury RP, et al. Non-contrast T1-mapping detects acute myocardial edema with high diagnostic accuracy: a comparison to T2-weighted cardiovascular magnetic resonance. J Cardiovasc Magn Reson. 2012; 14:42.
18. Hinojar R, Foote L, Arroyo Ucar E, Jackson T, Jabbour A, Yu CY, et al. Native T1 in discrimination of acute and convalescent stages in patients with clinical diagnosis of myocarditis: a proposed diagnostic algorithm using CMR. JACC Cardiovasc Imaging. 2015; 8:37–46.
19. Sado DM, White SK, Piechnik SK, Banypersad SM, Treibel T, Captur G, et al. Identification and assessment of Anderson-Fabry disease by cardiovascular magnetic resonance noncontrast myocardial T1 mapping. Circ Cardiovasc Imaging. 2013; 6:392–398.
20. Sado DM, Maestrini V, Piechnik SK, Banypersad SM, White SK, Flett AS, et al. Noncontrast myocardial T1 mapping using cardiovascular magnetic resonance for iron overload. J Magn Reson Imaging. 2015; 41:1505–1511.
21. Pedersen SF, Thrysøe SA, Robich MP, Paaske WP, Ringgaard S, Bøtker HE, et al. Assessment of intramyocardial hemorrhage by T1-weighted cardiovascular magnetic resonance in reperfused acute myocardial infarction. J Cardiovasc Magn Reson. 2012; 14:59.
22. Verhaert D, Thavendiranathan P, Giri S, Mihai G, Rajagopalan S, Simonetti OP, et al. Direct T2 quantification of myocardial edema in acute ischemic injury. JACC Cardiovasc Imaging. 2011; 4:269–278.
23. Thavendiranathan P, Walls M, Giri S, Verhaert D, Rajagopalan S, Moore S, et al. Improved detection of myocardial involvement in acute inflammatory cardiomyopathies using T2 mapping. Circ Cardiovasc Imaging. 2012; 5:102–110.
24. Roller FC, Harth S, Schneider C, Krombach GA. T1, T2 Mapping and Extracellular Volume Fraction (ECV): application, value and further perspectives in myocardial inflammation and cardiomyopathies. Rofo. 2015; 187:760–770.
25. Crouser ED, Ono C, Tran T, He X, Raman SV. Improved detection of cardiac sarcoidosis using magnetic resonance with myocardial T2 mapping. Am J Respir Crit Care Med. 2014; 189:109–112.
26. Usman AA, Taimen K, Wasielewski M, McDonald J, Shah S, Giri S, et al. Cardiac magnetic resonance T2 mapping in the monitoring and follow-up of acute cardiac transplant rejection: a pilot study. Circ Cardiovasc Imaging. 2012; 5:782–790.
27. Giri S, Shah S, Xue H, Chung YC, Pennell ML, Guehring J, et al. Myocardial T2 mapping with respiratory navigator and automatic nonrigid motion correction. Magn Reson Med. 2012; 68:1570–1578.
28. von Knobelsdorff-Brenkenhoff F, Prothmann M, Dieringer MA, Wassmuth R, Greiser A, Schwenke C, et al. Myocardial T1 and T2 mapping at 3 T: reference values, influencing factors and implications. J Cardiovasc Magn Reson. 2013; 15:53.
29. Moon JC, Treibel TA, Schelbert EB. T1 mapping for diffuse myocardial fibrosis: a key biomarker in cardiac disease? J Am Coll Cardiol. 2013; 62:1288–1289.
30. Barison A, Grigoratos C, Todiere G, Aquaro GD. Myocardial interstitial remodelling in non-ischaemic dilated cardiomyopathy: insights from cardiovascular magnetic resonance. Heart Fail Rev. 2015; 20:731–749.
31. Perea RJ, Ortiz-Perez JT, Sole M, Cibeira MT, de Caralt TM, Prat-Gonzalez S, et al. T1 mapping: characterisation of myocardial interstitial space. Insights Imaging. 2015; 6:189–202.
32. de Jong S, van Veen TA, de Bakker JM, Vos MA, van Rijen HV. Biomarkers of myocardial fibrosis. J Cardiovasc Pharmacol. 2011; 57:522–535.
33. Miller CA, Naish JH, Bishop P, Coutts G, Clark D, Zhao S, et al. Comprehensive validation of cardiovascular magnetic resonance techniques for the assessment of myocardial extracellular volume. Circ Cardiovasc Imaging. 2013; 6:373–383.
34. Schelbert EB, Testa SM, Meier CG, Ceyrolles WJ, Levenson JE, Blair AJ, et al. Myocardial extravascular extracellular volume fraction measurement by gadolinium cardiovascular magnetic resonance in humans: slow infusion versus bolus. J Cardiovasc Magn Reson. 2011; 13:16.
35. Flett AS, Hayward MP, Ashworth MT, Hansen MS, Taylor AM, Elliott PM, et al. Equilibrium contrast cardiovascular magnetic resonance for the measurement of diffuse myocardial fibrosis: preliminary validation in humans. Circulation. 2010; 122:138–144.
36. Flett AS, Sado DM, Quarta G, Mirabel M, Pellerin D, Herrey AS, et al. Diffuse myocardial fibrosis in severe aortic stenosis: an equilibrium contrast cardiovascular magnetic resonance study. Eur Heart J Cardiovasc Imaging. 2012; 13:819–826.
37. Barison A, Del Torto A, Chiappino S, Aquaro GD, Todiere G, Vergaro G, et al. Prognostic significance of myocardial extracellular volume fraction in nonischaemic dilated cardiomyopathy. J Cardiovasc Med (Hagerstown). 2015; 16:681–687.
38. White SK, Sado DM, Flett AS, Moon JC. Characterising the myocardial interstitial space: the clinical relevance of non-invasive imaging. Heart. 2012; 98:773–779.
39. Ugander M, Oki AJ, Hsu LY, Kellman P, Greiser A, Aletras AH, et al. Extracellular volume imaging by magnetic resonance imaging provides insights into overt and sub-clinical myocardial pathology. Eur Heart J. 2012; 33:1268–1278.
40. Kellman P, Arai AE, Xue H. T1 and extracellular volume mapping in the heart: estimation of error maps and the influence of noise on precision. J Cardiovasc Magn Reson. 2013; 15:56.
41. White SK, Sado DM, Fontana M, Banypersad SM, Maestrini V, Flett AS, et al. T1 mapping for myocardial extracellular volume measurement by CMR: bolus only versus primed infusion technique. JACC Cardiovasc Imaging. 2013; 6:955–962.
42. Liu CY, Liu YC, Wu C, Armstrong A, Volpe GJ, van der Geest RJ, et al. Evaluation of age-related interstitial myocardial fibrosis with cardiac magnetic resonance contrast-enhanced T1 mapping: MESA (Multi-Ethnic Study of Atherosclerosis). J Am Coll Cardiol. 2013; 62:1280–1287.
43. Mongeon FP, Jerosch-Herold M, Coelho-Filho OR, Blankstein R, Falk RH, Kwong RY. Quantification of extracellular matrix expansion by CMR in infiltrative heart disease. JACC Cardiovasc Imaging. 2012; 5:897–907.
44. Messroghli DR, Plein S, Higgins DM, Walters K, Jones TR, Ridgway JP, et al. Human myocardium: single-breath-hold MR T1 mapping with high spatial resolution--reproducibility study. Radiology. 2006; 238:1004–1012.
45. Pykett IL, Rosen BR, Buonanno FS, Brady TJ. Measurement of spin-lattice relaxation times in nuclear magnetic resonance imaging. Phys Med Biol. 1983; 28:723–729.
46. Zhang Y, Yeung HN, O'Donnell M, Carson PL. Determination of sample time for T1 measurement. J Magn Reson Imaging. 1998; 8:675–681.
47. Look DC, Locker DR. Time saving in measurement of NMR and EPR relaxation times. Rev Sci Instrum. 1970; 41:250–251.
48. Messroghli DR, Radjenovic A, Kozerke S, Higgins DM, Sivananthan MU, Ridgway JP. Modified Look-Locker inversion recovery (MOLLI) for high-resolution T1 mapping of the heart. Magn Reson Med. 2004; 52:141–146.
49. Weingärtner S, Akçakaya M, Basha T, Kissinger KV, Goddu B, Berg S, et al. Combined saturation/inversion recovery sequences for improved evaluation of scar and diffuse fibrosis in patients with arrhythmia or heart rate variability. Magn Reson Med. 2014; 71:1024–1034.
50. Deichmann R, Haase A. Quantification of T1 values by SNAPSHOT-FLASH NMR imaging. J Magn Reson (1969). 1992; 96:608–612.
51. Hamlin SA, Henry TS, Little BP, Lerakis S, Stillman AE. Mapping the future of cardiac MR imaging: case-based review of T1 and T2 mapping techniques. Radiographics. 2014; 34:1594–1611.
52. Nacif MS, Turkbey EB, Gai N, Nazarian S, van der Geest RJ, Noureldin RA, et al. Myocardial T1 mapping with MRI: comparison of Look-Locker and MOLLI sequences. J Magn Reson Imaging. 2011; 34:1367–1373.
53. Gai N, Turkbey EB, Nazarian S, van der Geest RJ, Liu CY, Lima JA, et al. T1 mapping of the gadolinium-enhanced myocardium: adjustment for factors affecting interpatient comparison. Magn Reson Med. 2011; 65:1407–1415.
54. Kellman P, Wilson JR, Xue H, Ugander M, Arai AE. Extracellular volume fraction mapping in the myocardium, part 1: evaluation of an automated method. J Cardiovasc Magn Reson. 2012; 14:63.
55. Kellman P, Xue H, Chow K, Spottiswoode BS, Arai AE, Thompson RB. Optimized saturation recovery protocols for T1-mapping in the heart: influence of sampling strategies on precision. J Cardiovasc Magn Reson. 2014; 16:55.
56. Chow K, Spottiswoode BS, Pagano JJ, Thompson RB. Improved precision in SASHA T1 mapping with a variable flip angle readout. J Cardiovasc Magn Reson. 2014; 16:Suppl 1. M9.
57. Chow K, Kellman P, Spottiswoode BS, Nielles-Vallespin S, Arai AE, Salerno M, et al. Saturation pulse design for quantitative myocardial T1 mapping. J Cardiovasc Magn Reson. 2015; 17:84.
58. Roujol S, Weingärtner S, Foppa M, Chow K, Kawaji K, Ngo LH, et al. Accuracy, precision, and reproducibility of four T1 mapping sequences: a head-to-head comparison of MOLLI, ShMOLLI, SASHA, and SAPPHIRE. Radiology. 2014; 272:683–689.
59. Giri S, Chung YC, Merchant A, Mihai G, Rajagopalan S, Raman SV, et al. T2 quantification for improved detection of myocardial edema. J Cardiovasc Magn Reson. 2009; 11:56.
60. Abdel-Aty H, Simonetti O, Friedrich MG. T2-weighted cardiovascular magnetic resonance imaging. J Magn Reson Imaging. 2007; 26:452–459.
61. Foltz WD, Al-Kwifi O, Sussman MS, Stainsby JA, Wright GA. Optimized spiral imaging for measurement of myocardial T2 relaxation. Magn Reson Med. 2003; 49:1089–1097.
62. Iles L, Pfluger H, Phrommintikul A, Cherayath J, Aksit P, Gupta SN, et al. Evaluation of diffuse myocardial fibrosis in heart failure with cardiac magnetic resonance contrast-enhanced T1 mapping. J Am Coll Cardiol. 2008; 52:1574–1580.
63. Maron BJ, Towbin JA, Thiene G, Antzelevitch C, Corrado D, Arnett D, et al. Contemporary definitions and classification of the cardiomyopathies: an American Heart Association Scientific Statement from the Council on Clinical Cardiology, Heart Failure and Transplantation Committee; Quality of Care and Outcomes Research and Functional Genomics and Translational Biology Interdisciplinary Working Groups; and Council on Epidemiology and Prevention. Circulation. 2006; 113:1807–1816.
64. Hong YJ, Park CH, Kim YJ, Hur J, Lee HJ, Hong SR, et al. Extracellular volume fraction in dilated cardiomyopathy patients without obvious late gadolinium enhancement: comparison with healthy control subjects. Int J Cardiovasc Imaging. 2015; 31:Suppl 1. 115–122.
65. Sun Y, Weber KT. Cardiac remodelling by fibrous tissue: role of local factors and circulating hormones. Ann Med. 1998; 30:Suppl 1. 3–8.
66. McCrohon JA, Moon JC, Prasad SK, McKenna WJ, Lorenz CH, Coats AJ, et al. Differentiation of heart failure related to dilated cardiomyopathy and coronary artery disease using gadolinium-enhanced cardiovascular magnetic resonance. Circulation. 2003; 108:54–59.
67. Assomull RG, Prasad SK, Lyne J, Smith G, Burman ED, Khan M, et al. Cardiovascular magnetic resonance, fibrosis, and prognosis in dilated cardiomyopathy. J Am Coll Cardiol. 2006; 48:1977–1985.
68. Wu KC, Weiss RG, Thiemann DR, Kitagawa K, Schmidt A, Dalal D, et al. Late gadolinium enhancement by cardiovascular magnetic resonance heralds an adverse prognosis in nonischemic cardiomyopathy. J Am Coll Cardiol. 2008; 51:2414–2421.
69. Gulati A, Jabbour A, Ismail TF, Guha K, Khwaja J, Raza S, et al. Association of fibrosis with mortality and sudden cardiac death in patients with nonischemic dilated cardiomyopathy. JAMA. 2013; 309:896–908.
70. Kim EK, Chattranukulchai P, Klem I. Cardiac magnetic resonance scar imaging for sudden cardiac death risk stratification in patients with non-ischemic cardiomyopathy. Korean J Radiol. 2015; 16:683–695.
71. Puntmann VO, Voigt T, Chen Z, Mayr M, Karim R, Rhode K, et al. Native T1 mapping in differentiation of normal myocardium from diffuse disease in hypertrophic and dilated cardiomyopathy. JACC Cardiovasc Imaging. 2013; 6:475–484.
72. Yoon JH, Son JW, Chung H, Park CH, Kim YJ, Chang HJ, et al. Relationship between myocardial extracellular space expansion estimated with post-contrast T1 mapping MRI and left ventricular remodeling and neurohormonal activation in patients with dilated cardiomyopathy. Korean J Radiol. 2015; 16:1153–1162.
73. Mordi I, Carrick D, Bezerra H, Tzemos N. T1 and T2 mapping for early diagnosis of dilated non-ischaemic cardiomyopathy in middle-aged patients and differentiation from normal physiological adaptation. Eur Heart J Cardiovasc Imaging. 2016; 17:797–803.
74. Nishii T, Kono AK, Shigeru M, Takamine S, Fujiwara S, Kyotani K, et al. Cardiovascular magnetic resonance T2 mapping can detect myocardial edema in idiopathic dilated cardiomyopathy. Int J Cardiovasc Imaging. 2014; 30:Suppl 1. 65–72.
75. Jeserich M, Föll D, Olschewski M, Kimmel S, Friedrich MG, Bode C, et al. Evidence of myocardial edema in patients with nonischemic dilated cardiomyopathy. Clin Cardiol. 2012; 35:371–376.
76. aus dem Siepen F, Buss SJ, Messroghli D, Andre F, Lossnitzer D, Seitz S, et al. T1 mapping in dilated cardiomyopathy with cardiac magnetic resonance: quantification of diffuse myocardial fibrosis and comparison with endomyocardial biopsy. Eur Heart J Cardiovasc Imaging. 2015; 16:210–216.
77. Sado DM, Flett AS, Banypersad SM, White SK, Maestrini V, Quarta G, et al. Cardiovascular magnetic resonance measurement of myocardial extracellular volume in health and disease. Heart. 2012; 98:1436–1441.
78. Kono AK, Croisille P, Nishii T, Nishiyama K, Kyotani K, Shigeru M, et al. Cardiovascular magnetic resonance tagging imaging correlates with myocardial dysfunction and T2 mapping in idiopathic dilated cardiomyopathy. Int J Cardiovasc Imaging. 2014; 30:Suppl 2. 145–152.
79. Wong TC, Piehler K, Meier CG, Testa SM, Klock AM, Aneizi AA, et al. Association between extracellular matrix expansion quantified by cardiovascular magnetic resonance and short-term mortality. Circulation. 2012; 126:1206–1216.
80. Wong TC, Piehler KM, Kang IA, Kadakkal A, Kellman P, Schwartzman DS, et al. Myocardial extracellular volume fraction quantified by cardiovascular magnetic resonance is increased in diabetes and associated with mortality and incident heart failure admission. Eur Heart J. 2014; 35:657–664.
81. Maron BJ. Hypertrophic cardiomyopathy: a systematic review. JAMA. 2002; 287:1308–1320.
82. Ho CY, López B, Coelho-Filho OR, Lakdawala NK, Cirino AL, Jarolim P, et al. Myocardial fibrosis as an early manifestation of hypertrophic cardiomyopathy. N Engl J Med. 2010; 363:552–563.
83. Małek ŁA, Werys K, Kłopotowski M, Śpiewak M, Miłosz-Wieczorek B, Mazurkiewicz Ł, et al. Native T1-mapping for non-contrast assessment of myocardial fibrosis in patients with hypertrophic cardiomyopathy--comparison with late enhancement quantification. Magn Reson Imaging. 2015; 33:718–724.
84. Ellims AH, Iles LM, Ling LH, Hare JL, Kaye DM, Taylor AJ, et al. Diffuse myocardial fibrosis in hypertrophic cardiomyopathy can be identified by cardiovascular magnetic resonance, and is associated with left ventricular diastolic dysfunction. J Cardiovasc Magn Reson. 2012; 14:76.
85. Ho CY, Abbasi SA, Neilan TG, Shah RV, Chen Y, Heydari B, et al. T1 measurements identify extracellular volume expansion in hypertrophic cardiomyopathy sarcomere mutation carriers with and without left ventricular hypertrophy. Circ Cardiovasc Imaging. 2013; 6:415–422.
86. O'Mahony C, Elliott P. Anderson-Fabry disease and the heart. Prog Cardiovasc Dis. 2010; 52:326–335.
87. Moon JC, Sachdev B, Elkington AG, McKenna WJ, Mehta A, Pennell DJ, et al. Gadolinium enhanced cardiovascular magnetic resonance in Anderson-Fabry disease. Evidence for a disease specific abnormality of the myocardial interstitium. Eur Heart J. 2003; 24:2151–2155.
88. Pica S, Sado DM, Maestrini V, Fontana M, White SK, Treibel T, et al. Reproducibility of native myocardial T1 mapping in the assessment of Fabry disease and its role in early detection of cardiac involvement by cardiovascular magnetic resonance. J Cardiovasc Magn Reson. 2014; 16:99.
89. Thompson RB, Chow K, Khan A, Chan A, Shanks M, Paterson I, et al. T1 mapping with cardiovascular MRI is highly sensitive for Fabry disease independent of hypertrophy and sex. Circ Cardiovasc Imaging. 2013; 6:637–645.
90. Falk RH, Comenzo RL, Skinner M. The systemic amyloidoses. N Engl J Med. 1997; 337:898–909.
91. Ruberg FL. T1 mapping in cardiac amyloidosis: can we get there from here? JACC Cardiovasc Imaging. 2013; 6:498–500.
92. Kyle RA, Greipp PR, O'Fallon WM. Primary systemic amyloidosis: multivariate analysis for prognostic factors in 168 cases. Blood. 1986; 68:220–224.
93. Banypersad SM, Sado DM, Flett AS, Gibbs SD, Pinney JH, Maestrini V, et al. Quantification of myocardial extracellular volume fraction in systemic AL amyloidosis: an equilibrium contrast cardiovascular magnetic resonance study. Circ Cardiovasc Imaging. 2013; 6:34–39.
94. Falk RH, Skinner M. The systemic amyloidoses: an overview. Adv Intern Med. 2000; 45:107–137.
95. Maceira AM, Prasad SK, Hawkins PN, Roughton M, Pennell DJ. Cardiovascular magnetic resonance and prognosis in cardiac amyloidosis. J Cardiovasc Magn Reson. 2008; 10:54.
96. Brooks J, Kramer CM, Salerno M. Markedly increased volume of distribution of gadolinium in cardiac amyloidosis demonstrated by T1 mapping. J Magn Reson Imaging. 2013; 38:1591–1595.
97. Austin BA, Tang WH, Rodriguez ER, Tan C, Flamm SD, Taylor DO, et al. Delayed hyper-enhancement magnetic resonance imaging provides incremental diagnostic and prognostic utility in suspected cardiac amyloidosis. JACC Cardiovasc Imaging. 2009; 2:1369–1377.
98. Fontana M, Chung R, Hawkins PN, Moon JC. Cardiovascular magnetic resonance for amyloidosis. Heart Fail Rev. 2015; 20:133–144.
99. Banypersad SM, Fontana M, Maestrini V, Sado DM, Captur G, Petrie A, et al. T1 mapping and survival in systemic light-chain amyloidosis. Eur Heart J. 2015; 36:244–251.
100. Fontana M, Banypersad SM, Treibel TA, Maestrini V, Sado DM, White SK, et al. Native T1 mapping in transthyretin amyloidosis. JACC Cardiovasc Imaging. 2014; 7:157–165.
101. Sparrow P, Amirabadi A, Sussman MS, Paul N, Merchant N. Quantitative assessment of myocardial T2 relaxation times in cardiac amyloidosis. J Magn Reson Imaging. 2009; 30:942–946.
102. Luetkens JA, Doerner J, Thomas DK, Dabir D, Gieseke J, Sprinkart AM, et al. Acute myocarditis: multiparametric cardiac MR imaging. Radiology. 2014; 273:383–392.
103. Iles LM, Taylor AJ. Is one better than two?: T1 mapping in myocarditis. JACC Cardiovasc Imaging. 2013; 6:1059–1061.
104. Ferreira VM, Piechnik SK, Dall'Armellina E, Karamitsos TD, Francis JM, Ntusi N, et al. T(1) mapping for the diagnosis of acute myocarditis using CMR: comparison to T2-weighted and late gadolinium enhanced imaging. JACC Cardiovasc Imaging. 2013; 6:1048–1058.
105. Ferreira VM, Piechnik SK, Dall'Armellina E, Karamitsos TD, Francis JM, Ntusi N, et al. Native T1-mapping detects the location, extent and patterns of acute myocarditis without the need for gadolinium contrast agents. J Cardiovasc Magn Reson. 2014; 16:36.
106. Luetkens JA, Homsi R, Sprinkart AM, Doerner J, Dabir D, Kuetting DL, et al. Incremental value of quantitative CMR including parametric mapping for the diagnosis of acute myocarditis. Eur Heart J Cardiovasc Imaging. 2016; 17:154–161.
107. Bohnen S, Radunski UK, Lund GK, Kandolf R, Stehning C, Schnackenburg B, et al. Performance of T1 and T2 mapping cardiovascular magnetic resonance to detect active myocarditis in patients with recent-onset heart failure. Circ Cardiovasc Imaging. 2015; 8:e003073.
108. Rajiah P, Desai MY, Kwon D, Flamm SD. MR imaging of myocardial infarction. Radiographics. 2013; 33:1383–1412.
109. Arai AE. Magnetic resonance imaging for area at risk, myocardial infarction, and myocardial salvage. J Cardiovasc Pharmacol Ther. 2011; 16:313–320.
110. Friedrich MG, Kim HW, Kim RJ. T2-weighted imaging to assess post-infarct myocardium at risk. JACC Cardiovasc Imaging. 2011; 4:1014–1021.
111. Bulluck H, White SK, Rosmini S, Bhuva A, Treibel TA, Fontana M, et al. T1 mapping and T2 mapping at 3T for quantifying the area-at-risk in reperfused STEMI patients. J Cardiovasc Magn Reson. 2015; 17:73.
112. Dall'Armellina E, Piechnik SK, Ferreira VM, Si QL, Robson MD, Francis JM, et al. Cardiovascular magnetic resonance by non contrast T1-mapping allows assessment of severity of injury in acute myocardial infarction. J Cardiovasc Magn Reson. 2012; 14:15.
113. Choi EY, Hwang SH, Yoon YW, Park CH, Paek MY, Greiser A, et al. Correction with blood T1 is essential when measuring post-contrast myocardial T1 value in patients with acute myocardial infarction. J Cardiovasc Magn Reson. 2013; 15:11.
114. Chan W, Duffy SJ, White DA, Gao XM, Du XJ, Ellims AH, et al. Acute left ventricular remodeling following myocardial infarction: coupling of regional healing with remote extracellular matrix expansion. JACC Cardiovasc Imaging. 2012; 5:884–893.
115. Ferreira VM, Holloway CJ, Piechnik SK, Karamitsos TD, Neubauer S. Is it really fat? Ask a T1-map. Eur Heart J Cardiovasc Imaging. 2013; 14:1060.
116. Kali A, Choi EY, Sharif B, Kim YJ, Bi X, Spottiswoode B, et al. Native T1 Mapping by 3-T CMR Imaging for Characterization of Chronic Myocardial Infarctions. JACC Cardiovasc Imaging. 2015; 8:1019–1030.
117. Bauner KU, Biffar A, Theisen D, Greiser A, Zech CJ, Nguyen ET, et al. Extracellular volume fractions in chronic myocardial infarction. Invest Radiol. 2012; 47:538–545.
118. Puntmann VO, D'Cruz D, Smith Z, Pastor A, Choong P, Voigt T, et al. Native myocardial T1 mapping by cardiovascular magnetic resonance imaging in subclinical cardiomyopathy in patients with systemic lupus erythematosus. Circ Cardiovasc Imaging. 2013; 6:295–301.
119. Ntusi NA, Piechnik SK, Francis JM, Ferreira VM, Rai AB, Matthews PM, et al. Subclinical myocardial inflammation and diffuse fibrosis are common in systemic sclerosis--a clinical study using myocardial T1-mapping and extracellular volume quantification. J Cardiovasc Magn Reson. 2014; 16:21.
120. Ntusi NA, Piechnik SK, Francis JM, Ferreira VM, Matthews PM, Robson MD, et al. Diffuse myocardial fibrosis and inflammation in rheumatoid arthritis: insights from CMR T1 mapping. JACC Cardiovasc Imaging. 2015; 8:526–536.
121. Mavrogeni S, Markousis-Mavrogenis G, Papavasiliou A, Kolovou G. Cardiac involvement in Duchenne and Becker muscular dystrophy. World J Cardiol. 2015; 7:410–414.
122. Reiter U, Reiter G, Dorr K, Greiser A, Maderthaner R, Fuchsjäger M. Normal diastolic and systolic myocardial T1 values at 1.5-T MR imaging: correlations and blood normalization. Radiology. 2014; 271:365–372.
TOOLS
Similar articles