

 PDF
PDF ePub
ePub Citation
 Print
Print


INTRODUCTION
The increased detection of small renal tumors has paralleled the increased use of cross-sectional imaging (1). The term small renal mass (SRM) has been used to refer to these tumors, usually defined as an enhancing tumor less than 4 cm in diameter (2). This has resulted in a 2% annual increase in the incidence of renal cell carcinoma (RCC) over the past two decades with a migration to lower stages due to smaller size (2, 3, 4). Furthermore, it is not only RCC that have risen in incidence. Incidental SRMs represent both malignant and benign tumors (5). Especially, at smaller SRM sizes, the proportion of benign SRM is higher. For instance, in a report by Frank et al. (6), it was found that 30% of tumors less than 2 cm in diameter were benign, whereas 20% of those with a diameter greater than 4 cm were benign. In a recent study of a series of 2675 tumors, an increase of 16% in the odds of cancer was equated with each centimeter increase in the size of the mass (7). As a large proportion of SRMs are not malignant, they do not require invasive treatment such as nephrectomy, and follow-up imaging or treatment in the case of symptomatic presentations (i.e., renal artery embolization for bleeding from angiomyolipoma [AML]) may suffice (8). Therefore, differentation between early RCC and benign SRM has become critical to achieve proper management. As there are a lack of symptoms and clinical characteristics to indicate RCC in SRMs, differential diagnosis is highly dependent on imaging characteristics.
In this review, we describe the radiological features of benign SRMs based on well-known findings in the literature and with incorporation of findings from recent reports. We especially focused on two of the most common benign entities, AML and oncocytoma, in terms of their common imaging findings and differential features from RCC as they are the most commonly encountered SRMs that could be mistaken as RCC. Detailed description of the imaging findings of less common types of benign SRMs and the radiologic differentiation between subtypes of RCC are beyond the scope of this review. Finally, we introduce the role that percutaneous biopsy may play in the era of SRMs.
Imaging Findings of Common Benign Small Renal Masses
Angiomyolipoma
Angiomyolipoma is one of the most common benign solid renal neoplasms (1). AML is composed of blood vessels, smooth muscle, and adipose tissue (9). It occurs most often in the 4-6th decades, with preponderance in women (10). Radiologically, AML can be categorized into the more classic AML and AML with minimal fat (11). Diagnosing the more classic AML is not difficult, as it presents with gross fat, which is the pathologic hallmark of AML. Owing to this abundant fat component, AMLs show marked hyperechogenicity (usually as echogenic as the renal sinus fat) on ultrasound (US) with reference to the renal parenchyma (12, 13), and demonstrate areas of unenhanced attenuation measuring < -10 Hounsfield units (HU) on computed tomography (CT) (14). In addition, this fat content can be detected by using frequency selective fat suppression and chemical shift fat suppression (15, 16) on magnetic resonance imaging (MRI). In cases of small classic AML, the typical radiologic findings of US, CT, and MRI are all applicable. Yet, as the AML itself and the fat content is small, acquisition of thin sections (i.e., 1.5-3 mm) and measuring the attenuation with small regions of interest or even pixel values might be necessary to identify the fat content while avoiding partial volume averaging artifacts (14, 17, 18).
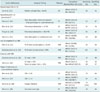
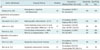
However, it may be difficult to differentiate AML with minimal fat from RCC (19) as they both contain too little fat to be directly detected on an unenhanced CT. This type of AML is typically reported to be small with an average diameter of 3 cm (19, 20, 21). As a result, these AMLs are quite often misdiagnosed as RCC and are inadvertently removed surgically (1). Generally, AML with minimal fat is pathologically diagnosed as an AML that contains no more than 25% fat cells as visualized using high power field microscopy (12). Yet, despite the poor lipid content, many investigators have tried to find methods to identify AML with minimal fat as well as radiologically distinguish it from RCC and have reported promising results (Table 1).
US Findings of AML with Minimal Fat
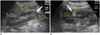
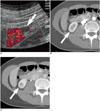
Traditionally, a hyperechoic renal mass on US without features of a hypoechoic rim or intratumoral cysts is considered typical for AML when compared with RCC (12). However, when it comes to small AML with minimal fat, there has been some controversy over the echogenicity of AMLs. Some have reported that they are homogeneously isoechoic (20, 21), whereas others found that they are hyperechoic (19) or only slightly hyperechoic (22). Most of these studies comparing the echogenicity of RCC and AML with minimal fat have been done on a subjective basis and are not dedicated studies of SRMs. On the other hand, Lee et al. (23) reported that measuring the relative echogenicity of the lesion at a picture archiving and communication system monitor with the renal cortex and sinus fat referenced as 0 and 100%, respectively, was useful in differentiating small AMLs from RCCs. While small AML with minimal fat (88%) demonstrated lesser relative echogenicity than classic AML (106.3%), it showed greater relative echogenicity compared with all subtypes (44.1%) of RCC (Fig. 1). Although, further validation may be needed, in our experience, we believe that comparing the relative echogenicity with that of sinus fat can be helpful in clinical practice.
CT Findings of AML with Minimal Fat
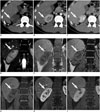
CT has been more meticulously studied with regard to small AML with minimal fat. One of the most representative findings of AML with minimal fat on CT is the extent of hyperattenuation compared with the renal parenchyma. It was found to be significantly more common in these AMLs (53%) than in RCCs (13%) (24). This finding has also been confirmed upon quantitative analysis with thresholds of > 38.5 HU and > 37 HU to differentiate small AML with minimal fat from RCC and non-clear cell type RCC, respectively, resulting insensitivities and specificities up to 91.7% and 76.4%, respectively (Fig. 2) (25, 26, 27). A different approach that has been thoroughly examined is attenuation measurement using histogram analysis on unenhanced CT. Although earlier studies reported promising results with a high specificity (100%) and positive predictive value (100%) (28), further research by different investigators led to the realization that pixel histogram analysis cannot reliably differentiate between AML with minimal fat and RCC, or at least between AML with minimal fat and clear cell RCC (29, 30).
MRI Findings of AML with Minimal Fat
MRI is often a problem solving modality in equivocal cases. The most basic MRI finding of small AML with minimal fat with regard to differentiation from RCC is low T2-weighted imaging (T2WI) signal intensity (SI). The characteristic low T2WI SI is not only well appreciated on a qualitative basis but has also been quantitatively assessed in terms of the SI ratio of the renal mass to that of the background kidney (31, 32). Choi et al. (31) have used a criteria of T2WI SI ratio < 92.5% for predicting small AML with minimal fat and reported a high sensitivity and specificity of 90% and 90.2%, respectively. More recently, it has been suggested that fat-suppressed T2WI may be more useful than T2WI without fat saturation when differentiating AML with minimal fat from other entities (33). Chemical shift MRI, or in other words, in- and opposed-phased MRI, is also recognized as effective in differentiation of SRMs, especially in diagnosing AML with minimal fat. In general, the presence of the Indian ink artifact at the interval between the renal mass and kidney or SI loss at opposed phase images within a renal mass can suggest the diagnosis of AML (16). Furthermore, chemical shift MRI has been reported to be able to detect fat even in cases of AML (with minimal fat) where CT failed to detect fatty tissue (34). Upon quantitative analysis, SI indices (the relative drop of SI from in- to opposed-phase) of 20-25% resulted in specificities of 90-93% in diagnosing small AML with minimal fat from non-AMLs (32, 35). Although MRI is often helpful in indeterminate cases on CT, some pitfalls should be noted when using certain methods such as the two above. In general (not limited to the SRMs), papillary RCCs also appear as T2WI low SI renal masses, and clear cell RCCs sometimes demonstrate loss of SI in the opposed phase due to intracytoplasmic fat, hindering diagnostic accuracy in determining AML with minimal fat (36, 37). Therefore, when interpreting MR examinations for characterization of SRMs, one should not rely on a single criterion, but rather comprehensively incorporate all given features, such as low T2WI SI, loss of SI at opposed phase images, and enhancement pattern.
Apart from the abundant literature using CT and MRI in diagnosing small AML with minimal fat, a common cross-sectional imaging feature may also aid in diagnostic confidence. Small AMLs with minimal fat are usually less rounded in shape compared with small RCC (Fig. 3). This is substantiated by several reports in the literature, which described small AML with minimal fat as having an angular interface with the renal parenchyma, demonstrating greater long-to-short axis ratio compared with RCC (> 1.13) or non-clear cell RCC (> 1.29). They were even characterized to resemble the morphology of an ice-cream cone (25, 27, 38, 39). All these descriptions fundamentally imply that small AML with minimal fat are softer than RCC due to their composition of adipose tissue (minimal in the case of AML with minimal fat), smooth muscle, and blood vessels in AML unlike the compact cellular growth pattern in RCC (9, 40, 41).
Several emerging technologies have been explored recently. Tan et al. (42) found that sonoelastography was able to differentiate small AML with minimal fat from RCC, with high interobserver concordance and accuracy. There also have been recent efforts using diffusion-weighted MR imaging (DWI) to diagnose AML with minimal fat (43, 44, 45). Yet, the literature is still scarce, controversial, and do not specifically handle SRMs, warranting validation before clinical utilization.
Oncocytoma
Oncocytoma is the second most common benign renal cell neoplasm constituting approximately 5% of renal epithelial neoplasms based on surgical series (9). Oncocytoma is thought to originate from or to histologically differentiate towards the type A intercalated cells of the cortical collecting duct (46, 47). The incidence of oncocytoma peaks in the seventh decade, with a higher prevalence in men. Histopathologically, oncocytoma is organized with acini and nests of large polygonal cells and contains eosinophilic cytoplasm rich in mitochondria (9). A recent study of pathologically proven oncocytomas demonstrated that the mean growth rate of oncocytomas was 2.9 mm/year over 36 months, which is equivalent to the rate previously reported for RCCs and other small renal masses (48). Therefore, surveillance may not be able to discriminate a small oncocytoma from a small RCC, and rather the radiologist, if possible, should suggest the possibility of oncocytoma when suspected on imaging. Imaging findings reported for small renal oncocytoma are summarized in Table 2.
US Findings of Oncocytoma
On US, small sized oncocytomas usually appear as homogeneous renal masses that are isoechoic with the echogenicity of the renal parenchyma with well-demarcated margins (49). Yet, small RCCs may also show similar characteristics in about 5-6% of cases (50). The spoke wheel or stellate scar appearance on US, which is a well-known characteristic finding, is usually difficult to see in small oncocytomas. For instance, Goiney et al. (49) only found the central scar present in an oncocytoma sized 12 cm. This can be explained by the fact that the oncocytoma needs to enlarge and outstrip its blood supply leading to infarction hemorrhage and necrosis before organizing and healing to render the central scar. A spoke-wheel pattern of feeding arteries on angiography, though characteristic of oncocytoma, is again mostly seen in oncocytomas of larger sizes, and cannot be accurately used to diagnosis oncocytomas in the setting of SRMs (51).
CT Findings of Oncocytoma
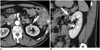
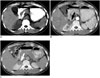
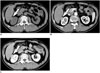
On CT, small oncocytomas typically appear as solitary, well-demarcated, homogeneously enhancing renal cortical tumors. Hemorrhage, calcification, necrosis, and central stellate scars are uncommon in oncocytomas in the setting of SRMs (51, 52, 53, 54). Although these imaging findings of small oncocytomas overlap with RCC and may discourage efforts to differentiate between the two, fortunately, we have recognized that a phenomenon called "segmental enhancement inversion" could be helpful in such a situation. Segmental enhancement inversion (SEI) was defined as the following by Kim et al. (55): on contrast-enhanced CT, renal mass demonstrates two distinct areas of differing degrees of enhancement in the corticomedullary phase, in which the degree of enhancement is inversed in the nephrographic phase (Fig. 4). In the first study introducing this finding of SEI, it was found to be a characteristic finding of small oncocytoma with 8 of 10 (80%) oncocytomas smaller than or equal to 4 cm showing SEI. In a subsequent study that analyzed the prevalence of SEI according to the size of oncocytomas, it was found that oncocytomas in the size range of 1.5-2.9 cm most commonly showed SEI (56). A possible explanation is that an extremely small size (< 1.5 cm) makes it difficult to segment the oncocytoma into more and less enhancing components, and that the increasing proportion of tumors with pathological features such as the stellate scar coincide with the decreased prevalence of SEI in oncocytomas with larger size (> 2.5 cm). Furthermore, SEI was found to be significantly more common in small oncocytoma (63%) than in small chromphobe RCC (7.3%), which may be expected to manifest with similar imaging findings given their common histopathological backgrounds (57). Ever since these preliminary results were reported, there has been some debate over the utility of this imaging finding (58, 59). For instance, McGahan et al. (58) found that only 1 out of 16 (6.3%) renal oncocytomas showed SEI. Possible explanations for this discrepancy may be differences in the study population (i.e., tumor size), methods and the level of experience in recognizing SEI, as well as differences in the CT protocols (i.e., time delay after contrast injection for the corticomedullary and early excretory phases). Although the clinical usefulness of SEI may need further verification, it is indeed promising that specificity remains high throughout various reports (87-100%) according to a recent meta-analysis of SEI in diagnosing oncocytoma which has summarized the debate (60).
Recent reports suggest that quantitative analysis of the enhancement pattern of SRMs may assist in identifying oncocytomas. Alshumrani et al. (61) reported that by using triphasic multidetector CT in a cohort of 47 small renal masses, they were able to distinguish oncocytomas from papillary RCCs using a threshold of 32 HU for absolute nephrographic enhancement. Furthermore, Gakis et al. (62) found that the corticomedullary phase was the best phase to differentiate between small oncocytoma and clear cell RCC. In their study, small oncocytomas were more isoattenuating to the normal renal cortex, whereas clear cell RCCs were more hyperenhancing. However, Bird et al. (63) demonstrated that on 4-phase contrast-enhanced CT, oncocytomas showed higher enhancement than clear cell RCCs with arterial phase enhancement greater than 500% and washout values greater than 50%, in which the latter was exclusively seen in oncocytomas. Such discrepancy in quantitative measurements of enhancement degrees are speculated to arise from different CT protocols, and however promising they seem to be, more standardized protocols are needed for direct comparison between studies, and to establish the role of quantitative analysis of the enhancement pattern for diagnosing small renal oncocytoma.
MRI Findings of Oncocytoma
MRI has also been evaluated for its value in diagnosing oncocytoma; however, the literature is sparse with respect to small renal oncocytoma. Rosenkrantz et al. (64) compared an array of MR imaging features between oncocytoma and chromophobe RCC and none of the evaluated features of microscopic fat, hemorrhage, cysts, infiltrative margins, perinephric fat invasion, renal vein invasion, enhancement homogeneity, hypervascularity, central scar, and SEI were significantly different. Rather, both entities appeared as localized well-circumscribed masses, more hypovascular than the renal cortex, with low prevalence of features of cysts, microscopic lipid, hemorrhage, and hemosiderin. However, other studies suggested that oncocytomas can be identified with high specificity (65, 66). Cornelis et al. (65) reported that SEI of the central area was observed in 74% of oncocytomas and in 12% of RCCs. And when they used a combination of SEI and SI index < 2% or tumor-to-spleen ratio > -6%, they were able to diagnose oncocytoma with a sensitivity of 36-55% and specificity of 95-97%. This group took their investigations further and investigated whether the use of multiparameteric MR, including double-echo chemical shift, dynamic contrast-enhanced T1-weighted and T2-weighted images and apparent diffusion coefficient (ADC) maps with the corresponding SI index, tumor-to-spleen SI ratio, ADC ratio, wash-in and wash-out indices between different phases could be of further value (66). Using these parameters, oncocytomas were distinguished from chromophobe and clear cell RCCs with a specificity of 100% and 94.2%, respectively. More recently, advanced MR techniques such as arterial spin labeling (ASL) and DWI have emerged. Lanzman et al. (67) demonstrated that oncocytomas showed higher levels of mean perfusion on ASL MR imaging when compared with all subtypes of RCC, including the clear cell, papillary, chromophobe, and unclassified types. This is similar to the finding of Bird et al. (63) indicating that the degree of arterial enhancement was greater in oncocytomas compared with clear cell RCC using 4-phase contrast enhanced CT. Regarding DWI, a recent meta-analysis which reviewed the ADC values for different renal lesions, identified that not only could ADC values (× 10-3 mm2/s) help generally discriminate between benign and malignant lesions, but they were also able to help differentiate oncocytomas (2.00 ± 0.08) from RCCs (1.61 ± 0.08) (68). Despite these promising results using MRI, the majority of the investigators did not limit their study population to small renal masses, and one should take caution in applying these results, especially when dealing with small renal oncocytomas (64, 65, 66, 67, 68).
Although most oncocytomas are solitary, patients may present with bilateral, multicentric oncocytomas in hereditary syndromes such as renal oncocytosis and Birt-Hogg-Dubé syndrome. Oncocytomas can also manifest as hybrid or collision tumors with chromophobes or even other types of RCC (69, 70). In these cases, differentiation between small oncocytomas and RCCs may become more problematic.
Imaging Findings of Other Benign Renal Tumors
Benign renal tumors other than the common AML and oncocytoma include metanephric adenoma, leiomyoma, reninoma, solitary fibrous tumor, schwannoma, and inflammatory pseudotumors which may mimic RCC, usually the non-clear cell type. In the setting of SRMs, discriminating these tumors from small RCC based on imaging is usually impossible, due to the overlap of radiological findings and the rare incidence, and also because the imaging findings of these rare benign renal tumors have not been well established. The following is a brief orientation of the findings of a few representative benign renal tumors.
Metanephric Adenoma
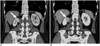
Metanephric adenoma is a rare benign renal tumor which usually occurs in the fifth to sixth decade and is two times more common in females than in males (9). Metanephric adenoma presents as a well-demarcated, round, solid mass on imaging studies (71). On US, it appears as an expansile mass with either hypo- or hyperechogenicity (72). On CT, it appears as a hyperdense mass in relation to adjacent renal parenchyma on precontrast images with weak enhancement (73). These imaging findings overlap with malignant renal tumors such as Wilms tumor and hypovascular renal cell carcinoma (Fig. 5). Calcification is found in 20% of cases. On MR, it shows as hypointense SI on T1-weighted images and slightly hyperintense SI on T2-weighted images (74).
Leiomyoma
Renal leiomyoma is a rare benign tumor arising from the smooth muscle (9). It is usually detected in adults as an incidental finding. Renal capsule is the most common site of leiomyoma, but it can also develop from the renal pelvis or cortex, albeit very rarely (75). Renal leiomyoma commonly appears as a well-circumscribed, homogeneous, exophytic hyperattenuating solid mass showing homogeneous enhancement on contrast-enhanced CT (76). Heterogeneous features due to hemorrhage and cystic or myxoid degeneration are rare when leiomyomas are small (77). At MRI, leiomyoma typically has homogeneously low SI on T1- and T2-weighted images (Fig. 6) (78).
Juxtaglomerular Cell Tumor
Juxtaglomerular cell (JGC) tumor, also known as reninoma, is an extremely rare, benign renal tumor of myoendocrine cell origin (79). Almost all cases occur in the second and third decades with 2:1 female preponderance. With regard to diagnosing JGC tumor, the clinically setting is of utmost importance. A patient with JGC tumor typically manifests with a triad of poorly controlled hypertension, hypokalemia, and high plasma renin activity (80). At imaging, JGC tumors classically appear as a unilateral, well-marginated, cortical tumor smaller than 3 cm (81). JGC tumors usually appear hypovascular with delayed enhancement on contrast-enhanced CT and MRI despite its profuse vascularity (Fig. 7). This is speculated to be due to renin-induced vasoconstriction (82).
Role of Percutaneous Biopsy in the Era of Small Renal Masses
It is ironic that while there are so many reports demonstrating the high accuracy and efficacy of imaging studies, especially cross-sectional studies such as CT and MRI, the majority of these studies are based on surgical specimens of benign and malignant SRMs. Remzi et al. (83) reported that only 17% of all benign renal masses were correctly diagnosed at preoperative CT, yet 43% of these patients underwent overtreatment, such as radical nephrectomy. In another study, Frank et al. (6) found that this was the case in 65% of 376 benign renal masses. Surgical data have been especially consistent in demonstrating that the smaller the size of a solid renal mass, the higher the probability of it being a benign lesion (6, 84, 85). Among these unnecessarily resected benign renal masses, the most common include AML with minimal fat and oncocytoma, while the more rare entities would be metanephric adenoma, papillary adenoma, and leiomyoma. As these SRMs have historically undergone unnecessary surgery, it could be suggested that biopsy should be done before deciding whether the patient should undergo invasive management (operation) or not in certain circumstances. We do not believe that there is a clear cut indication for performing a biopsy on all small renal masses, nor do we have a set of criteria to choose whom and what tumor will require biopsy. This remains an important clinical question to be solved. Yet it is undisputed that recent advances in the acquisition and interpretation of biopsy specimens from SRMs have had a crucial impact. In general, the sensitivity and specificity of biopsy (regardless of needle size or whether cytological, histological analysis or both were performed) in renal masses is reported to be 80-92% and 83-100%, respectively (86). When stratified to tumor size, the literature indicates that SRMs, in comparison to larger tumors, may be more difficult to diagnose based on percutaneous biopsy. Rybicki et al. (87) reported a sensitivity and negative predictive value of 84% and 60%, respectively, for renal masses smaller than 4 cm, while these values were 97% and 89%, respectively, for those between 4 and 6 cm in size. This is generally thought to be due to difficulty targeting the mass, especially in renal masses smaller than 1 cm in diameter (88). Although we routinely use an 18-gauge biopsy needle at our institution, recent studies suggest that fine (20-gauge or thinner) needles are sufficient to obtain specimens to make an accurate diagnosis (89, 90). Especially, there has been improvement in cytological techniques, including immunocytochemical staining and cytogenetic studies that have led to more accurate diagnoses. The advanced techniques have improved not only differentiation of benign and malignant renal tumors, but can also be helpful in determination of renal cell carcinoma subtypes and Fuhrman nuclear grades (91, 92, 93, 94, 95). One important concern regarding percutaneous biopsy of SRMs is needle track seeding in case the SRM is malignant. However, the paucity of such events in the literature suggests that it is a truly rare phenomenon with an estimated incidence of less than 0.01% of cases (96). In addition, there is no evidence to suggest any relationship between needle size and the risk of track seeding (97). The only deterrent to biopsy would be when the SRM is suspected to be transitional cell carcinoma, as some consider these tumors to have a greater risk of seeding than RCCs (98, 99).
Although radiological imaging has been the primary tool to evaluate SRMs, imaging alone may not be able to obviate surgery for all benign SRMs. We believe that percutaneous biopsy will play a crucial role in determining the optimal management of patients with SRM. Still, consensus on when and how percutaneous biopsy should be performed for SRMs will need to be validated in the future.
CONCLUSION
Small renal masses are being detected more frequently due to the increased use of cross-sectional imaging studies. As a significant portion of these SRMs are benign, it is crucial that the radiologist recognize the imaging features of SRMs so that the patient may undergo appropriate management. Several characteristic imaging features of common benign SRMs, such as AML with minimal fat and oncocytoma, are currently well established in the literature, with many more promising results using conventional or advanced imaging techniques on the way. Small-sized rare benign renal tumors, including metanephric adenoma, leiomyoma, and JGC tumor, cannot be accurately diagnosed or differentiated from small RCC, especially non-clear cell type RCCs based on radiologic studies alone. However, clues should be obtained from the clinical setting, such as the age, sex, symptom, and location of the tumor, and in certain circumstances, percutaneous biopsy will be required to confirm the benignity of the SRM to obviate unnecessary surgery.
 XML Download