

 PDF
PDF ePub
ePub Citation
 Print
Print


INTRODUCTION
Mammographic density is defined as the proportion of radiodense fibroglandular tissue in the breast (1). The American College of Radiology Breast Imaging Reporting and Data System (ACR BI-RADS) is widely used to assess or grade breast density according to the parenchymal structure (2). Mammographic density can be evaluated by qualitative and quantitative methods (3, 4). Qualitative BI-RADS density classification, introduced as the first edition of ACR BI-RADS, cannot quantify the risk of breast cancer. It overcomes one of the limitations of mammography, which is the reduction of sensitivity with an increase in breast density. The fourth edition of ACR BI-RADS presents a quantitative classification method that enables the radiologists to visually assess percentage breast density using the grade, i.e., < 25%; 25-50%; 50-75%, or > 75% (3, 5, 6). Dense breast tissue is considered to be a risk factor for breast cancer, and it may lead to false negative results in breast cancer screening (7, 8, 9, 10). Recently, five states of the United States of America including Connecticut, Texas, New York, California, and Virginia have passed a law that requires the radiologists to inform the referring physicians and their patients that mammography sensitivity decreases with increasing breast density and that women with dense breasts may benefit from a supplemental screening test such as breast ultrasound (US) or magnetic resonance imaging (MRI) (11, 12). Therefore, a standardized and objective method for measuring breast density is needed to identify women who are most likely to benefit from additional screening methods such as US.
Volumetric breast density measurement (VBDM) determines the X-ray attenuation between each pixel in the image and the X-ray source. From this X-ray attenuation, thickness of each type of tissue between the pixel and the X-ray source can be determined.
This study was conducted to compare mammographic density grade evaluations by VBDM with those by radiologists using the BI-RADS, and to identify the factors that may contribute to the technical failure of VBDM.
MATERIALS AND METHODS
Study Population
The institutional review board approved this retrospective observational study, and the requirement for seeking patient approval or informed consent for the review of medical records was waived. This study was based on a set of 1129 mammograms obtained from 1129 consecutive women who underwent breast density evaluation at our institute from December 2011 to January 2012.
Assessment of Mammographic Density
Mammograms were performed by using two digital mammography systems, a Lorad/Hologic Selenia full-field digital mammography system (Lorad/Hologic, Danbury, CT, USA) and the General Electric senographe digital mammography system (General Electric Medical Systems, Milwaukee, WI, USA). Standard mediolateral oblique (MLO) and craniocaudal (CC) views of mammograms were obtained for all women.
Seven radiologists who specialized in breast imaging independently interpreted the mammograms using a 5000-pixel monochrome liquid crystal display monitor (ME1i2-BC, Totoku, Electric Co., Tokyo, Japan) on a Picture Archiving and Communication System in their daily practice. The breast density estimation by radiologists' assessment was based on the original radiological reports. Breast density assessments by radiologists in the original reports were presented on a per-patient basis as one of the four grades defined by BI-RADS (grade 1, almost entirely fatty, < 25% fibroglandular tissue; grade 2, scattered fibroglandular tissue, 25-50% fibroglandular tissue; grade 3, heterogeneously dense, 51-75% fibroglandular tissue; grade 4, extremely dense, > 75% fibroglandular tissue). The radiologists did not have any knowledge of VBDM while interpreting the mammograms (2). In women with a history of total mastectomy, the density of the contralateral breast was recorded.
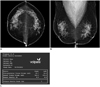
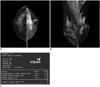
For VBDM, the Volpara software (Volpara Version 1.5.1, Matakina Technology, LTD, Wellington, New Zealand) was used, which automatically calculates the volumes of total breast tissue (mL) and fibroglandular tissue (mL) in each breast as presented in Figure 1. Then, the total breast tissue volume and fibroglandular tissue volume per patient were calculated as follows: (right breast volume + left breast volume) / 2 and (right fibroglandular tissue volume + left fibroglandular tissue volume) / 2, respectively. In women who had a total mastectomy, the volumes of total breast tissue and fibroglandular tissue in the contralateral breast were considered. The VBDM software calculates the breast density per patient as the volume of fibroglandular tissue divided by the volume of total breast tissue to obtain a percentage. The four density classifications by VBDM (1, 0-4.5%; 2, 4.5-7.5%; 3, 7.5-15.5%; 4, > 15.5%) correspond to grades 1, 2, 3, and 4 of the BI-RADS classification, respectively. Technical failure of VBDM was defined when the software could not measure the tissue volume and density in any breast, presenting "0" as the output (Fig. 2).
Data and Statistical Analysis
The agreement between breast density evaluations by seven radiologists according to the four grades (D1/D2/D3/D4) defined by the BI-RADS and breast density evaluations as one of the four grades by VBDM was determined using unweighted kappa statistics. The breast densities were then reclassified as fatty breast (including D1 and D2 [D1-2]), and dense breast (including D3 and D4 [D3-4]), and the agreement of densities between radiologists and VBDM was again evaluated using kappa statistics. The analysis was performed in all of the patients as well as in patients in whom technical failure of VBDM did not occur. A kappa value (k) of 0.20 or less was interpreted as indicating slight agreement; 0.21-0.40, fair agreement; 0.41-0.60, moderate agreement; 0.61-0.80, substantial agreement; and 0.81-1.00, almost perfect agreement (13).
Patients in whom concordant results (i.e., the same breast density) were obtained between radiologists and VBDM, and those in whom discordant results were obtained between radiologists and VBDM were compared with respect to age, total breast tissue volume, and fibroglandular tissue volume using the independent t test, and with respect to the frequency of technical failure of VBDM and the frequency of mass > 3 cm using the chi-square test.
To investigate the sources of technical failure of VBDM, patients who showed technical failure and those who did not show technical failure were compared with respect to age, total breast tissue volume, and fibroglandular tissue volume using the independent t test, and with respect to the breast density classifications (four grades and the binary fatty- vs. dense-breast), history of partial mastectomy, and the frequency of mass > 3 cm using the chi-square test or the Fisher's exact test. Using the receiver operating characteristic curve, we determined the cut-off value of total breast volume for predicting technical failure of VBDM, and we calculated the sensitivity and specificity with 95% confidence intervals. Two-sided tests were performed and p values less than 0.05 were considered statistically significant. Statistical analysis was performed using commercially available software (MedCalc, version 11.5.0.0, MedCalc Software, Mariakerke, Belgium).
RESULTS
The mean age of these 1129 women was 52 years (range 19-82 years). One hundred forty-eight (13%) women underwent partial mastectomy, 250 (22%) women underwent total mastectomy, and the remaining 731 women had not undergone any operation. The mean total breast tissue volume and fibroglandular tissue volume in the overall women was 466.4 mL (range, 56.1-1684.2 mL) and 50.6 mL (range, 6.8-311.1 mL), respectively.
Agreement between Breast Densities Evaluated by VBDM and Visual Assessment
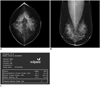
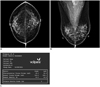
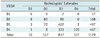
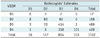
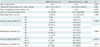
The agreements between radiologists' evaluation and VBDM were fair (k value = 0.26) on using the four-grade scale (D1/D2/D3/D4) and moderate (k value = 0.47) on using the two-grade scale (D1-2/D3-4) (Table 1). Of the 1129 mammograms, 54.3% (613 of 1129) were concordant in breast density evaluations by radiologists' and VBDM, while 45.7% (516 of 1129) were discordant (Figs. 3, 4). Of the 516 discordant mammograms, results in 423 (81.5%) mammograms were overestimated by VBDM compared with radiologists' interpretation. Of these 423 mammograms, 333 (78.7%, 333 of 423; 64.5%, 333 of 516) were classified as D3 by radiologists but as D4 by VBDM. When patients who did not show a technical failure of VBDM (n = 1102 patients) were selectively analyzed, the agreement was fair (k value = 0.26) on using the four-grade scale (D1/D2/D3/D4) and moderate (k value = 0.47) on using the two-grade scale (D1-2/D3-4) (Table 2). Of these 1102 mammograms, the interpretations in 54.5% (601 of 1102) of mammograms were concordant between radiologists and VBDM, while the interpretations in 45.5% (501 of 1102) of mammograms were discordant between radiologists and VBDM. Of these 501 discordant mammograms, results in 408 (81.4%) mammograms were overestimated by VBDM compared with radiologists' interpretation. Of these 408 mammograms, 318 (77.9%, 318 of 408; 63.5%, 318 of 501) were classified as D3 by radiologists but as D4 by VBDM. Mean age and total breast volume were significantly lower in the discordant group than in the concordant group (p = 0.004 and < 0.001, respectively) (Table 3). The mean fibroglandular tissue volume did not differ significantly between the discordant and concordant groups (p = 0.396), nor did the frequency of technical failure of VBDM (p = 0.398). Five of 516 discordant mammograms (0.9%) and 8 of 613 concordant mammograms (1.3%) showed a mass larger than 3 cm, indicating no significant difference (p = 0.805).
The Technical Failure of VBDM
Twenty-seven (2.4%) out of 1129 women showed technical failure of VBDM in their breast density evaluations (Table 4). These women were significantly younger and had significantly smaller total breast volumes (p = 0.003 and 0.001, respectively). Women who showed technical failure of VBDM included a significantly higher proportion of women (37% [10 of 27]) who had undergone partial mastectomy compared with that in those who did not show technical failure of VBDM (12.5% [138 of 1102]; p = 0.001). However, the mean fibroglandular tissue volume did not differ significantly between the two groups (p = 0.492). All of the women who showed technical failure of VBDM (27 women; 100%) were classified as having high breast density grades of D3 or 4 by VBDM as well as by radiologists. Fatty (D1-2) vs. dense (D3-4) breast classification by either radiologists or VBDM was significantly associated with the occurrence of technical failure of VBDM (p = 0.015). Frequency of mass larger than 3 cm was not significantly different between the two groups (p = 1.000).
DISCUSSION
With an increase in the radiological breast density, a woman's risk for breast cancer may increase from 2- to 6-fold compared with the risk for breast cancer at the lowest breast density (7, 8, 10, 14, 15, 16, 17). Dense breast tissue may obscure a mass and thereby permit development of interval cancers between regular mammographic screening (10, 18, 19). In women with high breast densities, supplemental screening by US or magnetic resonance imaging may increase the probability of detecting breast cancer in the treatable stage (8, 11, 12, 16). Several U.S. states have recently passed a legislation that mandates the disclosure of high breast density grades in the mammography report, since they are associated with increased breast cancer risk and may obscure a malignant mass (11, 12). It is also mandatory to inform the patient that use of an alternative screening method such as US may increase the likelihood of detecting breast cancer if present. To meet such requirements, standardized measures of breast tissue density are needed to overcome the subjectivity and low reproducibility in reporting breast density grade and to select women who are most likely to benefit from additional or alternative screening methods.
Although the ACR BI-RADS is widely used (20), the grade assessments depend on the ability and experience (i.e., subjective values) of radiologists and may show significant intra- and inter-reader variability (2, 4, 21, 22). To promote objectivity and reproducibility in clinical breast density assessments, several promising methods have been developed (1, 18, 23, 24). Qualitative assessment of breast density is conventionally area-based; that is, evaluations are derived from dense areas of tissues projected in a mammogram (25). Computer-assisted threshold measurements belong to this type, and are limited by the absence of adjustment for breast thickness (23). Volumetric measurements of breast density (26) are expected to predict risk more accurately than area-based measurements because the volume of dense tissue presumably represents the number of fibroglandular cells (27). Volpara software was developed to evaluate volumetric breast density using data from digital mammograms, and it was introduced in clinical practice. Measurements of fibroglandular tissue volume obtained by volumetric methods show a very high correlation with volume measurements by magnetic resonance imaging (26).
Our study compared breast density grades between VBDM and radiologists, and demonstrated fair and moderate agreements. Although fibroglandular tissue volume may account for less than 50% of total breast volume, a high concentration of fibroglandular tissue in some areas of the breast may prompt the radiologist to report the breast density as grade 3 rather than grade 2, considering that focal density may obscure abnormal growth. Also, if the fibroglandular tissue is uniformly dispersed throughout the breast, the radiologist may report fatty breast rather than a high grade of breast density even though the fibroglandular tissue may account for more than 50% of total breast volume. Radiologists think that the diffusely scattered fibroglandular tissue would not lower the sensitivity of mammography. If the density evaluations differ between CC and MLO views, or between right and left breasts, radiologists generally assess the breast density according to the view or side showing greater density. VBDM, however, averages the measurements of the CC and MLO views or the density grades in the two breasts. In this study, discordance between VBDM and visual assessment by radiologists may have also resulted from the radiologists' tendency to assign density grades lower than those obtained by VBDM. Among the 516 discordant mammograms, 64.5% of mammograms that were assigned grade 3 by radiologists were classified as grade 4 by VBDM. This discordance may indicate either a greater ability of human vision to distinguish between light and dark areas on the films/images or the capacity of VBDM to detect radiological opacity (or density distributions) in areas of the mammogram that appear clear to the human eye. Alternatively, it could indicate a lower level of resolution by VBDM than by visual assessment.
We compared the frequency of mass larger than 3 cm on the assumption that large mass could be a factor of disagreement in grade assessments or technical failure of VBDM. However, there was no significant difference in the frequency of mass larger than 3 cm between concordant and discordant groups, and between group showing technical failure of VBDM and group not showing technical failure of VBDM. Rather, more masses were detected in the concordant group (1.3%, 8 of 613) than in the discordant group (0.9%, 5 of 516) without any statistically significant difference. None of the women who showed technical failure of VBDM had a mass larger than 3 cm. However, interpretation of these results is limited by a small number of cases with large masses. A larger sample size will be needed in future studies to determine whether or not the estimation by VBDM is affected by a large mass, leading to disagreement between VBDM and radiologists' visual assessment.
In the present study, technical failure of VBDM was noted more frequently in the mammograms of women with a history of partial mastectomy (p = 0.001). This difference may be attributable to uneven compression of the breast as a result of the surgery. VBDM is critically dependent on breast thickness, and the software cannot process data for uneven compression (25, 28). The dependence of volumetric methods on uniform breast thickness is cited as a potential source of discordance between volumetric and threshold-based, two-dimensional methods (25, 26). In this study, the grade of breast density (%), as evaluated by VBDM and radiologists using the BI-RADS, was significantly higher in the group of women who had mammograms showing technical failure of VBDM (p = 0.015). In an extremely dense breast or a very small breast, it may be difficult to identify a region that contains only fatty tissue, and this may result in failure (26). Volpara was not designed to help in assessing breast density grade or volume when there is a significant asymmertry or asymmetric breast thickness, rather this software has demonstrated that technical failure occurs inevitably, which has an effect on breast density measurements (29).
First, our study is limited primarily by the fact that the seven radiologists who assessed the breast density grades had different training backgrounds, and we did not determine the inter-observer agreement or intra-observer reproducibility in their evaluations of breast density grade. However, our results reflect the conditions for assessing breast density categories using BI-RADS in daily practice. Second, in the previous report, radiologist's visual assessment and VBDM showed similar results (30). We included a larger data set with comparison of other factors in this study.
In conclusion, breast density evaluations by radiologists based on the ACR BI-RADS 4th ed. and those obtained using VBDM showed fair or moderate agreement, and significant differences were observed most frequently in mammograms of women with a history of partial mastectomy.

 XML Download