

 PDF
PDF ePub
ePub Citation
 Print
Print


INTRODUCTION
Glioblastoma multiforme (GBM) is the most common primary brain tumor in adults, accounting for approximately one percent of all tumors. Despite the evaluation of multiple treatment approaches, the prognosis for patients with GBM is still extremely poor, with an estimated median survival of 9-18 months (1, 2). Currently, maximal safe tumor resection followed by concurrent chemoradiotherapy (CCRT) with temozolomide (TMZ) and adjuvant TMZ is the standard therapy for patients with GBM (3). Determination of the response to therapy is entirely dependent on the interpretation of magnetic resonance (MR) imaging findings and clinical manifestations. In the criteria published by Macdonald et al. (4) in 1990, radiologic assessments of tumor response and disease progression were primarily based on the enhancing tumor area, and conventional MR imaging has been the best at detecting early treatment-related changes. However, radiologists and clinicians have recently observed the occurrence of progressive MR imaging lesions immediately after the end of CCRT with TMZ, which show spontaneous improvement without further treatment other than adjuvant TMZ. This phenomenon is termed pseudoprogression, and it occurs in 20-30% of the patients (5-8). In cases of true tumor progression, there is no reason to continue adjuvant TMZ; while in cases of pseudoprogression, adjuvant TMZ should be continued (6). Because there are no established imaging findings for the identification of pseudoprogression using conventional contrast-enhanced (CE) MR imaging (9, 10), the Response Assessment in Neuro-Oncology (RANO) criteria for highgrade gliomas were revised. Specifically, the revision states that within the first 12 weeks of completion of radiotherapy, when pseudoprogression is most prevalent, progression can only be determined if the majority of the new enhancement is outside of the radiation field or if there is pathologic confirmation of progressive disease (11).
Several studies have attempted to predict true progression or recurrence by using advanced MR imaging techniques such as perfusion-weighted imaging (PWI) and diffusion-weighted imaging (DWI) (12-19). Moreover, recent studies have shown promising usefulness of histogram analysis of these advanced MR imaging in predicting early treatment response or progression-free survival in patients with high-grade glioma (20-23). However, none of these studies have simultaneously used both PWI and DWI for histogram analysis in the same study population. Furthermore, to the best of our knowledge, there have been no reports regarding the use of a cumulative histogram, which has been reported as a promising tool for differentiating high- from low-grade gliomas (24), for differentiating true progression from pseudoprogression in GBM patients who had received CCRT with TMZ. Therefore, the purpose of this study was to explore the role of histogram analysis of both apparent diffusion coefficient (ADC) and cerebral blood volume (CBV) maps based on newly visible, entirely enhancing lesions in discriminating true progression from pseudoprogression, as well as to evaluate the diagnostic performance of these histogram parameters.
MATERIALS AND METHODS
This retrospective study was approved by our institutional review board. The requirement of an informed consent was waived.
Patient Selection
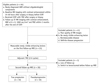
Sixty-four patients with newly diagnosed GBM who had undergone surgical resection or stereotactic biopsy at our institution between February 2010 and December 2011 were selected from our radiology report database. The inclusion criteria were as follows: the patient 1) had a histopathological diagnosis of GBM without an oligodendroglial component based on the World Health Organization criteria; 2) had undergone baseline MR imaging with contrast enhancement within 24-48 hours after surgery or biopsy before subsequent CCRT with TMZ; 3) underwent CCRT with TMZ after surgery or biopsy; and 4) had undergone the first follow-up 3T MR imaging with DWI at b = 0 and 1000 sec/mm2 and with dynamic susceptibility contrast (DSC) PWI within two months (mean duration: 22 days, range: 11-34 days) after the end of CCRT. We excluded 41 patients due to the following reasons: 1) poor quality of the MR images; 2) no newly visible enhancing lesion on the first follow-up MR images; 3) a newly visible enhancing lesion that did not fulfill the criteria for measurable disease, which is defined as bidimensionally contrast-enhancing lesions with clearly defined margins by CT or MRI scans, with two perpendicular diameters of at least 10 mm, visible on two or more axial slices that are preferably, at most, 5 mm apart with 0-mm skip (11) on the first follow-up MR images and 4) definite disease progression according to the RANO criteria (11). All 23 included patients received adjuvant TMZ. Additionally, we excluded two patients due to being lost to follow-up and another patient due to a switch to bevacizumab during adjuvant TMZ before the second follow-up MRI. Finally, a total of 20 patients (10 men and 10 women; age range: 24-68 years; mean age: 50.8 ± 13.5 years) underwent the second follow-up MR imaging with contrast enhancement after 2-6 cycles of adjuvant TMZ (mean interval in days between the end of CCRT and the second follow-up MR imaging: 162 days, range: 46-232 days). We analyzed the changes in the previously enhancing lesions on the second follow-up MR imaging and reviewed the medical records of the patients for the confirmation of true progression (n = 10) or pseudoprogression (n = 10) according to the RANO criteria (Fig. 1) (11).
Image Acquisition
For each patient, the first follow-up MR imaging study after the completion of CCRT was performed with one of the following two 3T MR imaging scanners {Signa Excite (GE Medical Systems, Milwaukee, WI, USA) (n = 6 [true progression = 4 and pseudoprogression = 2]); Verio (Siemens MedicalSolutions, Erlangen, Germany) (n = 14 [true progression = 6 and pseudoprogression = 8])} with an eight-channel head coil. The imaging sequences of the brain included axial spin-echo T1-weighted (T1W) images, fast/turbo spin-echo T2-weighted (T2W) images, fluid-attenuated inversion-recovery (FLAIR) images, DWI, DSC-PWI with gadobutrol (Gadovist, Bayer Schering Pharma, Berlin, Germany), and subsequent CE spin-echo T1W images. The MR imaging parameters were as follows: 558-650/8-20 ms/70-90°/384 × 192-212 (TR/TE/FA/matrix) for spin-echo T1W images; 4500-5160/91-106.3 ms/90-130°/448-640 × 220 (TR/TE/FA/matrix) for fast spin-echo T2W images; and 9000-9900/97-162.9 ms/90-130°/199-220 × 220 (TR/TE/FA/matrix) for FLAIR images. The other parameters for the three images were as follows: section thickness, 5 mm with a 1 mm gap and field of view (FOV) of 240 × 240 mm.
Diffusion-weighted imaging was performed with a single-shot spin-echo echo-planar imaging sequence in the axial plane before the injection of contrast material with a TR/TE of 6900-10000/55-70 ms at b = 0 and 1000 sec/mm2, 35-38 sections, a 3-mm section thickness, a 1-mm intersection gap, an FOV of 240 × 240 mm, a matrix of 160 × 160, three signal averages, and a voxel resolution of 1.5 × 1.5 × 3 mm. DWI data were acquired in three orthogonal directions. Using these data, the averaged ADC maps in the three orthogonal directions were calculated on a voxel-by-voxel basis with the software incorporated into the MR imaging unit.
Dynamic susceptibility contrast-perfusion-weighted imaging was performed with a single-shot gradient-echo echo-planar imaging sequence during the intravenous injection of the contrast agent. The imaging parameters of DSC-PWI were as follows: TR/TE, 1500/30-40 ms; FA, 35-90°; FOV, 240 × 240 mm; 15-20 sections; matrix, 128 × 128; section thickness, 5 mm; intersection gap, 1 mm; and voxel resolution of 1.86 × 1.86 × 5 mm. For each section, 60 images were obtained at intervals equal to the repetition time. After four to five time points, a bolus of gadobutrol at a dose of 0.1 mmol/kg of body weight and at a rate of 4 mL/sec was injected with an MR-compatible power injector (Spectris; Medrad, Pittsburgh, PA, USA). After injecting a bolus of the contrast material, a 30 mL bolus of saline was administered at the same injection rate.
Post-Processing and Histogram Analysis
Histogram analysis was performed using MR imaging data of the first follow-up MR imaging that was performed within two months after the completion of CCRT. The MR imaging data for the conventional MR images, the ADC maps and the DSC-PWI were digitally transferred from the picture archiving and communication system workstation to a personal computer for further analyses. Relative CBV (rCBV) maps were obtained by using a dedicated software package (NordicICE; NordicImagingLab, Bergen, Norway) with an established tracer kinetic model applied to the first-pass data (25, 26). First, realignment was performed to minimize patient motion during the dynamic scanning. Gamma-variate function, which is an approximation of the first-pass response as it would appear in the absence of recirculation, was fitted to the 1/T2* curves to reduce the effects of recirculation. The dynamic curves were mathematically corrected to reduce contrast agent leakage effects (27). After the elimination of recirculation and leakage of contrast agent, the rCBV was computed by means of a numeric integration of the curve. To minimize variances in the rCBV value in an individual patient, the pixel-based rCBV maps were normalized by dividing every rCBV value in a specific section by the rCBV value in the unaffected white matter as defined by a neuroradiologist (S.H.C.) (28). Coregistrations between the CE T1W images and the normalized CBV (nCBV) maps and between the CE T1W images and the ADC maps were performed based on geometric information stored in the respective data sets by using a dedicated software package (NordicICE; NordicImagingLab, Bergen, Norway) (29). The differences in the slice thickness between images were corrected automatically by re-slicing and coregistration method, which was based on underlay images and structural images. The nCBV maps and ADC maps were displayed as color overlays on the CE T1W images.
Two observers (observer 1, a neuroradiologist with eight years of brain MR imaging experience; and observer 2, a neuroradiologist with ten years of brain MR imaging experience), who were blinded to the clinical data, independently compared the CE T1W images that were acquired before the start of the CCRT with those that were acquired after the end of the CCRT. Both the observers then independently drew the regions of interest (ROIs) of the newly visible, entirely enhancing lesions in each section of the co-registered images. Small or thin-rim enhancing lesions that did not fulfill the criteria for measurable disease according to the RANO criteria were not included. Areas of necrosis, cysts, or non-tumor macrovessels that were evident on the CE T1W images were also excluded. The ROI volumes were automatically calculated from the ROIs drawn by each observer. Then, the two observers independently performed histogram analysis in the same manner as described below. The nCBV histograms were plotted with nCBV on the x-axis, with a bin size of 0.1, whereas the y-axis was expressed as a percentage of the total lesion volume by dividing the frequency in each bin by the total number of analyzed voxels. For further quantitative analysis, cumulative nCBV histograms were obtained from the nCBV histograms, in which the cumulative number of observations in all of the bins up to the specified bin was mapped on the y-axis as percentages. The following parameters were derived from the nCBV histograms: 1) the mean, 2) the peak height (PH). In the cumulative nCBV histograms, the 70th, 90th and 95th percentile points (C70, C90 and C95, respectively) were derived (the Xth percentile point is the point at which X% of the voxel values that form the histogram are found to the left of the histogram) (24, 30).
The ADC histograms were plotted with ADC values on the x-axis, with a bin size of 5 × 10⁻⁵ mm2/sec, whereas the y-axis was expressed as a percentage of the total lesion volume by dividing the frequency in each bin by the total number of analyzed voxels. In the same manner as the cumulative nCBV histograms, cumulative ADC histograms were obtained from the ADC histograms. The mean ADC was derived from the ADC histograms. In the cumulative ADC histograms, the 5th percentile point (C5) was also derived (24, 30).
Patient's Clinical Characteristics
We reviewed the patient's clinical characteristics, including age, sex, Karnofsky performance score, history of steroid administration at the time of the first follow-up MR imaging, methylation status of O6-methylguanine DNA methyltransferase promoter of the tumor, surgery method and radiation dose of the CCRT, to determine whether any of these characteristics were predictors of true progression and pseudoprogression.
Statistical Analysis
All statistical analyses were performed with MedCalc software (Version 11.1.1.0 for Microsoft Windows 2000/XP/Vista/7, MedCalc Software, Mariakerke, Belgium). The results with p values of < 0.05 were considered statistically significant.
Clinical characteristics were compared between the true progression group and the pseudoprogression group using Fisher's exact or chi-square tests for the categorical variables.
Because the non-categorical variables of clinical characteristics and histogram parameters were normally distributed according to the Kolmogorov-Smirnov's test, an unpaired Student's t test was employed to compare these variables between the true progression group and the pseudoprogression group.
Subsequently, multivariable stepwise logistic regression analysis was used to determine the significant predictors for the differential diagnosis between true progression and pseudoprogression. Variables with a p-value of < 0.05 according to the univariate analysis were used as input variables for multivariable stepwise logistic regression analysis, with iterative entry of variables on the basis of test results (p-values of < 0.05). The removal of variables was based on likelihood ratio statistics with a probability of 0.10. Receiver operating characteristic (ROC) analysis was employed to determine the best cutoff values for the histogram parameters that proved to be significant predictors for differentiating true progression from pseudoprogression.
The intraclass correlation coefficient (0.0-0.20, poor; 0.21-0.40, fair; 0.41-0.60, moderate; 0.61-0.80, good; and 0.81-1.00, excellent correlation) was used to determine the level of inter-observer reliability for the ROI volume and the histogram parameters.
RESULTS
Among the patient clinical characteristics, only patient age was significantly higher in the true progression group than in the pseudoprogression group (Table 1). Two patients in the true progression group were being treated with steroids at the time of the first follow-up MR imaging (1 mg dexamethasone or 10 mg prednisolone) none of the patients in the pseudoprogression group were being treated with steroids at the time of the first follow-up MR imaging.
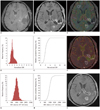
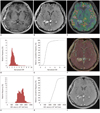
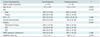
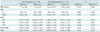
Table 2 summarizes the nCBV and ADC histogram parameters in the true progression group and the pseudoprogression group as measured by observers 1 and 2. For observer 1, the C5 of the cumulative ADC histograms (p = 0.009) and the mean ADC (p = 0.023) were significantly lower in the true progression group than in the pseudoprogression group. For observer 2, the C5 of the cumulative ADC histograms (p = 0.009) and the C95 of the cumulative nCBV histograms (p = 0.015) were significantly lower in the true progression group than in the pseudoprogression group. The C5 of the cumulative ADC histogram and the mean ADC measured by observer 1, as well as patient age, were used as input variables for a multivariable stepwise logistic regression analysis. In the multivariate analysis, the C5 of the cumulative ADC histogram was the only independently differentiating variable (p = 0.044) whereas patient age and mean ADC were excluded from the logistic regression equation. Likewise, we used the C5 of the cumulative ADC histogram and the C95 of the cumulative nCBV histogram measured by observer 2, as well as patient age, as input variables for another multivariable stepwise logistic regression analysis. In the multivariate analysis, the C5 of the cumulative ADC histogram was the only independently differentiating variable (p = 0.011) whereas patient age and C95 of the cumulative nCBV histogram were excluded from the logistic regression equation (Figs. 2, 3).
Regarding the C5 values of the cumulative ADC histograms measured by both observers 1 and 2, the cutoff values that provided a balance between sensitivity and specificity for the diagnosis of true progression and pseudoprogression were 892 × 10-6 mm2/sec and 907 × 10-6 mm2/sec, respectively. When newly visible, enhancing lesions after CCRT with TMZ having a C5 value below the determined cutoff values were diagnosed as true progression, the sensitivity, specificity, and area under the ROC curve were 90% (9 of 10 patients, 95% CI: 55.5-99.7%), 90% (9 of 10, 95% CI: 55.5-99.7%), and 0.880 (95% CI: 0.658-0.981), respectively, for observer 1 and 80% (8 of 10 patients, 95% CI: 44.4-97.5%), 80% (8 of 10, 95% CI: 44.4-97.5%), and 0.840 (95% CI: 0.609-0.963), respectively, for observer 2.
Inter-observer reliability was excellent or good for the ROI volume and all histogram parameters (intraclass correlation coefficient for ROI volume, 0.97; for C5 of the cumulative ADC histogram, 0.96; for the mean ADC, 0.96; for C95 of the cumulative nCBV histogram, 0.95; for C90 of the cumulative nCBV histogram, 0.96; for C70 of the cumulative nCBV histogram, 0.92; for PH of the nCBV histogram, 0.70; for the mean nCBV, 0.99).
DISCUSSION
In this study, we used the histogram analysis method to differentiate true progression from pseudoprogression based on the nCBV and ADC of newly visible, entirely enhancing lesions on the first MR imaging that was performed within two months after CCRT with TMZ. Our results suggest that the lower end values (C5) of the cumulative ADC histograms based on newly visible, entirely enhancing lesions could help in the differentiation of true progression from pseudoprogression.
Because DWI reflects water mobility that is influenced by cellularity, the ADC values are higher in cystic or necrotic areas than in solid tumor components (31, 32). In several studies (12-14, 18), recurrent tumors have shown significantly lower ADC values than those in radiation necrosis, which is possibly due to the differences in cellularity. In this study, the mean ADC had a limited role in the differentiation of true progression from pseudoprogression; however, the C5 of the cumulative ADC histograms was useful in the discrimination between true progression and pseudoprogression. The discordance between the mean ADC and the C5 can be explained by the fact that in true progression there are more cellular components in the newly visible, enhancing lesions after CCRT with TMZ compared to those in pseudoprogression, although both lesions were comosed of both viable tumors and post-CCRT necrosis (11, 17). Thus, the C5 of the cumulative ADC histograms may be more sensitive in predicting true progression because the high cellular portion of the enhancing lesion after CCRT with TMZ may be responsible for the further increase of the enhancing lesion. Our results are consistent with those of a previous study, in which the C5 of the ADC cumulative histogram was the most promising parameter for the preoperative differentiation of high-from low-grade gliomas (24).
The increased contrast enhancement observed in pseudoprogression is considered to represent the effect of treatment on the vasculature, which leads to transient vasodilation, increased vessel permeability, and local inflammation (6, 33). In contrast, one of the essential histopathological features of progression in high-grade glioma is angiogenesis, which is manifested by an elevated tumor vasculature density (34, 35). The CBV is believed to reflect angiogenesis (19, 36). Based on this perspective, several reports have studied the differentiation between recurrent GBM and radiation necrosis (15, 16, 22). Investigators have used histogram parameters such as the mean, maximum, minimum values and the PH, which seem to be useful in discriminating true progression from pseudoprogression. However, in our study, the CBV histogram parameters could not differentiate true progression from pseudoprogression. Similar to our results, Sugahara et al. (19) has previously reported on the overlap in the nCBV values between recurrent primary glial brain tumors and radiation necrosis. We speculate that the limited use of nCBV in our study may be due to the histopathological heterogeneity of the enhancing lesions as well as the inherent limitations associated with nCBV measurements in the vasculature with a disrupted blood-brain barrier (27, 37, 38). Moreover, with respect to CBV measurements, radiation-related transient vasodilation may not be distinguished adequately from angiogenesis within a residual tumor (35, 38).
Apart from the intrinsic limitations of any retrospective study, several other limitations of our study need to be mentioned. First, we used two different 3T MRI scanners with slightly different scan parameters. However, we optimized the sequences to decrease the difference in image quality between the two scanners and used the nCBV value instead of the rCBV value to minimize the effects of different type of MRI scanners or differences in the scan parameters. Nevertheless, we believe that there might be a slight bias in terms of image analysis of the ADC and nCBV maps. Second, there were two patients in the true progression group who were being treated with steroids at the time of the first follow-up MR imaging. Steroid administration in these patients may have influenced the differences in the nCBV or ADC values between the true progression group and the pseudoprogression group (22, 39). Third, this study included a relatively small number of patients. Although we could not find statistical significance regarding the nCBV values between the true progression group and the pseudoprogression group, there is a possibility that a small sample size could have caused negative results on histogram analysis of nCBV. Therefore, further studies with a larger sample size are warranted to verify and strengthen the statistical power of our findings.
In conclusion, our results suggest that the histogram analysis of ADC maps based on newly visible, entirely enhancing lesions can be a useful, objective diagnostic tool for the differentiation of true progression from pseudoprogression in GBM. The 5th percentile value (C5) of the cumulative ADC histogram obtained at b = 0 and 1000 sec/mm2 can be a promising parameter for the differentiation of true progression from pseudoprogression.
 XML Download