

 PDF
PDF ePub
ePub Citation
 Print
Print


INTRODUCTION
Supplemental screening breast ultrasound (US) has been shown to increase the cancer detection rate to 2.3-4.6 cancers per 1000 women screened (1-9). However, the main limitations of breast US are its low specificity and low positive predictive value (PPV). The PPV of screening breast US for suspicious lesions has been reported to be from 5.6-13.7% (8, 9). Cystic breast lesions have been reported to contribute to the low PPV of screening breast US for suspicious lesions (8, 9). Among the cystic breast lesions, complex breast masses containing both an echogenic solid component and a cystic component have been considered suspicious for malignancy based on an overall malignancy rate of 36% (97 of 270) (range, 18-62%) (10-15). Therefore, better characterization of an echogenic solid component is necessary to distinguishing benign from malignant complex breast masses.
Sonoelastography is an imaging modality that quantifies the relative stiffness of the target tissue compared with the surrounding tissue using US (16, 17). Recent studies have reported that sonoelastography is helpful in distinguishing benign from malignant solid breast masses and shows better specificity (range, 41.0-98.5%) than that of B-mode US alone (range, 7.1-98.8%) (18-26). In addition, the potential application of sonoelastography in distinguishing solid masses from cystic lesions has been reported in several studies (27, 28).
To the best of our knowledge, however, the additional effect of sonoelastography in distinguishing benign from malignant complex masses has not yet been reported. The cystic component tends to be softer than the solid component. Therefore, diagnostic criteria and the diagnostic performance of sonoelastography in cystic masses might be different compared to that in solid breast masses.
We hypothesized that the relative stiffness of the echogenic component of the complex breast mass could be used for the elasticity score of complex breast mass. The purpose of our study was to evaluate the additional effect of sonoelastography on the radiologists' ability to distinguish benign from malignant complex breast masses and to decide whether to perform biopsy by B-mode US.
MATERIALS AND METHODS
Patients and Lesions
Our institutional review board approved this study, and informed consent was obtained from each female patient prior to biopsy. Additional consent for this review study was not required. From May 2006 through November 2008, 2754 consecutive women underwent B-mode ultrasound, sonoelastography; and a subsequent ultrasound-guided needle biopsy was performed for 3089 breast masses that were classified as Breast Imaging-Reporting and Data System (BI-RADS) category 4, 5 or category 3. The images were saved as video clips in the avi format. Among these 3089 lesions, 2916 lesions were excluded because they were not complex masses, and 31 lesions were excluded due to poor image quality. Additionally, 24 lesions were excluded because they were followed up for less than 1 year after a benign biopsy. A complex breast mass was defined as a cystic lesion with an echogenic component such as a thick wall (> 0.5 mm), thick septations (> 0.5 mm), an intracystic mass or a solid mass with cystic areas (10).
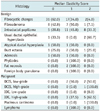
Finally, 118 complex breast masses in 118 women (mean age, 45.1 years; range, 24-71 years) were included in this study. Of the 118 lesions, 103 (87.3%) were benign and 15 (12.7%) were malignant. Malignant lesions included invasive ductal carcinoma (n = 8), ductal carcinoma in situ (n = 5), mucinous carcinoma (n = 1) and lymphoma (n = 1) (Table 1). Two intraductal papilloma lesions on core biopsy were proved to be ductal carcinoma in situ on subsequent excision. Benign lesions included fibrocystic changes (n = 50), fibroadenoma (n = 14), intraductal papilloma (n = 24), usual ductal epithelial hyperplasia (n = 3), atypical ductal hyperplasia (n = 2), duct ectasia (n = 4), adenosis (n = 2), phyllodes tumor (n = 1), fat necrosis (n = 2), and foreign body granuloma (n = 1). Three atypical ductal hyperplasia lesions on core biopsy were confirmed as one usual ductal epithelial hyperplasia lesion and two atypical ductal hyperplasia lesions on subsequent surgical excision. The mean duration of imaging follow-up for histologically benign lesions was 29.5 months (range, 12-75 months). No cases of breast cancer were detected during the follow-up period. The lesion type, based on a retrospective review of B-mode US images by two radiologists in consensus, was as follows: 67.8% (80 of 118) were intracystic or intraductal masses, 26.3% (31 of 118) were solid masses with a cystic component and 5.9% (7 of 118) were cysts with thick septations or thick walls. Lesion size was defined as the maximal diameter measured on B-mode US. The mean size of the malignant lesions was 15.6 ± 7.3 mm (range, 6-35 mm). The mean size of the benign lesions was 12.5 ± 7.3 mm (range, 4-47 mm). Among the 118 complex breast masses, 59.3% (70 of 118) showed a blue-greenred appearance on sonoelastography. The indications for US examination were as follows: in 50.0% (59 of 118) of complex breast masses, US examinations were performed for asymptomatic screening, in 22.9% (27 of 118) of complex breast masses, US examinations were performed due to palpability, in 10.2% (12 of 118) of complex breast masses, US examinations were performed due to pain, and in 17.0% (20 of 118) of complex breast masses, US examinations were performed due to nipple discharge. Of the 118 patients, 113 underwent mammography. On mammography, 46 patients (40.7%, 46 of 113) showed normal findings, 41 patients (36.3%) showed a non-calcified mass or focal asymmetry, 19 patients (16.8%) showed calcifications, 5 patients (4.4%) showed a mass with microcalcifications, and 2 patients (1.8%) showed architectural distortion.
US Data Acquisition
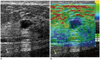
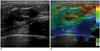
B-mode US and sonoelastography data were acquired by 1 of the 5 radiologists with 2-10 years of experience in breast US, using an EUB-8500 (Hitachi Medical, Tokyo, Japan) ultrasound system with a 14-6-MHz linear transducer. A target lesion was determined on a B-mode US image, and then real-time imaging with sonoelastography was separately saved as cine clips of at least 5 seconds per case in the audio-video interleave format on a hard drive for later review. The cine clip of sonoelastography was composed of simultaneously acquired split-screen images of B-mode US and sonoelastography. For sonoelastography, a region-of-interest (ROI) box was placed to focus on the target lesion and to include the surrounding subcutaneous fat layer and the superficial portion of the pectoralis major muscle layer. The target lesion was vertically compressed by the transducer under light pressure. A color-coding system for the degree of displacement of all pixels within the ROI was used for real-time strain images with a scale from red (greatest strain, softest component) to green (average strain, intermediate component) to blue (no strain, hardest component). The pressure and speed of manual compression were adjusted to depict the subcutaneous fat layer as a mix of red and green and the pectoralis muscle layer as blue.
The data acquisition procedure took approximately 1-2 minutes per case. After data acquisition, a histologic diagnosis was established in all women by using US-guided 14-gauge automated gun biopsy (n = 93, Pro-Mag 2.2, Manan Medical Products, Northbrook, IL, USA) or an 11-gauge vacuum-assisted device (n = 25, Mammotome; Ethicon Endo-Surgery, Cincinnati, OH, USA).
Readers and Reading Procedures
Five radiologists who had not performed the data acquisition participated as readers. They had undergone fellowship training in breast imaging and had a mean 4.6 years of experience (range, 2-10 years) interpreting mammograms and performing US examinations. They also had a mean 3.5 years of experience (range, 2-5 years) with sonoelastography imaging. They attended a 1-day training session prior to the initiation of this study. The training session consisted of a review of five cases of complex breast masses that were not included in our study. Reviewers were advised against overestimating the elasticity score based on the stiffness of an echogenic component of the lesion, since the cystic component tends to be markedly softer than the solid component (27, 28).
All readers were blinded to the mammographic, clinical, and histologic findings, as well as to the proportion of cases with benign and malignant histologic findings. A three-step reading was performed using the 3 data sets consisting of cine clips of B-mode US alone, those of sonoelastography alone, and a combined set of B-mode US and sonoelastography with a 4-week interval between each reading session. At the first reading session, readers assessed the likelihood of malignancy category with a score of 1 to 5. They were reminded that a likelihood of malignancy score of 2 or higher indicated that the lesion should undergo biopsy.
A score of 1 indicated a benign finding and a likelihood of malignancy of less than 2%, which is similar to the BIRADS final assessment category of 2 or 3 (11). As the scores increased from 2 to 5, the likelihood of malignancy increased from 3% to 100%. Readers were instructed that the likelihood of malignancy for scores of 2 to 5 was proportionally increased as follows: a score of 2 indicated a low suspicion for malignancy (ranging from 3% to 10%), a score of 3 indicated an intermediate suspicion (ranging from 11% to 50%), a score of 4 indicated a moderate suspicion (ranging from 51% to 94%), and a score of 5 indicated a high suspicion for malignancy (95% or higher). Specific imaging criteria for the likelihood of the malignancy score were not provided to the readers.
In the second session, 118 sonoelastographic images were reviewed. The readers scored the elasticity of the complex breast masses without information of the prior B-mode US score. The elasticity score was categorized as 0, 1, or 2 on the basis of the degree and distribution of strain in the echogenic component of the lesions as in previous studies (23). A score of 0 indicated an even strain for the echogenic component (i.e., the echogenic component was evenly shaded green). A score of 1 indicated strain in most of the echogenic component with some areas of no strain (the echogenic component had a mosaic pattern of green and blue). A score of 2 indicated no strain in the entire echogenic component (i.e., the entire echogenic component was blue). The order of cases in each reading session was randomized to reduce bias.
In the third reading session, both the B-mode US and sonoelastographic images were simultaneously reviewed. The readers scored the likelihood of malignancy with the information of their own scores from the prior B-mode US alone session and the prior sonoelastography alone session. At this session, the readers were asked to downgrade the likelihood of the malignancy score when an elasticity score of 0 was assigned and to upgrade the likelihood of the malignancy score when an elasticity score of 2 was assigned. But, the change in the likelihood of the malignancy score was not mandatory. In addition, for the lesions with an elasticity score of 1, the likelihood of the malignancy score was not changed.
Data and Statistical Analysis
The rate of malignancies was calculated according to the B-mode US and sonoelastography scores. To evaluate the additional effect of sonoelastography in distinguishing benign from malignant complex breast masses, a receiver operating characteristic curve analysis was performed for the B-mode US alone and the combined set of B-mode US and sonoelastography, and the results were compared between readers. The sensitivity and specificity (based on the binary management decision of whether to perform biopsy) of the B-mode US alone and the combined set of B-mode US and sonoelastography for each reader were also compared by using the McNemar test. Reader agreement between the five radiologists in classifying the elasticity score was estimated by using multirater κ statistics (29). The total number of changes in the biopsy decisions of each reader was calculated at each reading session.
P values of less than 0.05 were considered to indicate a significant difference. All statistical analyses were performed using statistical software (SAS system for Windows, version 9.1.3; SAS Institute, Cary, NC, USA).
RESULTS
Median Elasticity Scores of the Five Readers According to Histopathology
The most common benign histologic finding was fibrocystic changes, and the most common malignant histologic finding was invasive ductal carcinoma (Table 1). An elasticity score of 0 (44.7%, 46 of 103) was the most common score for benign lesions, whereas an elasticity score of 2 (60%, 9 of 15) was the most common score for malignant lesions.
Rate of Malignancy According to the B-Mode US and Elasticity Scores
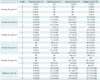
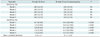
The mean rate of malignancy according to the likelihood of the malignancy score with B-mode US alone was 0% for a score of 1, 5.1% (range; 0-8.2%) for a score of 2, 12.3% (range; 6.7-18.2%) for a score of 3, 35.0% (range; 21.4-50.0%) for a score of 4, and 70.6% (range; 55.6-100%) for a score of 5 (Table 2).The mean rate of malignancy according to the elasticity score was 0% for a score of 0, 13.3% (range; 8.6-17.8%) for a score of 1, and 37.8% (range; 30-47.1%) for a score of 2. All lesions with an elasticity score of 0 or a B-mode US score of 1 were confirmed to be benign regardless of the other modality scores.
Receiver Operating Characteristic Analysis, Sensitivity, Specificity, Management Decision Changes
Compared with B-mode US alone, the combined use of sonoelastography and B-mode US improved the performance of all readers in distinguishing benign from malignant lesions (mean Az from 0.731 [range, 0.676-0.791] to 0.863 [range, 0.835-0.901]) (p = 0.007 for reader 1; p < 0.001 for readers 2 and 5; p = 0.002 for reader 3; p = 0.003 for reader 4) (Table 3).
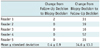
The sensitivities and specificities based on the binary management decision of whether to perform a biopsy were obtained. The sensitivity (biopsy decisions for malignant masses) of B-mode US was 100% in all five readers. This result did not change after the addition of sonoelastography (Fig. 1). However, the specificity (follow-up decisions for benign masses) of the combination of B-mode US and sonoelastography (mean, 37.1%; range, 21.4-51.5%) was greater than that of B-mode US alone (mean, 3.8%; range, 1.0-8.7%) for all readers (p < 0.001 for all readers) (Table 4). With respect to the net effect of management decision changes, the combined use of B-mode US and sonoelastography led to biopsy decisions being changed to follow-up decisions for a mean of 33.6% (34.6 of 103, range: 15.5-50.5%) of the benign masses (Table 5) (Fig. 2). For malignant masses, the management decision did not change in any of the cases after the addition of the sonoelastography findings.
Reader Agreement
Interobserver agreement was moderate for the elasticity score of 0 (κ = 0.541 ± 0.094), fair for the elasticity score of 1 (κ = 0.313 ± 0.090), and moderate for the elasticity score of 2 (κ = 0.574 ± 0.074). The overall agreement of the readers was moderate (κ = 0.467 ± 0.021 [standard error]).
DISCUSSION
In this study, we found that the combined use of B-mode US and sonoelastography improved the ability of all radiologists in distinguishing benign from malignant complex breast masses compared with B-mode US alone. The mean Az value increased from 0.731 to 0.863. Furthermore, the specificity of B-mode US significantly increased from 3.8% to 37.1% without sacrificing sensitivity. Our results are consistent with those of prior studies of solid breast masses, in which sonoelastography showed a higher specificity (range, 41.0-98.5%) than B-mode US (range, 7.1-98.8%) for the differentiation between benign and malignant lesions, and its sensitivity (range, 70.1-100%) was similar to that of B-mode US (range, 71.2-100%) (18-26).
The most interesting point in our results was that the sonoelastographic criteria, based on the stiffness of an echogenic component, were effective for characterizing complex breast masses. The diagnosis of complex breast masses showing internal echoes due to small particulate matter or reverberation artifacts has become increasingly common due to the advent of high resolution US and the increased usage of whole breast screening US (10). The utility of sonoelastography for the characterization of cystic breast lesions has not yet been established. Since sonoelastography has been developed to quantify the relative stiffness of the target tissue compared with the surrounding tissue; it is likely that the stiffness of the target tissue adjacent to the cystic component, which tends to be very soft, might be overestimated. There have been a few descriptive studies regarding its application in cystic breast lesions. In our study, the blue-green-red pattern that was observed in the cystic breast lesions can be explained by an aliasing artifact (28). The target or bull's-eye appearance found with the use of other machines can be explained by the subtle motion of the fluid (10). Another study suggested that correlation coefficients obtained by using the speckle-tracking algorithm were markedly lower in cystic lesions (27). Although the sonoelastographic features of the cystic component of breast lesions vary depending on the algorithm and display form of sonoelastography, all of these features are suggestive of the extremely soft nature of the cystic component. However, the diagnostic uncertainty due to the echogenic component within cystic breast lesions remains the primary reason for performing biopsies and obtaining benign results. The visualized anechoic areas in high-grade malignant complex breast masses might represent areas of necrosis and this finding might explain why invasive cancers appear as complex masses (10). Hence, we expected that sonoelastography could be helpful in distinguishing echogenic debris from necrotic malignancy in complex breast masses by demonstrating the inherent differences in their stiffness (16, 17). Indeed, we found that an elasticity score of 0 (44.7%, 46 of 103) was the most common score for benign lesions, whereas an elasticity score of 2 (60%, 9 of 15) was the most common score for malignant lesions. In addition, all 8 invasive ductal carcinoma masses in our study proved to be highgrade malignancies with necrosis.
With respect to the decision to perform biopsy, the sensitivity for all five readers was already 100% in the B-mode US alone session, and it did not change after the addition of sonoelastography in our study. A previous study on the application of sonoelastography in cystic breast lesions reported that because malignant complex cystic masses often show angular, indistinct or microlobulated margins or thick walls on B-mode US (10), they usually undergo biopsy without further characterization of the echogenic components. Indeed, in our study, there were no false negative results for the identification of malignant lesions based on B-mode US findings.
With respect to the specificity, the specificity of 3.8% without sonoelastography seems to be very low. This low specificity might partly be due to the overestimated categorization of B-mode US findings by the readers due to the nature of the study, which could have led to the overestimation of the additional role of sonoelastography. Another possible reason for this low specificity is the method of case selection in our study. In our study, we included those patients who had been initially sent to the radiology department for US-guided biopsy, and hence the lesions tended to have some suspicious findings. We believe that the main role of sonoelastography in distinguishing benign from malignant complex breast masses is for improving the specificity, which is similar to that in studies focusing on the characterization of solid masses (20, 21). Our study shows that a biopsy could be avoided in a mean of 33.6% (34.6 of 103) of the women with a benign complex breast mass.
With respect to the interobserver variability, the threepoint scale used in our study led to moderate overall agreement for the elasticity score (κ = 0.467), which means that this categorization is generally concordant. This result is similar to that in previous studies on lesion management using breast US (30) and breast MRI (31), in which a fair agreement (κ of 0.52) was reported.
Our study has some limitations. First, we only included cystic breast lesions that underwent US-guided core biopsy. Therefore, we cannot generalize our results to evaluate all types of cystic breast lesions that are commonly seen in clinical practice. Second, the sample size was also insufficient to arrive at a solid conclusion. However, our cases were selected from 3089 consecutive cases. Third, we performed the study using only one commercially available sonoelastographic machine, and the results might vary according to the type of the equipment.
In conclusion, there was an increase in the diagnostic performance with the combined use of B-mode US and sonoelastography for distinguishing benign from malignant complex breast masses. When complex breast masses with a low suspicion for malignancy show no stiffness in the echogenic component on sonoelastography, we suggest that follow-up can be recommended without missing the diagnosis of breast cancer, potentially leading to a reduction in the number of biopsies with benign results.

 XML Download