

 PDF
PDF ePub
ePub Citation
 Print
Print


Endovascular aneurysm repair (EVAR) is now recognised as an effective alternative to conventional open surgery for treating patients with abdominal aortic aneurysm (AAA) since it was first introduced into the clinical practice in 1991 (1, 2). Since then, many patients have been treated with different endovascular devices, including transrenal/suprarenal fixation, to enhance the stability in the proximal aneurysm neck (3-6). However, there are still a significant number of patients who remain unsuitable for such techniques because of their unfavorable aortic anatomy. The main limitation to successful EVAR is the presence of an unsuitable infrarenal aortic neck, which mainly includes a short (< 10 mm) or angulated proximal neck (> 60°), and the presence of thrombus/atheroma or severe calcification in the neck (7, 8).
The above problems limit endovascular repair of an AAA and these problems can be solved by using a customized designed fenestration stent-graft. Using a customized designed fenestration stent-graft was initially reported on in 1999, and this led to successful implantation in human subjects (9-12). Fenestrated stent grafting involves creating an opening in the graft material. This enables the first sealing portion of the stent graft to be positioned in a more stable part of the aorta with the customized fenestrations at the exact origin of the targeted vessels. Fenestrated endovascular grafts are now commercially available in Australia, some European countries and the United States.
Fixation of the fenestration to the renal arteries and the other visceral arteries can be achieved by implanting bare or covered stents across the graft-artery ostia interfaces so that a portion of the fenestrated stents protrudes into the aortic lumen. The short to mid-term outcomes of fenestrated stent grafting have been satisfactory (13, 14), yet there are concerns about the patency of fenestrated vessels and the fenestrated stents interfering with the hemodynamics, as normally about one-third of the fenestrated stents protrude into the aorta after implantation (15, 16). Although the exact mechanisms are not known, it has been reported that the placement of stents alters the hemodynamics and this coupled with wall movement may lead to the dispersion of late multiple emboli (17). The complex structures that are introduced into the blood flow (like the renal blood flow in the fenestrated repair) may enhance the biochemical thrombosis cascade (18, 19), as well as directly affecting the local hemodynamics. Therefore, the purpose of this study was to investigate the local effects of fenestrated stents on the renal arteries in terms of the flow pattern and the velocity changes in patient-specific models.
MATERIALS AND METHODS
Patient Data Selection and Image Segmentation
Two representative patients who had different AAA geometries and who were to undergo fenestrated stent graft repair were selected for inclusion in the study. The pre- and post-operative CT datasets were obtained with using a 64-detector row scanner (beam collimation 64×0.5 mm, Toshiba Medical Systems, Kingsbury, UK) with the following parameters: section thickness 0.5 mm, pitch 1.0, a reconstruction interval of 0.5 mm, 120 kV and 140 mAs. The fenestrated stent graft that was used in the study was a Zenith AAA endovascular graft (William Cook, Brisbane, Australia). The type of fenestration implanted in our patients involved small fenestrations (width and height: 6×6 mm or 6×8 mm) in the renal arteries. The fenestrated renal stents were successfully deployed into the bilateral renal arteries with an intra-aortic protrusion that measured between 4.4 mm and 5.8 mm. A type I endoleak (arising from proximal fixation of the stent graft) developed in one of the patients.
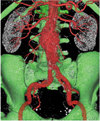
The regions of interest (aortic branches, the aneurysm and the stent-graft lumen) were identified using CT number thresholding (20), and segmentation was performed with a semi-automatic technique, seeded region growing and the creation and separation of objects. For generating 3D realistic AAA models, the CT volume data was postprocessed with commercially available software Analyze V 7.0 (AnalyzeDirect, Inc., Lenexa, KS). Figure 1 shows the segmented aortic branches and an aneurysm from a sample of the CT volume data.
Generation of the Geometric Aorta Models
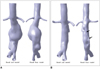
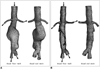
Following segmentation of the volume data, an unstructured surface mesh of triangles was created over the segmented volume by using the marching cube algorithm. The geometric information was saved in the 'STL (stereolithography)', which is a common format for computer-aided design (CAD) and rapid prototyping. The 'STL' file was converted into the CAD model files by using CATIA V5 R17 (Dassault Systems, Inc., Suresnes Cedex, France). The aorta mesh model consists of 2 parts: part 1 refers to the artery wall model of the pre- and post-stent grafting, which was generated by tetrahedral volume meshes with using ANSYS Meshing 11 (ANSYS, Inc., Canonsburg, PA). Part 2 is the blood flow model of the pre- and post-stent grating with insertion of the simulated fenestrated stent wires, and this was generated by tetrahedral and hexahedral volume meshes, respectively, with using ANSYS ICEM CFD 11 (ANSYS, Inc., Canonsburg, PA). Figure 2 shows the segmented aorta models based on the pre- and post-stent grafting CT data in patient 2, while Figure 3 demonstrates examples of the AAA mesh models of the pre- and post-fenestrated stent grafting in the same patient.
Simulation of the Fenestrated Renal Stents
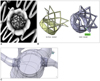
Although the segmented post-stent grafting AAA models were generated with CT number thresholding and other postprocessing methods (objection creation and separation), which focus on the high-density stent wires, a detailed configuration of the fenestrated renal stents inside the renal arteries could not be displayed in the final mesh models. To achieve this goal, we simulated the fenestrated stent structures that were later inserted into the aorta models to reflect the actual patient treatment. The models of the fenestrated stent wires were created by taking a reference from the intraluminal appearance of a fenestrated stent inside the renal artery that was visualized with 3D virtual endoscopy (Fig. 4A) (15, 16, 21, 22). First, we measured the renal artery diameter and we used it as the baseline for constructing the scaffolding of the stent wires. We then generated the structure profile of the stent wires to produce the surface and solid models (Fig. 4B). Finally, we inserted the simulated model into the renal artery with an intro-aortic protrusion of 5.0-7.0 mm, as is shown in Figure 4C. The thickness of the stent wires is about 0.4 mm in diameter, and the fenestrated renal stents consist of 6-8 V-shaped metal wires protruding into the abdominal aorta with a length of less than 7 mm, according to our previous experience (15), and so the simulated renal stents were generated and these reflected the realistic treatment of the patients.
In summary, there were a total of 4 entire aorta models (both pre- and post-stent grafting) that comprised the abdominal aorta, the aortic aneurysm, the renal arteries and the common iliac arteries. In addition, another two juxtarenal models were generated that focused on only the fenestrated renal stents to specifically study the flow changes to the renal arteries. Therefore, a total of 6 models were tested in our study. As the study mainly deals with the renal artery and fenestrated renal stents, we kept only the renal arteries, the main abdominal aorta and aneurysm, as well as iliac artery branches, in the segmented models, while we remove the celiac axis and the superior mesenteric artery branches. However, the ostium of these two branches still remained patent, thus allowing calculation of the flow velocity to these main branches.
Numerical Verification
In order to satisfy the criteria for mesh convergence, the meshes for both the fluid and solid domains were refined until we achieved mesh-density independence of the results. The maximum number of nodes per element was 18,020 and 71,921 for the artery wall mesh model and the blood flow mesh model, respectively. A coupled fluid-structure simulation was performed at a variable time step with different cardiac cycles so that the fluid forces and velocities across the fluid-solid interface could be demonstrated and calculated in our analysis.
Computational Two-Way Fluid Solid Dynamics
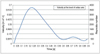
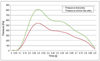
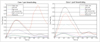
In order to ensure that our analysis reflects the realistic environment of human blood vessels, the normal physiological hemodynamics should be considered for the 3D numerical simulations. This allows studying the aneurysmal fluid mechanics by taking into account the instantaneous fluid forces acting on the wall and the effect of the wall motion on the fluid dynamic field. The fluid and materials properties for different entities were referenced from a previous study (23). The boundary conditions are time-dependent (24). The velocity inlet (the abdominal aorta at the level of celiac axis) boundary conditions are taken from the referenced value that shows measurement of the aortic blood velocity and Reynold's number (Fig. 5). A time-dependent pressure is also imposed at the outlets (Fig. 6).
The fluid (blood) is assumed to behave as a Newtonian fluid, as this was known to be true for the larger vessels of the human body. The fenestrated stent within the blood is set as a non-fluid material because it is solid and non-elastic. The fluid density was set to 1,060 kg/m3 and the viscosity was set at 0.0027 Pas, which correspond to the standard values cited in the literature (24). The flow was assumed to be incompressible and laminar. Given these assumptions, the fluid dynamics of the system is fully governed by the Navier-Stokes equations, which are shown as follows:

where v is the blood velocity vector, p is the blood pressure, ρ is the blood density, µ is the blood viscosity, f is the body force at time t acting on the fluid per unit mass, ∇ is the gradient operator and FΩ(t) is the fluid domain at time t.
The solid (blood wall) is assumed to be elastic material and isotropic. The wall is set at 1.0 mm thick in both the pre- and post-stenting AAA models. The solid density was set to be 1,120 kg/m3 with a Poisson ratio of 0.49 and a Young's modulus of 1.2 MPa, and these correspond to the standard values cited in the literature (25).
From these assumptions, the blood wall is governed by the following constitutive equation:
where σij is the stress tensor, Cijkl is elastic constant tensor, εkl is the strain tensor and SΩ(t) is the structural domain at time t.
The convergence of residual target 1×10⁻⁴ for the governing equations of the fluid domain was solved using ANSYS CFX 11 (ANSYS, Inc., Canonsburg, PA). The residual target 1×10⁻⁴ for the governing equations of the structural domain was solved using ANSYS Simulation 11 (ANSYS, Inc., Canonsburg, PA). The two-way fluid-structure interaction (FSI) calculations were used in the transient simulation, and the transfer forces with the coupling time steps were set at 0.025 s with a total duration of 0.9 s. The meshes are deformable during the computational fluid dynamic (CFD) analysis.
Based on the above parameters, the CFD analysis was performed with the blood flow simulated at different cardiac phases (the systolic and diastolic cycles). The blood flow was calculated in the aortic aneurysm, the renal arteries and the common iliac arteries in terms of the flow pattern, the wall pressure and the wall shear stress at pre- and post-fenestration by using ANSYS Multiphysic (ANSYS, Inc., Canonsburg, PA).
RESULTS
General Features
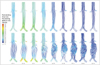
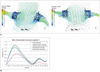
Changes of the aortic flow pattern were noted with placement of the fenestrated stent grafts and these changes were consistent with those reported in the literature (23-25). Based on assessing the streamline in the pre- and post-fenestrated geometries, flow recirculation patterns were observed in the pre-operative geometry that were not seen in the post-graft implantation where the flow was mostly attached to the graft. Figure 7 is the time-dependent velocity profile calculated at these main abdominal branches and the aneurysm. The apparent change of the velocity profile was noticed in the aneurysm with a more uniform flow pattern being observed after fenestrated stent grafting, as compared to the pre-stent grafting. The flow rate profile of the renal and common iliac arteries showed that the flow rate to the renal arteries was slower than that observed in the common iliac arteries, and this was especially apparent in the systolic phase. Figure 8 is an example showing the change of the flow pattern in patient 1, who was treated with a fenestrated stent graft. The blood flow became smoother and more laminar after fenestration (t = 0.1-0.9 s, top row images), when compared to the turbulent appearance observed at pre-fenestration (t = 0.1-0.9 s, bottom row images), and this is especially obvious in the diastolic phase for the pre-fenestrated flow analysis. The flow velocity was significantly increased inside the aortic aneurysm at the early systolic phase, as compared to that calculated at pre-fenestration. This indicates that the blood flowed through the new conduit formed by the stent graft instead of the dilated aorta.
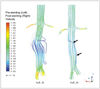
An endoleak was present in patient 2, with a similar flow pattern to that observed in the abdominal aorta, indicating there was a type I endoleak due to communication between the aneurysm sac and the systemic circulation. Figure 9 shows the flow pattern present in the aneurysm sac just below the right renal artery at a systolic phase of 0.2 s, which is the result of failure of proximal fixation of the stent grafts.
Flow Analysis to the Renal Arteries with Implantation of the Fenestrated Renal Stents
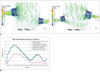
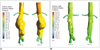
The flow velocities to the renal arteries at pre- and post-fenestration were calculated and compared between the two cases, and our analysis showed there was no significant interference with the renal hemodynamics in the presence of stent protrusion. With the simulated fenestrated stents protruding into the abdominal aorta, flow recirculation patterns were observed in the proximal part of the renal arteries when compared to that seen at the time of pre-operative graft implantation, although this did not lead to significant changes of the flow velocity. Figure 10A demonstrates the flow effect in patient 1 after fenestrated stent implantation with the recirculation patterns being observed in the fenestrated renal arteries, with a slight decrease in blood velocity to the renal arteries (Fig. 10B). While Figure 11A shows another example of the flow effect in patient 2 following fenestrated stent implantation with obvious recirculation patterns being observed in the bilateral renal arteries, and there is a slight decrease of the flow velocity to the renal arteries (Fig. 11B).
Wall Pressure and the Wall Shear Stress
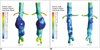
Changes of the wall pressure following implantation of a fenestrated stent graft were observed in the simulation, as is shown in Figure 12. It was observed that high pressure was seen within the aneurysm sac prior to fenestration. After implantation of the stent-graft, the maximum wall pressure was much lower inside the aneurysm sac. As shown in Figure 12, the wall pressure in the proximal renal arteries was similar to that observed in the common iliac arteries, but the wall pressure in the distal renal arteries was much lower than that observed in the common iliac arteries.
The areas of high wall shear stress were mainly situated in the regions of enhanced recirculation or vortices. This was apparently observed at the level of the renal arteries because of the vortices caused by the protruded renal stents, which were implanted in the renal arteries. After stent-graft implantation, the maximum shear stress was significantly increased inside the aneurysm, and this was because of the laminar blood flow through the stent graft when compared to the turbulent pattern in the dilated aorta aneurysm. Although the shear stress was reduced to some extent at the proximal aneurysm neck when compared to that calculated for the pre-stent grafting (Fig. 13), the difference was insignificant. A reduction of the shear stress at the renal arteries is most likely caused by the presence of stent wires inserted into the renal arteries, as is shown in Figure 13.
DISCUSSION
Our study is the first report to investigate the hemodynamic effect of fenestrated stents on the renal arteries. Although based on two sample patients, our results provide a basis for testing the effect of placing a fenestrated vessel stent into the renal artery, and our research findings provide insight into the treatment outcome of fenestrated endovascular repair.
The purpose of implanting a stent-graft is to exclude the aneurysm from the systemic blood circulation so that the aneurysm gradually shrinks and becomes smaller while the blood flows through the new conduit, which is produced by the stent graft. For this purpose of treatment, there is no difference between conventional aortic stent grafting and fenestrated stent grafting. The unique characteristics of fenestrated stent grafting involve creating an opening in the graft material with inserting fenestrated stents into vessels, and mainly the renal arteries. In addition, a fenestrated stent normally protrudes into the aortic lumen by less than 7 mm, as was reported in our previous studies (15). Therefore, there exists a potential risk for fenestrated stents to interfere with the renal blood flow. However, this was not observed in our study as the calculated velocity to the renal arteries did not show significant changes following implantation of fenestrated stents, and this indicates the safety of placing fenestrated stents into the renal arteries, and even with the presence of a certain length of stent protrusion.
Previous studies have been performed to investigate the fluid-stent graft interaction based on AAA models, yet these studies were focused on the situations of infrarenally or suprarenally fixation of stent grafts (26-30). There are few studies that have focused on flow analysis in the situation of fenestrated endovascular repair and this situation has not been systematically studied. In our study, realistic AAA models generated from two patients who were treated with fenestrated stent grafts were used to simulate the blood flow patterns and the velocity changes. Moreover, we simulated the actual intraluminal appearance of the fenestrated renal stents in relation to the abdominal aorta and renal arteries, which reflects the real treatment of patient. It is within our expectation that flow recirculation or a vortex was observed at the proximal renal arteries because of the intra-aortic protruded stents; however, the effect of fenestrated stents on the renal velocity was minimal, based on our analysis. Our results could be used as guidance for following up fenestrated repair
Although the intra-aortic stent protrusion is less than 7 mm in most of the situations, there exists the possibility that the stent protrusion could be as long as 10 mm or more in some cases, as was reported in our previous studies (15, 16). Thus, a simulation of various lengths of stent protrusion could provide an in-depth study of the hemodynamic effect of fenestrated stents. Moreover, the thickness of stent wires could increase since it is possible for the blood material to adhere to the wires and so this may affect the flow of blood into the renal artery. This was confirmed by a previous experimental study showing that small bits of materials were deposited onto the wire, leading to the increase of the cross-sectional area of the stent wire (30). A simulation of wire thickness of more than 0.4 mm deserves to be performed to reflect this situation and to analyse the subsequent flow interference. Therefore, a further flow analysis based on different wire thicknesses is needed so that a robust conclusion can be drawn. Research on this area is currently under investigation by our group.
Studies have shown that low shear stress could lead to a reduction of the cross-sectional area of the renal ostium owing to the presence of stent wires (because of formation of neointimal hyperplasia on the stent surface) (31, 32). It has been reported that augmentation of the wall shear stress is accompanied by a local reduction in the neointimal hyperplasia (31). Another potential risk of low shear stress is the formation of artery plaque or atherosclerosis in the aortic branches (32). Our flow analysis observed the reduced wall shear in the renal arteries following insertion of fenestrated renal stents, and this indicates the potential risk of interference with the renal hemodynamics or the development of stenosis. From a clinical point of view, we consider that hemodynamic analysis of the interference of the renal stents is important for understanding the long-term safety of fenestrated stent grafting, although further studies are needed to confirm it.
Despite the realistic models used in our study, there are some limitations that should be addressed. First, the aorta models were rigid rather than elastic. In the normal physiological situation, the artery wall moves with the cardiac cycles. Although our analysis was based on a two-way FSI that reflects the effect of pulsatile forces on the arterial wall, movement of the aortic wall during the cardiac cycles was not considered in our results. This explains to some extent that the wall pressure measured in the renal arteries was lower than that in the iliac arteries as we used rigid models in our simulation, as is demonstrated in Figure 12. Gaillard et al. (33) in their study reported that for the rigid model, the vortex created during the cycle in the distal segments does not impact on the wall (with the vortex remaining confined to the proximal part). However, in the soft model, the vortex migrates to the distal part during the cardiac cycle and impacts the wall, and so it can weaken it. This needs to be addressed in future experiments. Our analysis based on rigid models also resulted in the low flow rate to the renal arteries when compared to the high flow rate noticed at the common iliac arteries, as is shown in Figure 7. In the normal physiological condition, the renal arteries have low peripheral resistance, and so high flow volume with persistent diastolic flow reaches the renal arteries and this leads to a high flow velocity profile. In contrast, a low flow volume with a low flow velocity profile is seen in the common iliac arteries due to the high peripheral resistance and the low diastolic flow. The low flow rate to the renal arteries is particularly obvious in the systolic phase, and it is mainly because of the simulated blood flow running through the rigid tube (model) with side branches (simulated renal arteries) rather than the blood flow passing through the elastic arteries with movement during the cardiac cycles. Despite this limitation, our analysis of the flow velocity to the renal arteries in the presence of fenestrated renal stents is valid as the simulated stents protrude into the aortic lumen; thus, their effect on the flow analysis is not determined by movement of the arterial wall (like in aorta models). Second, only two cases were tested in our study, which is another limitation. Further studies composed of more patients with different aortic geometries should be performed to enable drawing a robust conclusion. Last, although we included a case with type I endoleak in the simulated models, we did not perform measurements of the sac pressure. The FSI simulations reported by Li and Kleinstreuer (34) indicated that the stent-graft migration force is greatly dependent on the difference in the pressure levels between the stent-graft and the aneurysm cavity. Traditional imaging-based follow-up of AAA after EVAR has been restricted to detecting endoleaks and the changes in the AAA morphology and it has proved to be unreliable in preventing aneurysm rupture (35). Pressure measurements of the aneurysm sac are increasingly being recognized as the most accurate indication of AAA exclusion. Further studies based on soft aorta models with a focus on the pressure level differences between the aneurysm sac and the stent-graft could be valuable for detecting endoleaks, which cannot be detected by routine imaging techniques, and for predicting stent-graft migration.
In conclusion, our preliminary study using the FSI method shows that the interference of fenestrated stents with the renal blood flow is minimal and our study demonstrates an insignificant hemodynamic effect, indicating the safety of placing fenestrated stents into the renal arteries. The wall shear stress was reduced to some extent following implantation of the renal stents, indicating the potential risk of thrombus formation or stenosis at the renal arteries. Further studies that will include various size stent protrusions and different wire thicknesses, as well as measurements of the aneurysm sac pressure, are necessary for improving our understanding of the long-term safety of fenestrated stent graft repair of AAA.
 XML Download