

 PDF
PDF ePub
ePub Citation
 Print
Print


Determination of myocardial infarction size is important for initial prognostic assessment of clinical outcome, and is also a prerequisite for prediction of the extent of salvageable myocardium around myocardial infarction. MR imaging has been used for this purpose and is regarded as a promising approach, providing excellent tissue contrast as well as high spatial and temporal resolution (1).
The high signal intensity of myocardial infarction at T2-weighted MR imaging has a linear relationship with increased water content of the myocardium (2). However, the size of myocardial infarction at T2-weighted MR imaging has been reported as larger than infarct size measured at triphenyl tetrazolium chloride (TTC) histochemical staining (3, 4), and the overestimation of infarct size is therefore unavoidable.
Contrast-enhanced MR imaging of myocardial infarction may, on the other hand, reflect different physiological information according to the time after administration of contrast agents, e.g. early versus delayed. Early enhancement is due, in part, to the patency of the large epicardial artery and microvessels in the myocardium, and is thought to reflect myocardial perfusion (5, 6). Reports have shown that the perfusion defects seen at myocardial perfusion MR imaging were smaller than the hyperenhanced areas revealed by gadolinium-diethylene triamine penta-acetic acid (Gd-DTPA)-enhanced MR imaging, and correlated well with the infarcted areas seen at TTC staining (3). Although the matter is still controversial, delayed enhancement after the use of Gd-DTPA seems to overestimate the size of myocardial infarction by approximately 10-20% (6-8). A necrosis-avid MR contrast agent, bis-gadolinium mosoporphins (Gadophrin-2; Schering, Berlin, Germany), has become available for experimental purposes and appears to have a high affinity for necrotic tissue. The hyperenhanced areas revealed by gadophrin-2-enhanced MR imaging correlate well with the infarcted areas seen at TTC staining (4, 9).
Using combined MR imaging, other investigators have recently attempted to distinguish between reversibly and irreversibly damaged myocardium. Saeed et al. (10) suggested that differences in the size of the hyperenhanced region demarcated by gadophrin-2 and Gd-DTPA might provide an estimation of salvageable myocardium. In contrast, Rogers et al. (11) found that combined assessment of early and delayed enhancement patterns using only Gd-DTPA might predict late functional recovery after reperfused myocardial infarction.
For accurate evaluation of viable myocardium, a standard MR imaging method depicting irreversibly damaged myocardium should first be determined. To the best of our knowledge, the perfusion defect seen at myocardial perfusion MR imaging has not been compared with true infarct size. The purpose of this study was, therefore, to determine whether, in acute reperfused myocardial infarction, the perfusion defect seen at myocardial perfusion MR imaging can be considered as irreversibly damaged myocardium.
MATERIALS AND METHODS
This experimental study was approved by the institutional committee for animal research. In 14 adult cats, the left anterior descending (LAD) coronary artery just distal to the first diagonal branch was occluded for 90 minutes, prior to reperfusion for 90 minutes. The animal preparation methods employed have previously been described in detail (9).
For MR imaging, a 1.5-T imager (Magnetom Vision; Siemens Medical Systems, Erlangen, Germany) with a 27-cm-diameter circularly polarized head array coil was used. During the procedure, heart rates were kept between 140 and 170 beats per minute, and with every beat, 60 short-axis myocardial perfusion images were sequentially obtained at the left midventricular level using an electrocardiograhy (ECG)-triggered turbo fast low-angle shot (FLASH) sequence. In order to allow magnetization to reach a steady state, five images were acquired prior to a bolus injection of 0.05 mmol/kg of gadomer-17via the femoral vein. The acquisition parameters for the inversion-recovery turbo-FLASH imaging sequence were as follows: repetition time, 2.5 msec; echo time, 1.2 msec; inversion time, 200 msec; flip angle, 8°; field of view, 306×350 mm; matrix, 90×128; slice thickness, 10 mm; and acquisition time, 45-55 seconds. At the same slice position, ECG-triggered breath-hold T1-weighted turbo spin-echo images were then obtained 60, 90, and 120 minutes after administration of 0.025 mmol/kg of gadophrin-2, also via the femoral vein. This enhanced imaging was performed six hours after myocardial perfusion MR imaging and with the following parameters: repetition time, 400-600 msec (according to the heart rate); echo time, 30 msec (with 13 echo trains); field of view, 210×280 mm; matrix, 130×256; slice thickness, 5 mm; and acquisition time, 9-12 seconds. Since the plasma half-life of gadomer-17 is approximately 0.5-1.5 hours and the interval was thus at least 4-5 times the half-life, six hours was regarded as long enough to nullify the effect of previously-injected gadomer-17. Five cats died before the completion of image acquisition, and nine, weighing 3.5-5.1 (mean, 4.38) kg, were therefore included in this study.
After imaging studies were complete, the cats were sacrificed. Their excised hearts were cut into five or six consecutive, 5-mm-thick slices in the same plane as that in which the MR images were obtained. The specimens were then immersed in 1.5% TTC solution at 36℃ for 15 minutes, and after staining were stored in 10% formalin solution for 12 hours. The area of infarction was defined as a TTC-unstained area, and was used as a reference for determining true infarct size.
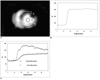
In all nine cats, perfusion defects were present at the anterior and septal wall of the left ventricle, and to verify this, time-signal intensity curves were obtained at the left ventricular cavity, the site of the defect, and the posterior wall of the left ventricle (normal myocardium) (Fig. 1A). The time-signal intensity curves demonstrated a characteristic pattern of myocardial enhancement (Figs. 1B, C). There was rapid wash-in and wash-out of contrast agent at normal myocardium, but a slow wash-in and disturbed wash-out at the perfusion defect led to a gradual increase in signal intensity. We measured the size of the defect in the image in which it was best visualized, and then measured the hyperenhanced areas in the gadophrin-2-enhanced image which showed maximal enhancement. This was performed manually, twice, and averaged without knowledge of the TTC staining results. The sizes of the perfusion defects, hyperenhanced areas, and TTC-unstained areas were expressed as a percentage of the corresponding left ventricular myocardial (LVM) area, calculated by subtracting the area outlined by the endocardial surface of the left ventricle from that outlined by its epicardial surface.
Using paired Student t tests, the size of the perfusion defect was compared with the corresponding unstained area seen at TTC staining and the hyperenhanced area at gadophrin-2-enhanced MR imaging. Correlation between the sizes of abnormal areas seen at MR (myocardial perfusion and gadophrin-2-enhanced) imaging and true infarct sizes, at TTC staining, were analyzed using Spearman's correlation coefficient. A p value of less than 0.05 was considered significant.
RESULTS
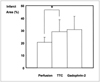
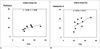
At both MR imaging and TTC staining, all nine cats showed evidence of myocardial infarction in LAD territory. Although myocardial perfusion MR imaging showed lower spatial resolution, perfusion defects were also obvious and measurable. The sizes of these at gadomer-17-enhanced perfusion MR imaging, and of unstained areas at TTC staining and hyperenhanced areas at gadophrin-2-enhanced MR imaging were 20.4 ± 4.3%, 29.0 ± 9.7%, and 30.7 ± 10.6% of the LVM area, respectively (Fig. 2). The perfusion defects seen at myocardial perfusion MR imaging were significantly smaller than unstained areas at TTC staining and hyperenhanced areas at gadophrin-2-enhanced MR imaging (p < .01). The sizes of both the perfusion defect at myocardial perfusion MR imaging and the hyperenhanced area at gadophrin-2-enhanced MR imaging correlated well with the sizes of unstained areas at TTC staining (r = .64, p = .062 and r = .70, p = .035, respectively) (Fig. 3), though the statistical significance of this correlation was marginal.
DISCUSSION
In the present study, the perfusion defects seen at myocardial perfusion MR imaging were significantly smaller than unstained areas at TTC staining and hyperenhanced areas at gadophrin-2-enhanced MR imaging. According to some researchers (3, 12), however, this defect matched the TTC-unstained area. Similar correlation was observed in our study, though the defect was obviously smaller than the TTC-unstained area. As far as we are aware, these results have not been previously reported, and probably indicate that in acute reperfused myocardial infarction, an area of reperfused but necrotic myocardium is present. The findings that time-signal intensity curves showed a characteristic pattern of myocardial enhancement and all perfusion defects were smaller than areas at risk served as verification of the perfusion defect seen at myocardial perfusion MR imaging.
This defect may represent the area where the microvasculature was occluded, and has therefore been described as a "no reflow phenomenon" (13, 14). The defect might not simply be an area of irreversibly injured myocardium, but may represent greater myocardial damage. This assumption is supported by the finding that all perfusion defects in our study were located in the central or endocardial portion of acute reperfused myocardial infarction. Previous studies also indicated that the presence of the perfusion defect at MR imaging correlated with poorer global ventricular function during the early post-infarction phase (15) and indicated that more frequent long-term cardiovascular complications would arise (16). Moreover, the defect remained a strong prognostic marker even after control of infarct size (16). Like infarct size, the size (as well as the presence) of perfusion defect is prognostically significant.
Because we used gadomer-17, an intermediate-sized contrast agent which acts like a blood pool contrast agent during the first pass, the perfusion defect could be more accurately delineated in this study than where Gd-DTPA was used. A blood pool contrast agent limits contrast agent diffusion through the endothelial membrane (17).
Although little is known about the mechanism of gadophrin-2 accumulation in necrotic tissue, initial studies showed that gadophrin-2 has a peculiar affinity for necrotic tissue (18, 19). In experimental studies involving reperfused myocardial infarction, gadophrin-2-enhanced MR imaging accurately indicated the extent of irreversibly damaged myocardium, showing strong and persistent hyperenhancement (4, 9). Our results, in which the extent of hyperenhanced areas at gadophrin-2-enhanced imaging was somewhat similar to that of unstained areas at TTC staining, were in accordance with those obtained previously.
Correlation between the findings of MR imaging and TTC staining in our study was relatively weak compared with that of earlier reports (4, 9), and this may be because we did not analyze the whole LVM but only a single slice. Previous studies found that the limits of agreement between MR imaging- and TTC-based measurements of infarct size were wider in single-slice comparison than in whole-LVM comparison (4). In addition, some change in slice position and anatomical distortion is inevitable when preparing heart specimens for TTC staining.
The present study suffers certain limitations. First, follow-up was not performed after acute myocardial infarction, and functional recovery in reperfused myocardial infarction could thus not be evaluated. We do, however, focus on measurement of the perfusion defect at myocardial perfusion MR imaging during the acute stage. Second, the difference in slice thickness (myocardial perfusion MR imaging: 10mm; gadophrin-2-enhanced MRI: 5 mm; and TTC-stained specimen: surface) could affect the precision of the match. Compared to heart specimens, MR imaging could overestimate infarct sizes due to the partial-volume effect. Because the infarct sizes we encountered are considered sufficiently large, this concern may, however, be trivial. In small infarctions, on the other hand, infarct sizes can be greatly affected by slice thickness and the partial-volume effect.
In conclusion, a perfusion defect seen at myocardial perfusion MR imaging underestimates the true size of acute reperfused myocardial infarction in a cat model. It may represent a more severely damaged area of infarction and is probably prognostically significant.
 XML Download