

 PDF
PDF ePub
ePub Citation
 Print
Print


Renal Doppler US provides valuable hemodynamic information in various renal diseases including urinary tract obstruction, renal parenchymal disease, renal vascular disease, and renal tumor (1-3). Nowadays, Doppler US is an essential part of renal US. Among Doppler indices, resistive index (RI) is most commonly used. To measure this accurately, it is essential to demonstrate intrarenal arterial branches with sufficient Doppler signal (4, 5).
Conventional color Doppler (CCD) or power Doppler US has been used for this purpose. CCD gives information about flow direction, but with limited sensitivity, while power Doppler has higher sensitivity to slow flow but does not give directional information.
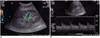
Pulsatile flow detection (PFD) is a newly developed function of color Doppler which displays pulsatile flows in distinct color and with high sensitivity (Fig. 1). The purpose of this article is to assess the usefulness of PFD in measuring RI and to compare PFD with CCD in renal Doppler US.
MATERIALS AND METHODS
Thirty-one patients (17 men and 14 women) who were referred for kidney US and were randomly selected were included in this study. Six patients had only a single functioning kidney due to previous nephrectomy or transplantation, and thus, fifty-six kidneys were examined. To avoid inter-examiner variability, the author performed all examinations.
A 3-8 MHz transducer with PFD function (Logiq 700, General Electric Medical Systems, Milwaukee, Wis., U.S.A.) was used, the patients being divided into two groups. Group A included 30 kidneys in 16 patients, in whom CCD was used first to locate a sample volume to measure RI, and RI was measured again using PFD (Fig. 1). Group B included the remaining 26 kidneys in 15 patients in whom the order of examinations was reversed in order to eliminate any bias due to ordering.
After choosing an imaging plane optimal for Doppler study, a gray-scale image was obtained and the current time was noted. This image was used as the starting point, and the subsequent time in seconds required to obtain a spectral wave sufficient for RI measurement was recorded. In each kidney, RI was measured twice in the same manner. One report has emphasized that the correct diagnosis of segmental renal arterial stenosis depends on whether multiple sampling locations are chosen (6), but in this study, which focused on a comparison between PFD and CCD, RI was measured at a single location, without targeting a specific portion of kidneys (e.g. upper, mid-, or lower pole) for such measurement. Instead, the same imaging plane was used as the starting point in both CCD and PFD examinations, and in both procedures all Doppler parameters were kept identical. In color Doppler, the wall filter was set to 27 and the velocity scale or pulse repetition frequency (PRF) was 630 Hz. In spectral Doppler, sample volume size was 3 mm, wall filter was 56, and PRF was 2700. This setting was most commonly used in this study, but some modification was applied according to the patient involved.
Spectral waveform quality was graded as 0, 1, or 2, according to the degree of spectral broadening encountered and the consistency of the waveform pattern. Grade 0 indicates 'poor', with difficulty in locating the cursor to measure peak velocity due to spectral broadening, or the reproduction of less than two waves with the same peak velocity and pattern. Grade 2 indicates 'excellent', with spectrums clear enough to easily locate the measurement cursor, and the consistent reproduction of more than four waves. Grade 1 indicates an intermediate quality, between grade 0 and grade 2.
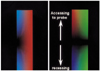
In PFD there are two modes of coloring, three-color and two-color (Fig. 2). In the former, pulsatile flow is green and added to the coloring of CCD, which is red (forward) and blue (backward). In the two-color mode, all pulsatile flows are red, while non-pulsatile flows are blue. In applying the PFD function, we only used the three-color mode.
RESULTS
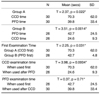
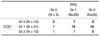
RI examination times are shown in Table 1. In group A, the mean time was 70.3 secs with CCD and 39.8 secs with PFD, while in group B the respective times were 24.6 secs and 42.7 secs. In both groups A and B, the first examination time was longer than the second (p = 0.022 in group A; p = 0.0014 in group B).
In group B (with PFD first), the first examination took less time than in group A (mean 42.7 secs vs. mean 70.3 secs; p = 0.031). Furthermore, CCD showed a statistically significant difference in examination time (p = 0.0004) when used after PFD (mean, 24.6 secs) than when used first (mean, 70.3 secs) whereas PFD did not (39.8 vs. 42.7 secs, respectively; p = 0.37).
Waveform quality is summarized in Table 2. Grade 2 waveforms were more common in PFD examinations than in CCD examinations (39.3% vs. 23.2%, respectively), while grade 0 waveforms were less common in PFD than in CCD examinations (8.9% vs. 21.4%, respectively). In the same kidney, 83.9% of waveforms (47/56) showed the same or a better grade with PFD than with CCD, though this finding was not statistically significant.
DISCUSSION
PFD was developed by GE Medical Systems in 1999 and installed first in their Logiq500 series. It is a function of color Doppler, and can be activated only in that mode. Compared with CCD, it provides additional information (on flow pulsatility) and is more sensitive.
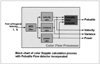
To distinguish pulsatile flow, a 'pulsatile flow detector' was added to the color flow processor (Fig. 3). PFD, based on power Doppler imaging (PDI) or directional PDI, is highly sensitive in the detection of blood flow and also suppresses random noise. To avoid the misinterpretation of non-arterial flows such as that of the portal vein or inferior vena cava, which show some pulsatility, this is determined not only by velocity difference but as a function of velocity difference, variance and power. In some flows, however, overlapping inevitably occurs.
Degree of pulsatility may be influenced by pulse repetition frequency (PRF). In a given flow, if PRF is set too high, the pulsatility of that flow appears to be low, and to avoid misinterpretation the optimal PRF setting is needed.
As mentioned above, PFD has two color modes (Fig. 2), and in CCD, because green (only) is added to pulsatile flows, a format with which most users are familiar, the three-color mode is sometimes preferred. The two-color mode can, however, produce images which are more readily understood by clinicians and patients, displaying arteries as red and veins as blue, as in an anatomy textbook.
Resistive index is commonly used as an important parameter in the evaluation of renal parenchymal diseases, acute obstruction, renal vascular diseases, renal masses, and transplanted kidneys (1-3). However, measuring RI is sometimes troublesome, especially when patients have difficulty in breath-holding or in chronic renal disease in which the kidneys are small and show only slight vacularity at CCD. Besides these patient factors, examiners who have little experience of renal Doppler US may have difficulty in selecting optimal arteries for RI measurement, resulting in unreliable RI readings and the lengthening of examination time.
Intrarenal arteries that are colored green at PFD can be good sites for obtaining clear spectral waveforms with a high Doppler signal and therefore for accurately measuring RI (Fig. 1). Use of the PFD function appears to facilitate the location of interlobar arteries optimal for RI measurement: examination time may be shortened by about 30 seconds, and CCD examination time may also be shortened if followed by PFD examination.
Although waveform quality showed no statistically significant difference between PFD and CCD examinations, 83.9% (47/56) of the waveforms in PFD were the same quality or better than those in CCD, a finding which indicates that by using the PFD function, RI examination times can be shortened without affecting quality.
It might appear that within the overall time frame of a Doppler US examination, a difference of 30 seconds is trivial. However, shortening the examination time by using the PFD function may be quite helpful, especially when a patient's condition does not allow adequate breath-holding for Doppler US.
PFD can also be a useful tool in organs other than the kidney. It can differentiate between hepatic arteries and portal veins, both of which flow in the same direction, and without being affected by flow direction, can display arterial flows in hypervascular tumors. Few articles describing the value of PFD have, however, been published (7).
In conclusion, by demonstrating the optimal location for Doppler sampling in kidneys through the visualization of distinct color at CCD, PFD may be helpful in accurately and effectively measuring RI, and can shorten examination time without affecting the quality of the Doppler spectrum.
 XML Download