

 PDF
PDF ePub
ePub Citation
 Print
Print


INTRODUCTION
Several types of spinal cord pathologies are encountered in the clinical setting, including inflammatory, neoplastic, compressive, and traumatic myelopathy. It is important to appropriately diagnose different spinal cord pathologies and provide suitable treatment as these conditions could cause severe neurologic deficit. However, inflammatory and neoplastic conditions may present with some overlapping features on conventional spine magnetic resonance imaging (MRI) or in the clinical setting, and it is hence difficult to distinguish between them (12). Spinal cord biopsy could be used to confirm the lesion pathology; however, it is associated with the risk of cord damage, leading to neurologic deficit. Fiber tracking (FT), which involves three-dimensional representations of white matter fibers based on diffusion tensor imaging (DTI), has been considered as a source of additional imaging information in such cases. A previous study has reported the FT findings of various myelopathic conditions (3). In that study, none of the 4 patients with inflammatory conditions had infiltrated, displaced, or interrupted fibers, whereas all 8 patients with neoplastic conditions had infiltrated, displaced, or interrupted fibers. Another study in patients with multiple sclerosis indicated that enhanced acute demyelinating lesions may occasionally cause termination of fiber tracts in cases where the fractional anisotropy (FA) value decreases below the threshold selected for FT (4). Although several studies have examined spinal FT, the findings of different myelopathic conditions remain controversial. In the present study, we aimed to compare DTI findings, while specifically focusing on comparison of the FT findings between inflammatory and neoplastic intramedullary spinal lesions.
MATERIALS AND METHODS
Subjects
The Institutional Review Board approved this prospective study, and informed consent was obtained from all patients who were enrolled in this study. In this study, we enrolled patients with spinal cord pathologies who presented to our hospital between November 2013 and April 2015, were aged 18 years or older, had myelopathy symptoms, who showed intramedullary lesions on conventional MRI that were suspected to be either inflammatory myelopathy or spinal neoplasms, and had no traumatic contusions or compressive myelopathy. We aimed to enroll 10 patients with suspected inflammatory myelopathy and 10 patients with suspected intramedullary neoplasms; DTI was performed in 10 patients from each category. The inclusion criteria were based on the above-mentioned enrollment criteria, which included successful DTI, as well as FT, and the presence of pathologically or clinically confirmed inflammatory myelopathy or spinal cord neoplasms. If the MRI showed that the lesions had disappeared or decreased in size at any point during the follow-up, the lesions were clinically categorized as inflammatory conditions. If the lesions were observed to be stable or had increased in size on the follow-up MRI performed 1 year after the initial MRI and had imaging features suggestive of neoplasms (e.g., mass effect, cord swelling, hemorrhage or syrinx) without clinical symptoms indicative of inflammatory myelitis such as repeated episodes, they were clinically categorized as spinal cord neoplasms.
Based on these inclusion criteria, 12 patients were excluded. One patient was excluded because he had a pathologically confirmed cavernous hemangioma, which is neither an inflammatory nor a neoplastic condition. One patient was excluded because she had a stable lesion showing possible features of a cavernous hemangioma. She did not undergo biopsy; therefore, cavernous hemangioma could not be excluded, and an inflammatory or neoplastic condition was not confirmed. One patient was excluded because he was not available for follow-up. Two patients were excluded because of failed FT acquisition due to a technical error and 7 patients were excluded because of loss of DTI data.
DTI Technique
A 3 Tesla MR scanner (Achieva and Ingenia, Philips Medical Systems, Best, the Netherlands) was used in this study and 16- channel neurovascular coils were applied to all subjects. Sensitivity encoding single-shot echo-planar imaging with a sensitivity encoding factor of 4 was used for sagittal DTI of the spinal cord, with a b-value of 600 s/mm2, 15 diffusion gradient directions, 4 excitations, and 2 mm slice thickness (5). The diffusion gradient strength was 80 mT/m, the foldover direction was anterior-posterior direction, and the fat shift direction was posterior direction. The repetition time/echo time value was 3378/56 ms, the echo-planar imaging factor was 19, the acquisition matrix was 68 × 68 (reconstruction matrix, 128 × 128), and the field of view was 250 × 250 mm. The scan time was 3 min and 34 sec, whereas the reconstructed voxel size was 1.95 × 1.95 × 2 mm.
Measurements of FA
After sending all the source DTI images to a personal computer, a technician who was blinded to the clinical condition of each patient measured the FA value in the spinal cord at the center of the main lesion, by referring to the midsagittal T2-weighted imaging scans. FA measurements were obtained for each voxel inside the spinal cord in the axial image. The average FA values for all voxels inside the spinal cord were estimated (6). For statistical analysis, the calculated average FA value for each patient was compared between the 2 groups (inflammatory and neoplastic).
Reconstruction of FT
After sending all the source DTI images to a personal computer, a technician performed FT of the spinal cord by using PRIDE software (Philips Medical Systems), based on fiber assignment by the continuous tracking method (7). The thresholds for tracking termination were 0.15 for FA and 27° for the angle between 2 contiguous eigenvectors in all subjects.
Interpretation of FT
A radiologist who was blinded to the clinical outcomes and histories of the patients reviewed the FT images and morphologically categorized the findings into intact, displaced, or interrupted. Intact fibers were defined as spinal cord fibers that showed no deviation and had normal connectivity. Displaced fibers were defined as spinal cord fibers that showed an eccentrically deviated course with preserved connectivity. Interrupted fibers were defined as spinal cord fibers that showed a break in the connection. The radiologist reviewed randomly ordered images 3 times at 2-week intervals. If a lesion was classified into the same category at least twice, it was confirmed to belong to that category.
Statistical Analysis
Statistical procedures were performed using a commercially available software package (SPSS 19.0; IBM Corp., Armonk, NY, USA). The Mann-Whitney U-test was used to compare the average FA values at the center of T2-hyperintensity in the spinal cord, between cases with inflammatory and neoplastic intramedullary spinal cord lesions.
RESULTS
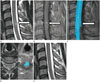
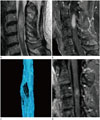
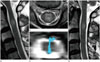
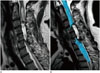
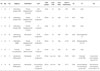
There were 8 patients with pathologically or clinically confirmed inflammatory or neoplastic intramedullary spinal lesions who underwent successful DTI and FT. Five patients (2 women and 3 men) aged 34–60 years (mean age, 46.2 ± 10.1 years) had pathologically or clinically proven inflammatory intramedullary spinal cord lesions and 3 patients (2 women and 1 man) aged 18–55 years (mean age, 42.3 ± 21.1 years) had pathologically or clinically proven neoplastic intramedullary spinal cord lesions. Table 1 shows the diagnosis and imaging findings of the lesions. Among the 5 patients with inflammatory lesions, 3 patients had intact fibers (Fig. 1) and 2 patients had displaced fibers (Fig. 2). Among the 3 patients with neoplastic lesions, 1 patient had intact fibers (Fig. 3). There were compact fibers passing the center of the lesion without an eccentrically deviated fiber course or a break in the fiber connection; therefore the lesion was categorized as having intact fibers. A non-visible tract in both lateral portions of the cord in the figure was attributed to low spatial resolution. Between the other 2 patients with neoplastic lesions, 1 patient had displaced fibers and the other patient had interrupted fibers (Fig. 4). In the patient with interrupted fibers, the FA value was above the threshold. Between the discontinued proximal and distal fibers, there was a cystic portion with hemosiderin caps. It seemed that the cystic portion had compressed and damaged the parenchyma, causing distortion of the angle between 2 contiguous eigenvectors. Susceptibility artifacts associated with hemorrhagic caps could be another explanation for interrupted fibers.
The mean FA value was higher in inflammatory conditions, but the difference was not significant (mean: 0.469 ± 0.095, range: 0.359–0.580 in inflammatory conditions; mean: 0.328 ± 0.082, range: 0.234–0.385 in neoplastic conditions; p = 0.519). One case with a neoplastic condition had an FA value < 0.359; in contrast, none of the cases with inflammatory conditions had an FA value < 0.359.
DISCUSSION
DTI is based on the measurement of multiple diffusion weigh-ted images in different gradient directions to resolve the orientation of white matter tracts (8910). FA-a parameter derived from DTI values-reflects the global anisotropy of the analyzed structure. The closer the FA value is to 1, the more anisotropic the structure is (11). If there is an intramedullary lesion or an extramedullary lesion that diminishes this anisotropy, the FA value for the white matter fibers of the cord would decrease accordingly (121314).
FT produces three-dimensional representations of white matter fibers by connecting adjacent voxels based on the similarity in the direction of their principal eigenvectors. Tracking is initiated from a seed voxel and it is terminated when a voxel with an FA value lower than the threshold is reached, or when the angle between the 2 principal eigenvectors is greater than the threshold (4). In a previous study, to avoid excluding regular tracts by using a high FA threshold value, the authors had chosen an FA value of 0.18 for spinal cord FT (15). In the present study, in order to more sensitively detect the tracts, we chose 0.15 as the FA threshold value.
A previous study reported that an FA value of 0.272 could be used as the cut-off point for distinguishing intramedullary neoplasms from neoplasm-like lesions, via receiver operating curve analysis in 25 patients, wherein lower FA values were indicative of the presence of neoplasms. This finding may suggest the occurrence of more severe destruction of the normal structures by neoplasms than by neoplasm-like lesions (16). In the present study, cases with neoplastic conditions tended to have lower FA values as compared to those with inflammatory conditions. Nevertheless, a comparison of the FA values between inflammatory and neoplastic lesions showed some region of overlap. Hence, it may be restrictive to differentiate inflammation from neoplasms based only on the FA values.
Several studies have reported the FT findings of inflammatory and neoplastic intramedullary spinal cord lesions. One study reported no change or change only in color brightness in patients with neuromyelitis optica or multiple sclerosis. In contrast, patients with intramedullary neoplasms had displaced or interrupted fibers (3). Similarly, in one unpublished abstract, cases with demyelinating white matter diseases showed no tract deviation but variable degrees of tract attenuation. In contrast, all cases of cord neoplasms showed variable degrees of tract deviation, with or without fiber interruptions (Abdelgawad M et al., unpublished data). Another study has described a case of multiple sclerosis plaques that showed all the fibers traversing the lesion. Meanwhile, in many cases of ependymomas, displaced fibers were found that did not enter the lesions (17). Additionally, a study was conducted on patients with multiple sclerosis who had intact fiber tracts on FT; in that study, the authors indicated that the fiber tracts may terminate in patients with enhanced acute demyelinating lesions if the FA value falls below the threshold selected for FT. In neoplastic conditions, FT showed displacement of the fibers in ependymomas and interruption of the fibers in astrocytomas (4). Finally, a study that did not specifically focus on intramedullary spinal lesions but sought to differentiate demyelinating diseases in the brainstem from diffuse brainstem gliomas, reported that demyelinating lesions showed a severe decrease in the representation of corticospinal tracts with partial amputation. Meanwhile, gliomas showed only a mild decrease in the representation of tracts, wherein the tracts were bent by the tumors (18).
Thus, in several previous studies, displaced fibers in non-inflammatory neoplastic conditions were noted on FT as one study reported that slow-growing spinal cord lesions caused displacement of the fibers (19). In contrast, cases of inflammatory conditions reportedly show normal appearance or interruption on FT. However, in the present study, displaced fibers in both inflammatory and neoplastic intramedullary spinal lesions were noted on FT; in fact, 40% of the patients with inflammatory lesions had displaced fibers. We believe that these findings may be attributed to edema, associated with acute stage inflammation. One previous study also reported that, in inflammatory diseases of the spinal cord, FT showed spreading of fibers in both normal and abnormal areas on T2-weighted imaging but it showed abnormal FA values. The authors had interpreted that the spreading of fibers may have corresponded to edema (20). However, this hypothesis needs to be explored in further studies.
The present study has certain limitations. First, the number of patients was relatively small because inflammatory and neoplastic intramedullary spinal lesions are not common. Second, there is some potential bias towards FA measurement as voxel-wise measurement was performed by manual placement. To overcome this limitation, we carefully chose the voxels inside the spinal cord without including the CSF outside the spinal cord. Third, considering the enhancement noted and the presence of acute symptoms, all the inflammatory lesions were in the active stage. However, chronic intramedullary inflammatory lesions such as multiple sclerosis plaques were not evaluated. Hence, further studies that also include cases of chronic intramedullary inflammation are needed. Fourth, owing to lack of experience, we did not carry out fiber density mapping, an approach used in the post-processing of DTI data, which shows the density of white matter fibers within the bundle that passes through a voxel and enables quantitative 3D evaluation (21). In this study, the extent of all lesions was more than or equal to 1 segment and there was no difficulty in determining the FT patterns of the lesions. However for smaller lesions, intra- or interobserver variance may exist. In this situation, fiber density mapping could be an alternative approach.
In conclusion, our study showed that inflammatory and neoplastic intramedullary spinal cord lesions are not clearly differentiated by FT; both conditions can present with overlapping features on FT, including displaced fibers. This conclusion differs from the results of many previous studies. Hence, the exclusion of inflammatory conditions based on displaced fibers on FT images should be avoided.
 XML Download