

 PDF
PDF ePub
ePub Citation
 Print
Print


Abstract
Purpose
Materials and Methods
Results
Figures and Tables
Fig. 1
A small pulmonary nodule in the right upper lobe of a 47-year-old woman with history of breast cancer.
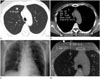
Fig. 2
A solitary pulmonary mass suspicious for malignancy in the right lower lobe of a 72-year-old man, which was well-marginated, irregular-shaped, and abutting the pleura.
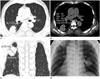
Fig. 3
Box plots of predicting independent variables in conversion of fluoroscopy guided PTNB to cone-beam CT guided PTNB.
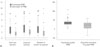
Fig. 4
Receive operating characteristics curve (ROC curve). This graph showed statistically significant independent variables, short-axis diameter and CT attenuation value of the pulmonary lesion. AUC of these variables were 0.753 and 0.722, respectively. We set a cut-off value to 29.50 of CT attenuation that showed 65.8% of sensitivity and specificity, respectively; in addition, we set a cut-off value to 1.65 cm of short-axis diameter that showed 68.4% of sensitivity and 71.1% of specificity.
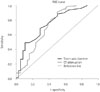
Table 1
Demographics and Image Characteristics between Patients Underwent Fluoroscopy Guided PTNB and Underwent Cone-Beam CT Guided PTNB
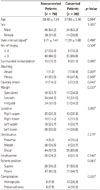
Data in parentheses are percentages.
*Data interval means days between CT exam date and PTNB date.
†p value was calculated with the independent sample t test.
‡p value was calculated with the Pearson χ2 test.
§p value was calculated with the Fisher exact test.
PTNB = percutaneous transthoracic needle biopsy
Table 2
Pathologic Results of the Percutaneous Transthoracic Needle Biopsies
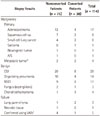
Data in parentheses are percentages.
*Metastatic tumors from breast cancer, colorectal cancer, hepatocellular carcinoma, and diffuse large B cell lymphoma.
†Five cases was confirmed by using the VATs biopsy due to failure of PTNB.
AIS = adenocarcinoma in situ (new name for BAC under the new IASLC), BAC = bronchoalveolar carcinoma, CGI = chronic granulomatous inflammation with/without necrosis, IASLC = International Association for the Study of Lung Cancer, NSCI = nonspecific chronic inflammation, PTNB = percutaneous transthoracic needle biopsy, VATs = video assisted thoracoscopy
 XML Download