

 PDF
PDF Citation
 Print
Print


INTRODUCTION
It is important to objectively measure the population health to provide useful information to decision makers, health-sector leaders, researchers, and informed citizens. In the early 1990's, international public health and medical care organizations including the World Health Organization (WHO), were trying to figure out how to reasonably allocate limited public health and medical care resources. Against this backdrop, voices were raised to find a new methodology to calculate the health level of population groups.12
Around that time, Alan Lopez, WHO, epidemiologist, and Christopher Murray, professor at Harvard School of Public Health, developed the disability-adjusted life years (DALYs) as an indicator to comprehensively measure the health level of a population group. DALYs consists of the sum of the years of life lost (YLLs) due to premature death, which refers to the number of years lost as a person dies earlier than life expectancy, and the years lived with disability (YLDs), which refers to the number of healthy years lost due to morbidity or injuries.3 The basic unit for these summary measures is lost years of healthy life. In other words, 1 DALY means that 1 healthy year is lost due to premature death, disease, or disability, and it means that the higher the DALYs, the wider the gap from the ideal health level.4 The WHO and other organizations started using DALYs as the criteria to reasonably allocate resources. In addition, it offered useful information to decision makers, health-sector leaders, researchers, and informed citizens. The most representative burden of disease study calculated with DALYs is the Global Burden of Disease (GBD) study that is conducted by the Institute for Health Metrics and Evaluation led by professor Christopher Murray. In the GBD study, researchers collect epidemiological data from previously published literature or statistics to derive the DALYs for each disease in many different countries around the world. In doing so, they borrow the epidemiological data of other countries if there are no available data. Therefore, as for the issues have been raised regarding the reliability and validity of the epidemiological data that are put into calculating DALYs in the GBD study, and researchers are making tremendous efforts to enhance the qualitative level of the input parameters required to calculate DALYs.
As Korea has a national health insurance system that covers more than 99% of the total population, it is relatively easier to calculate valid and reliable input parameters (incidence and prevalence etc.) using the claims data. Therefore, efforts have been made since the early 2000s to calculate Korea's burden of disease with our own data sources. In the initial period, most of the Korean burden of disease studies were usually focusing on a single disease such as stroke or mental illness.56 A 2002 study on the burden of disease of Korean people was the first of its kind in Korea and the most recent burden of disease study is based on data from 2012.78 However, because research methodology improved in the period between these two studies, they did not use the same methodology, and the lists of diseases measured were also different from each other. Therefore, it is impossible to make a direct comparison between those studies in terms of changes of burden of disease.
In this regard, this study aims to examine the burden of disease in Korea in 2015, and to study how the burden of disease changes with the passage of time, by examining data from 2007–2015 using the same classification of diseases and the same methodology.
METHODS
Study design and data sources
This study measured the DALYs of Korean people in 2015 by using a methodology that was revised to fit the circumstances of Korea based on the GBD, and we applied the incidence-based approach when performing calculation.9
To calculate incidence and prevalence per year for the period from 2007 to 2015, we used cancer registration data for cancer, hospital discharge injury data for injuries, and the National Health Insurance Service claims data for all the other diseases. In order to prevent the overestimation of incidence and prevalence when using the claims data, for each disease we extracted the number of times hospitalization occurred and the number of visits to outpatient clinics (1–5), based on advice from experts and literature reviews. In particular, to calculate the number of incidence cases, we applied a washout period, defined as from at least 1 year to a maximum of 5 years.
Korea operated a separate disease classification code for oriental medicine, but it was integrated to the general system as part of the sixth revision of the Korean Standard Classification of Diseases in 2011. In consideration of this, for the trends and patterns of burden of disease by year during the 2007–2015 period presented in this study, we derived YLDs by excluding the claims filed by oriental clinics to secure comparability by year, and in the 2015 burden of disease results, the claims filed by oriental clinics were included in calculating YLDs. Therefore, there are some differences in ranks and DALYs.
Disability weight (DW) is a value which shows a quantitative level of disability of a certain health condition or disease. It is indicated on a scale from 0 (perfect health) to 1 (equivalent to death). In DALYs, DW serves as a bridge to connect death with disease and morbidity. In the case of DW, one should be cautious to apply DW as calculated in one country to another country because there can be some differences in sociocultural perspectives of disease. Consequently, this study calculated DALYs by applying a DW that was calculated to be applied in Korea.10
To calculate mortality, we assumed mortality by age, gender, and disease using the 2007–2015 cause of death data from the Statistics Korea, and in doing so, we applied the garbage code-redistribution method for the causes that could not be the cause of death.11
To calculate the number of years lost to premature death, we used the standard expected YLLs. As for the standard life expectancy, the 2007–2015 life table by year, gender, and age offered by the Statistics Korea was used.12
In calculating the YLLs, YLDs, and DALYs per 100,000 population, we used the mid-year population by year, gender, and age data from the Statistics Korea Vital Statistics.13
Computation of YLLs due to premature mortality, YDLs and DALYs
The YLLs for each disease and category of injury was calculated by multiplying the number of deaths by gender and year with the standard life expectancy for each age group.1 YLDs were calculated by multiplying the number of incidence cases, mean duration and DW. Duration of disease and the average age at onset were estimated using the DISMOD-2 program, and particularly for infectious diseases, we directly calculated them using the claims data. In this study, an age-weighting rate of 4% and a time discount of 3% were applied when calculating YLLs and YLDs.8 DALYs for each disease were produced with the sum of YLLs and YLDs.
Disease and injuries cause hierarchies
In this study, causes of mortality and morbidity are structured with use of a four-level classification hierarchy to produce levels that are mutually exclusive and collectively exhaustive.14
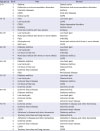
At level 1, all diseases were classified into three categories. They were classified as communicable, maternal, neonatal, and nutrition disease (CMNN), non-communicable diseases (NCDs), and injuries. Diseases are classified into 21 disease groups at level 2, into 165 groups at level 3, and 123 groups at level 4. In this study, we did not make distinction between level 3 and level 4; presenting level 4 as the criteria if there was a level 4 under level 3 in the hierarchy, while level 3 was presented as the criteria if there was no level 4 under level 3. In other words, there was three groups at level 1, 21 groups at level 2, and 260 groups at level 3+4. The cause list is shown in Supplementary Table 1.
Ranking lists
This study ranked diseases based on the DALYs per 100,000 population by gender and age. We ranked a total of 242 diseases by excluding 18 residual categories (e.g., other musculoskeletal disorders, other chronic respiratory diseases, other infectious diseases, etc.) that were not classified into a certain disease category during analysis.8
RESULTS
Burden of disease and injuries in 2015
In Korea, the total number of all-age DALYs in 2015 was 15 million and DALYs per 100,000 population was 29,476 (Table 1). To look into the trend by age, the crude DALYs increased until people were in their 50s and then showed a decreasing trend, and the DALYs per 100,000 population increased until people were in their 70s and slightly decreased at the age of 80 and older. The distribution of DALYs by age was similar both in men and women. Women showed a higher burden of disease overall compared to men (DALYs per 100,000 population for men was 28,887, while that of women was 30,064), but when observed by age group, there were some differences in their patterns. Based on the DALYs per 100,000 population, men and women showed a similar level of DALYs in infancy and early childhood (< 10 years old), but men were at a higher level in adolescence, women were at a higher level in middle age (20s to 40s), and men were again at a higher level at the age of 50 and older (Fig. 1).
Table 1
DALYs per 100,000 population by gender and level 2 disease groups in Korea, 2015
Fig. 1
DALYs per 100,000 population by gender and age group in Korea, 2015.
DALY = disability-adjusted life year, YLLs = years of life lost, YLDs = years lived with disability.
The DALYs for Korean people in 2015 consists of 14% YLL and 86.0% YLD. In the case of men, 18% of DALYs were attributed to YLL, while for women, it was 11%. In other words, it was analyzed that the proportion of YLL in the gender-specific DALYs was slightly larger for men than for women. To look into each age group, the proportion of YLL showed an increasing trend as the age increased. In the 0–9 age group, it was high at 14%, but it decreased to 6% in the 10–19 age group and then consistently increased, reaching 41% in the 80+ age group. As for women, it was observed that the proportion of YLL was slightly lower compared to men in all age groups (Fig. 1).
From the analysis results of each higher-level (level 1) disease group, CMNN made up 2.8% of the total DALYs, while NCD and injuries made up 87.1% and 10.1%, respectively. Overall, YLD made up a larger proportion than YLL, and in the case of NCD, 89% of the total DALYs were due to YLD, while for CMNN it was 79% and for injuries was 66%. For women, CMNN and NCD showed higher DALYs per 100,000 population compared to men, whereas injuries showed a higher figure for men than for women (Table 1).
From the analysis results of each middle-level (level 2) disease group, the DALYs per 100,000 population for musculoskeletal disorders was 4,496. This ranked the highest as it made up 15.3% of the total DALYs in Korea. It was followed by the DALYs per 100,000 population for diabetes, urogenital, blood, and endocrine diseases at 4,118 (14.0%), other NCD at 3,548 (12.0%), cardiovascular and circulatory diseases at 3,475 (11.8%), and neoplasms at 2,479 (8.4%). In the case of men, the DALYs per 100,000 population for diabetes, urogenital, blood, and endocrine diseases was 4,348, ranked the highest as it made up 15.1% of the total DALYs of men. For women, the DALYs per 100,000 population due to musculoskeletal disorders was the highest at 5,633 (18.7% of the women's total DALYs) (Table 1).
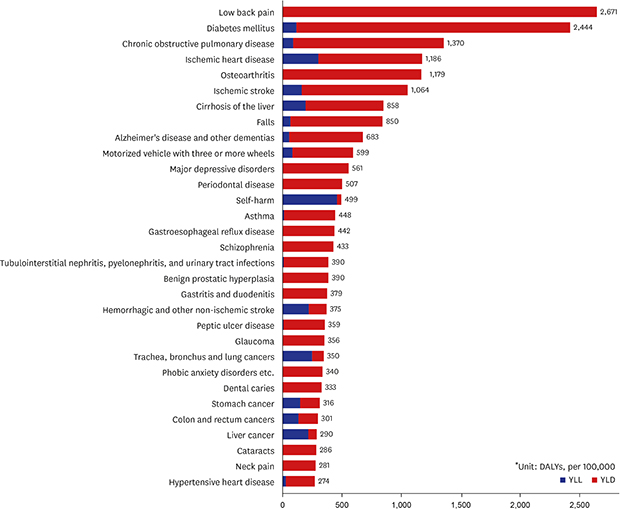
From the analysis results of each lower-level (levels 3 and 4) disease group, the DALYs per 100,000 population for low back pain was the highest at 2,671 (9.1%), followed by diabetes mellitus at 2,444 (8.3%), chronic obstructive pulmonary disease (COPD) at 1,370 (4.6%), ischemic heart disease at 1,186 (4.0%), and osteoarthritis at 1,179 (4.0%). The DALYs of the top three diseases made up 22% of the total Korean burden of disease in 2015, with the top 10 diseases comprising 43.8% (Fig. 2). For men, the DALYs per 100,000 population for diabetes mellitus was the highest at 2,841 (9.8%), followed by low back pain at 2,140 (7.4%), and ischemic heart disease at 1,481 (5.1%). For women, the DALYs per 100,000 population for low back pain was the highest at 3,202 (10.7%), followed by diabetes mellitus at 2,048 (6.8%), and osteoarthritis at 1,763 (5.9%). Among the burden of disease for men, the top three diseases made up 22.4% out of the total burden of disease of men, while among the burden of disease of women, the top three diseases made up 22.3% out of the total burden of disease of women (Table 2).
Fig. 2
Top 30 leading specific causes (level 3 and 4) of DALYs in Korea, 2015.
DALY = disability-adjusted life year, YLLs = years of life lost, YLDs = years lived with disability.

Table 2
DALYs per 100,000 population by gender and level 3 and 4 disease groups in Korea, 2015
Regarding age group, in the 0–9 age group, the burden from refraction and accommodation disorders was ranked highest at 13.6%, followed by asthma at 13.1%, and dental caries at 12.3%. The DALYs of those top three diseases comprise 38.9% of the total DALYs of the 0–9 age group. In the 10–49 age group, low back pain showed the highest burden of disease, while diabetes mellitus was ranked highest in the 50–69 age group and Alzheimer's disease and other dementias in the age group of 70 and older (Table 3). In particular, in the case of women in the pregnancy and childbirth stage (between the ages of 20 and 39), the burden of specific diseases such as abortion and women infertility was high, and for the men aged 20–39, it was characteristic that the burden of injury-related diseases including falls and injuries from motorized vehicles with three or more wheels was high (Table 4).
Table 3
Top 5 leading specific causes (level 3 and 4) of DALYs by age group in Korea, 2015
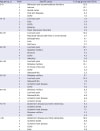
Table 4
Top 5 leading specific causes (level 3 and 4) of DALYs by gender and age group in Korea, 2015
It was analyzed that communicable diseases accounted for 0.9% of the total DALYs in Korea in 2015. The burden of disease for men was approximately 42% higher than that for women, with YLLs making up 45% and YLDs making up 55% (Table 1). Among communicable diseases, the DALYs per 100,000 population for tuberculosis was the highest at 98.5, followed by acute bronchitis etc., and HIV resulting in other specified or unspecified diseases (Fig. 3A).
Fig. 3
Top 10 leading specific causes (level 3 and 4) of DALYs by disease group in Korea. (A) Communicable diseases, (B) Neoplasms, (C) Mental and behavioral diseases, (D) Injuries.
DALY = disability-adjusted life year, YLLs = years of life lost, YLDs = years lived with disability.
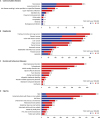
Neoplasms accounted for 8.4% of total DALYs in Korea in 2015. Men had a 21% higher burden of disease compared to women. In neoplasms, YLLs makes up 53% and YLDs makes up 47%, and it comprises 31.8% of the total YLLs and 4.6% of the total YLDs in Korea. In particular, in terms of the level 2 disease classification, neoplasms showed the highest YLLs (Table 1). Among neoplasms, the DALYs per 100,000 population for trachea, bronchus, and lung cancers was the highest at 350, followed by stomach cancer, colon and rectum cancers, liver cancer, and breast cancer in rank order (Fig. 3B). For men, trachea, bronchus, and lung cancers showed the highest burden, while the burden of breast cancer was the highest for women.
It was revealed that mental and behavioral disorders occupied 6.3% of the total DALYs in 2015. In mental and behavioral disorders, YLLs makes up 2% and YLDs makes up 98%, and they comprise 0.7% out of the total YLLs and 7.2% out of the total YLDs in Korea (Table 1). Among mental and behavioral disorders, the DALYs per 100,000 population for major depressive disorders was ranked highest at 561, followed by schizophrenia, phobic anxiety disorders etc., bipolar affective disorder, and panic disorder (Fig. 3C).
Injuries occupied 10.1% of the total DALYs in 2015. Injuries accounted for 34% of YLLs and 66% of YLDs, and 25% of the total YLLs and 8% of the total YLDs in Korea (Table 1). The DALYs per 100,000 population for falls was the highest at 850, followed by injuries from motorized vehicles with three or more wheels, and self-harm (Fig. 3D).
In terms of the YLDs per 100,000 population, the YLDs per 100,000 population for low back pain was the highest at 2,671, followed by diabetes mellitus at 2,326, COPD at 1,280, osteoarthritis at 1,179, and ischemic stroke at 901. As for the YLLs per 100,000 population, the YLLs per 100,000 population due to self-harm was the highest at 464; followed by ischemic heart disease at 304; trachea, bronchus, and lung cancers at 252; hemorrhagic and other non-ischemic strokes at 223; and liver cancer at 218. Among the top 30 diseases with the highest DALYs per 100,000 population, the YLLs due to self-harm made up the largest proportion at 93%; followed by liver cancer at 75%; trachea, bronchus and lung cancers at 72%; and hemorrhagic and other non-ischemic strokes at 60%. Regarding other diseases, the ratio of YLDs was higher than that of YLLs (Fig. 2).
Trends and patterns of burden of disease and injuries, 2007–2015
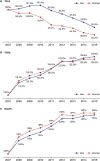
We looked into the trends of the YLLs per 100,000 population in Korea for the period of 2007 to 2015, and it was observed that it stayed at a certain level from 2007 to 2010 and then it showed a consistently decreasing trend from 2011. The YLLs per 100,000 population in 2015 decreased by approximately 6.5% compared to 2007. The YLLs per 100,000 population decreased both for men and women. In the case of men, the YLLs per 100,000 population decreased by 5.5% in 2015 compared to 2007, while it decreased by 7.8% in the case of women. Among the top 30 diseases with the highest YLLs per 100,000 population in 2015, injuries from motorized vehicles with three or more wheels decreased by 33.9%, showing the largest decrease, while pedestrian injuries caused by road vehicles fell by 30.2% and ischemic stroke by 28.8%. In contrast, Parkinson's disease increased by 129.3%, recording the largest increase, over-exertion and strenuous movements rose by 50.8% and pancreatic cancer by 34.0% (Fig. 4A).
Fig. 4
Top 20 leading specific causes (level 3 and 4) of YLLs due to premature mortality, YLDs, and DALYs for 2007, 2010, and 2015, with percentage change in DALYs (per 100,000). (A) YLLs due to premature mortality, (B) YLDs, (C) DALYs.
YLLs = years of life lost, YLDs = years lived with disability, DALY = disability-adjusted life year.
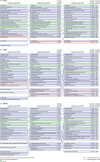
We observed the trend of YLDs per 100,000 population in Korea for the period from 2007 to 2015, and it showed a consistently increasing trend from 2007 to 2015. The YLDs per 100,000 population increased by approximately 36.7% in 2015 compared to 2007. By gender, the YLDs per 100,000 population rose both for men and women. In the case of men, the YLDs per 100,000 population in 2015 increased by 37.9% compared to 2007, while it rose by 35.5% in the case of women. Among the top 30 diseases with the highest YLDs per 100,000 population in 2015, asthma fell by 42.6%, showing the largest decrease, peptic ulcer disease decreased by 33.1%, and injuries caused by motorized vehicles with three or more wheels by 8.8%. For all the other diseases, the YLDs per 100,000 population increased in 2015 compared to 2007. Alzheimer's disease and other dementias showed the largest increase at 339.9%, periodontal disease rose by 210.7%, and benign prostatic hyperplasia by 138.8% (Fig. 4B).
From the analysis results of the changes in the Korean burden of disease for the period from 2007 to 2015, it was observed that both the crude DALYs and the DALYs per 100,000 population showed a consistently increasing trend from 2007 to 2015. Korea's population in 2015 had increased by approximately 3.7% compared to 2007, and for the same period, the crude DALYs increased by 32.8% and the DALYs per 100,000 population by 28.1%. By gender, the DALYs per 100,000 population as of 2015 rose by 27.4% for men and 28.8% for women compared to 2007, and they showed similar yearly trends (Fig. 5). Among the top 20 diseases in 2015, it was Alzheimer's disease and other dementias, which showed the largest increase as its DALYs per 100,000 population, increased by 283.8% compared to 2007. In the case of diabetes mellitus, which ranked high in 2015 in terms of burden of disease, the DALYs per 100,000 population in 2015 rose by 42.3% compared to 2007, while low back pain increased by 88.5%, COPD by 53.7%, and ischemic heart disease by 40.8%.
Fig. 5
Change of YLLs due to premature mortality, YLDs, and DALYs per 100,000 by years in Korea. (A) YLLs due to premature mortality, (B) YLDs, (C) DALYs.
YLLs = years of life lost, YLDs = years lived with disability, DALY = disability-adjusted life year.
Among the top 20 diseases in terms of the DALYs per 100,000 population as of 2015, the DALYs per 100,000 population for asthma in 2015 fell by 42.7% compared to 2007, while injuries from motorized vehicles with three or more wheels decreased by 13.4% and hemorrhagic and other non-ischemic strokes by 0.3%. All the other top 17 diseases with the highest DALYs per 100,000 population as of 2015 also showed an increasing trend. The DALY's per 100,000 population for Alzheimer's disease and other dementias showed the largest increase at 283.8% compared to 2007, while periodontal disease rose by 210.7%, benign prostatic hyperplasia by 138.8%, glaucoma by 124.5%, and gastroesophageal reflux disease by 116.4%. Liver cancer and dental caries were ranked within the top 20 in terms of the DALYs per 100,000 population in 2007, but they were excluded from the top 20 as their ranks fell (Fig. 4C).
DISCUSSION
Korea has one of the fastest aging populations in the world. According to the Organisation for Economic Co-operation and Development (OECD) health data published in 2018 and in 2000, we became an aging society where the elderly population aged 65 or more comprises 7% of the total population, and in a mere 18 years, as of 2018, we have become an aged society, with the elderly population over 14%. It is expected that by 2026, Korea will become a super-aged society where the elderly population will make up as much as 20.8% of the total population.15 In Korea, life expectancy has increased by 6.1 years, from 76.0 in 2000 to 82.1 in 2015, but disability adjusted life expectancy increased by only 4.6 years, from 68.1 in 2000 to 72.7 in 2015.1216 In other words, the proportion of the population who are elderly has increased, and the period of living with disease or disability before death has been prolonged. These trends seem to have contributed to the drastic increase in YLDs.
This increase in YLDs can also be attributable to the increase in the demand and use of medical services as insurance coverage for diseases has been improved. As we have consistently expanded coverage, access to medical services has been improved. Actually, the coverage of the National Health Insurance of Korea slightly decreased from 63.6% in 2010 to 62.6% in 2016. In the case of hospitalization, however, it rose from 61.7% to 66.1%, and the coverage for serious diseases also shows an increasing trend. Moreover, the number of visits to medical institutions per person steadily increased from 11.63 days in 2000 to 16.58 days in 2007 and 19.61 days in 2015.17 As 62% of Korean people have medical insurance for actual expenses as of 2016, resistance against medical expenses has fallen, leading to an increase in the use of medical services.18 In other words, enhanced access to medical services and lower resistance against medical expenses led to the increase in the use of medical services, and as a result, incidence and prevalence rose. It seems to be for this reason that YLDs, which are calculated based on such indicators, have increased.
On the other hand, it was observed that YLLs gradually decreased. Improvements in medical technology and increased life expectancy seem to have reduced the burden caused by premature death. In particular, the decrease in deaths from injuries made a significant contribution. Injuries caused by motorized vehicles with three or more wheels fell by 33.9% since 2007, while injuries caused to pedestrians by road vehicles decreased by 30.2%. In the case of self-harm, which comprises the largest portion of YLLs, it rose until 2011 and showed a decreasing trend afterward. In 2015, the YLLs for self-harm fell by 20% compared to the figures from 2011. Rates of self-harm in Korea are the highest among OECD member countries. A variety of policies have been established to prevent deaths from self-harm. Among them, the government-wide “comprehensive countermeasure for the prevention of suicide” was established in 2007, and the “Act on the Prevention of Suicide” was enacted. However, further research is needed regarding whether the burden of disease caused by self-harm actually decreased or not. This is because while the rates of self-harm caused mortality decreased, the number of suicide attempts, as collected through the National Emergency Department Information System, is still on the rise.19 In the YLDs for self-harm calculated in this study, we only included the cases where people were admitted to hospitals or higher-level medical institutions after making a suicide attempt. Those who used outpatient clinics or visited clinic-level medical institutions were excluded. Such criteria were applied not only to self-harm but also to injuries. Therefore, there are chances that the YLDs of injuries was underestimated. In this regard, it is necessary to calculate the burden of injuries more accurately by reinforcing data sources.
Among the burden of disease in Korea in 2015, low back pain made up the largest share, and it rose by 88.5% compared to 2007. The burden of disease due to low back pain shows an increasing trend also at the global level. In addition, the increasing trend is explicitly observed in high-income countries, particularly high-income Asia-Pacific countries.20 In Korea, it was calculated that the burden of disease due to low back pain was higher for women than for men. The burden of disease was particularly high among women in their 30s to 50s and it seems to be caused by environmental characteristics including child-rearing and household chores for which women have the main responsibility, as well as physiological changes such as pregnancy, childbirth, menopause, and aging.
From the trend analysis results of burden of disease for the 2007–2015 period, Alzheimer's disease and other dementias displayed the largest increase. Compared to 2007, the burden of disease in 2015 had increased by 283.8%. It seems that such a huge increase was caused by the increasing number of incidence cases of Alzheimer's disease and other dementias due to the rapid aging of the population and the downward trend of the age at which patients are diagnosed with those diseases. As it costs more and more to treat and care for patients with geriatric diseases including Alzheimer's disease and other dementias, and related social expenses rise, the Korean government introduced the long-term care insurance system for the elderly in 2008.21 In order to benefit from the long-term care insurance for the elderly, patients were screened for early stage Alzheimer's disease and other dementias and so the disease burden was rapidly increased. Alzheimer's disease and other dementias show a rapid growth in disease burden, but there is a lack of evidence to support effective interventions to reduce them. Therefore, effective prevention strategies for Alzheimer's disease and other dementias should be established and pursued as targets of public health policy and health promotion projects.
According to the results of the GBD study, GBD in 2015 was 34,446 per 100,000 population, and at the same time, it was 23,361 DALYs per 100,000 population in Korea.22 The current study however, calculated that the DALYs in Korea in 2015 was 29,476 (per 100,000), and such a gap was caused by the differences in the collecting method of the input parameters, DW, and methodology used in calculating DALYs. In the 2010 GBD study, the methodology used to calculate DALYs was changed from the incidence-based approach to the prevalence-based approach. Therefore, it is not appropriate to directly compare the DALYs calculated in the GBD study and the DALYs calculated in this study.23 This study calculated DALYs by applying the incidence-based approach, while the GBD study applied the prevalence-based approach. The incidence-based approach is a method of estimating the loss of health caused by death and disability occurring after the onset of disease and the prevalence-based approach is a method of calculating the loss of health of patients in a given year. The advantage of the incidence-based approach is that it is possible to figure out how much loss of health would arise if a disease or injury occurs, but it is hard to consider the people currently living with the disease. That is, it has limitations in calculating the current burden of disease if the disease has a high prevalence but its incidence is on the decrease. In contrast, with the prevalence-based approach, it is hard to predict how much burden of disease would arise if a disease occurs, but it has the advantage that it is appropriate to calculate the current burden of disease caused by a certain disease.23 It is hard to say which approach is superior, but it seems that calculating DALYs under the prevalence-based approach was developed as a method to overcome the limitations of collecting input parameters that should be collected in every country to calculate the GBD. On the other hand, as more than 97% of the total population in Korea have health insurance or are entitled to medical care assistance, we can see most of the medical service usage data through the National Health Insurance claims data, and it is also easier to calculate incidence of a disease as it is possible to structure the cohort format data with the personal identification code.24 For this reason, this study applied the incidence-based approach to calculate DALYs.
Another methodological difference related from a perspectives regarding defining and observing diseases. From the 2015 Korean burden of disease rankings presented in the GBD study, migraine was ranked seventh out of all diseases but was not even included among the top 30 diseases in this study. Generally, migraine is not considered a disease that requires treatment, but it is usually recognized as a symptom that occurs due to stress or lack of sleep. As we intended to set the prevalence criteria of migraine by considering it as a disease in this study, we defined the people with disease as those who visited the outpatient clinic for three times or more for one year with migraine as main diagnosis (International Classification of Diseases, 10th Revision; code, G43). Under such definition, migraine was classified as a disease with low prevalence in this study. In the GBD study, however, epidemiological indicators that were derived through self-administered survey were used.252627 For this reason, migraine was observed as having high prevalence, and therefore, DALYs calculated by using it was very high.24 As a result, the GBD study results have connotations that the DALYs of the diseases for which self-medication is possible without using medical services, such as headache and gastrointestinal disorder, can be overestimated, while it can be underestimated in the results of this study.
Despite its limitations, the GBD study is the most reliable study to figure out the level of Korea's burden of disease compared to other countries. In the GBD study, Korea's burden of disease in 2015 was 12% lower than the average burden of disease of high-income countries, and it was also 11% lower than the average burden of disease of the OECD member countries and 8% lower than the average burden of disease of high-income Asia-Pacific countries.20
This study has several limitations. First, it did not calculate the burden of disease of new types of communicable disease such as Middle East respiratory syndrome, which spread widely across the globe in 2015. Therefore, it is needed to calculate the burden of disease by including diseases that realistically reflect the circumstances of Korea. Another limitation is the methodological limitation related to the calculation of the duration of each disease. This study used DISMOD-2 for diseases and injuries other than communicable diseases.28 However, the estimated duration of chronic disease with long duration, such as diabetes mellitus, calculated shorter than generally known. Duration of disease can vary depending on the public health care environment and the level of development of each nation, but DISMOD-2 does not properly reflect such variations. Therefore, in order to reflect the circumstances of Korea, further research needs to be conducted in the future regarding the methodology needed to derive the duration of diseases. In addition, this study failed to consider the issue of underestimation arising out of excluding the unmet demands for medical services among those who do not use medical services as it only used the data of medical service users. In Korea, however, it is assumed that the size of burden of disease arising out of the failure to consider the unmet demands for medical services is not that large because almost every person is covered by the National Health Insurance. Nonetheless, more consideration needs to be given to the issue of how to reflect the not-used medical services and the unmet demands for medical services in calculating the burden of disease.
However, this study has its significance in the sense that it calculated the burden of disease based on a single criterion (the use of medical services) and it also calculated the burden of disease based on empirical data generated in Korea. Moreover, it is the first study that calculated various epidemiological data from individual-level data resources.
This study examined the size of burden of disease by gender and age group, but further research is needed to reveal the differences in the size of the burden of disease at various levels, such as regional or income levels. How the burden of disease would change depending on factors undermining health including smoking, drinking, and obesity also needs to be studied.
 XML Download