

 PDF
PDF Citation
 Print
Print


INTRODUCTION
Preterm delivery is a leading cause of neonatal morbidity and mortality and accounts for about 10% of all births worldwide.1 Despite low birth rate, the rate of preterm birth in Korea has steadily been increasing up to 7.3% and about 30,000 neonates were delivered at less than 37 weeks of gestation in 2016.2 Although previous preterm birth history increases recurrent preterm birth,3 about 90% of pregnant women experience preterm birth without any history of preterm birth. Therefore, proper prediction of preterm birth is of utmost important.
Ever since a study reported an association between short cervical length (CL) and subsequent preterm birth,4 CL measurement during pregnancy has been one of the most frequently performed ultrasound procedures in prediction of spontaneous preterm birth, both in low and high-risk pregnancies.56 However, the actual rate of preterm birth varies depending on the risk status of the pregnancy with short CL. For instance, in primiparas with a short CL (≤ 2.5 cm) without prior preterm delivery (low-risk), the actual preterm birth ranges only from 14% to 16.2%.78 On the other hand, a short CL in high risk pregnancy is associated with substantially increased risk of preterm delivery, ranging from 44% to 55%.910 Despite such increase, it is clear that the rate of preterm birth is not perfectly predicted by CL measurement, given that preterm birth actually occurred in less than half of the patients in both groups. A Korean cohort study including 3,296 consecutive women with a singleton pregnancy who underwent routine CL measurement between 20 and 24 weeks also proved that the actual preterm birth rate (< 34 weeks) was only 26% among women with short CL (≤ 2.5 cm).11
Ultrasound elastography which assesses the biochemical and mechanical properties of a tissue has emerged as a promising ancillary tool to conventional ultrasound. There are two types of elastography used in clinical practice: strain and shear wave elastography. Strain elastography is based on the measurement of tissue displacement under compression, either extrinsic or intrinsic. It is based on the principle that soft parts of the tissue deform more than harder parts under compression.12 In contrast, shear wave elastography involves displacing tissue with a high-frequency ultrasound pulse generated by ultrasound scanner and subsequent monitoring of the propagation of shear wave, which is orthogonal to the direction of tissue displacement.13 The property of shear wave—that it moves faster in stiffer and slower in softer tissue—enables us to quantify tissue stiffness or softness.
Since elastography is considered to measure the mechanical properties of the cervix, several researchers actively studied cervical elastography during pregnancy in relation to preterm birth and labor induction, either by using strain or shear wave elastography.1415161718192021222324252627 However, most studies include all women with various CLs without limiting it to a certain range, which may not fully test the utility of elastographic parameters specifically within the high-risk patients with short CL.
Given such background, we designed a multicenter prospective study in which cervical elastography was performed in women with short CL (≤ 2.5 cm). The objective of this study was to investigate; 1) whether there is a difference in elastographic parameters between pregnancies with and without spontaneous preterm delivery (sPTD) and 2) the ability of elastographic parameters to predict sPTD in pregnancies with a short cervix (≤ 25 mm).
METHODS
Subjects
Pregnant women with CL ≤ 25 mm between 16 and 32 weeks of gestation were enrolled from nine institutions between July 2015 and May 2017. The sPTD was defined as a birth before 37 completed weeks of gestation, due either to preterm labor or to preterm premature rupture of membranes. Cervical elastography was performed simultaneously with CL measurement, which was performed upon each clinician’s judgement. Multiple pregnancies, placenta previa, abruptio placentae, and pregnancies using tocolytics or with cerclage before CL measurements were excluded from the study. Pregnancy outcomes as well as demographic and obstetric parameters were collected.
CL and elastographic measurements
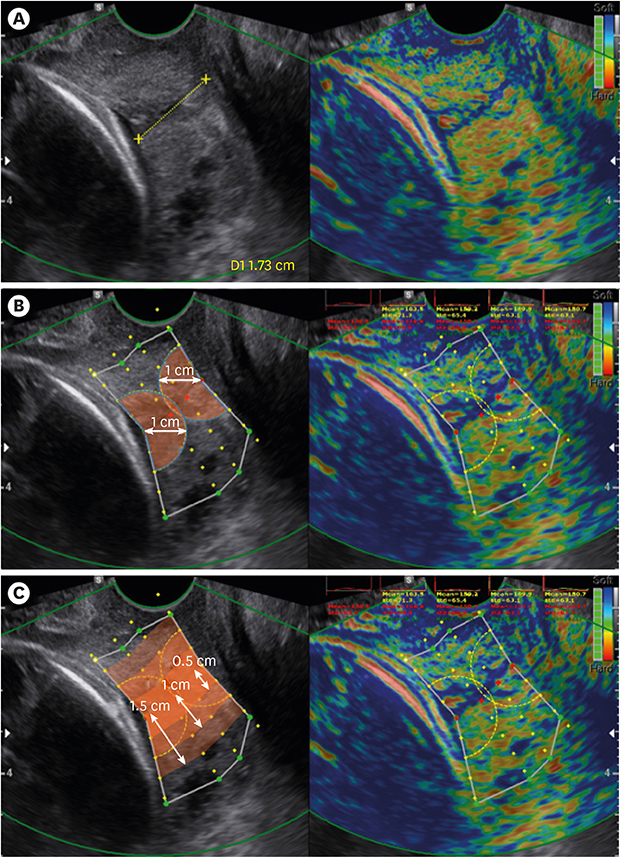
CL was measured with vaginal ultrasound (WS80A Ultrasound System; Samsung Medison, Seoul, Korea), which uses 6-MHz transvaginal probe with a standard CL measurement protocol previously described (Fig. 1A).28 After measuring the CL, elastography was performed three times in the same plane with the same transvaginal probe using the E-CervixTM system (Samsung Medison), a quantification tool to measure the stiffness of the cervix using elastography. While collecting the data, patients are allowed to breathe normally and the operator does not apply pressure to the cervix, a technique used in the study of Swiatkowska-Freund and Preis.23 We avoided measurements when fetuses were moving, especially when they were in non-cephalic presentation for consistent results. Participating examiners were instructed to follow the standardized measuring methods before the start of the study. The E-Cervix system uses minute internal organ movements from compression sources including vessel pulsation and respiratory movement.
Fig. 1
Measurements and ROI definitions in elastography images. (A) CL measurement using 6-MHz transvaginal probe in B-mode ultrasonography. Measurement areas of E-Cervix. (B) Strain values of the IOS and EOS are measured using a 1-cm radius from IOS, and EOS, respectively. (C) Values of strain mean, hardness ratio, and ECI are measured from within 0.5/1.0/1.5 cm area of the cervical canal. The patient agreed to publication of the elastography image of the uterine cervix.
ROI = regions of interest, CL = cervical length, IOS = internal os of cervix, EOS = external os of cervix, ECI = elasticity contrast index.
The technical process of collecting data is depicted in Fig. 2A, which essentially tracks 2-dimensional tissue deformation. Specifically, the stiffness of the cervical tissue is estimated using strain variation through multiple frames, only when the probe is steady. The steadiness of the probe is controlled by motion bars in the monitor screen, precluding any gross movement such as active fetal activity from disturbing the steadiness. Only when the probe movements are within the pre-determined range, all motion bars turn green and strain values are acquired, which accordingly produces an elastography image. In this process, E-Cervix performs 2-dimensional speckle tracking on a sliding buffer of acquired image frames normally covering at least several seconds. The strain calculated from multi-frame images is visually converted to the stiffness of each point in the cervix (Fig. 2B). After collecting acquisition from adequate frames of strain elastography images, the strain values were displayed in spectrum of colors from blue (soft) to red (hard) in the monitor along with the 2-dimensional ultrasound image. The operator defines region of interest (ROI) using pre-defined selection tool built in ultrasound machine (Fig. 1B and C). First, operator lines cervical canal by selecting 2- or 4- points between internal and external os of cervix. When cervical canal is defined, the green points are automatically marked from the selected cervical canal. After the operator adjusts green points to define entire cervical area, each yellow point is displayed at every 0.5 cm from cervical canal and used when the parameters such as strain mean level, elasticity contrast index (ECI), and hardness ratio within 0.5/1.0/1.5 cm from the cervical canal are calculated. When there was a funneling in the cervix, the operator adjusted ROI to include as much cervix as possible while trying to avoid fetus or amniotic fluid near the cervix using funnel shaped ROI.
Fig. 2
E-Cervix elastography image generation processes. (A) Flow diagram of E-Cervix elastography measurements. (B) E-Cervix elastography image generation by multiple frames.
From those elastography images, multiple parameters are generated by E-Cervix (Table 1). Detailed qualitative definitions of each parameter are as follows. Strain mean levels are average strain values in the ROI, which are standardized in a range between 0 (hard) and 1 (soft). ECI, an average contrast index of the pixels within the ROI, represents how heterogeneous or homogeneous the object is within the ROI box. All the pixels in the ROI are graded on a ten-point scale between 0 and 9. The difference of the points between neighboring pixels is converted to a number ranging between 0 and 81, which are ECI value of individual pixel. The overall ECI is the average of the individual pixel contrast index. Hardness ratio is the percent of upper 30 percent of red (hard) pixel area divided by total pixel area within the ROI and represents how much area is occupied by hard pixels in the ROI. Only the strain means of the internal and external os and their ratio were presented on the screen of the elastography during the exam, and thus other elastographic parameters were blinded to all clinicians until delivery.
Table 1
Selected E-Cervix parameters

Statistical analysis
Maternal baseline and obstetric parameters and outcomes were compared between patients with and without sPTD using χ2 test, Fisher's exact test, and Mann-Whitney U test. Frequencies, medians, and interquartile ranges (IQRs) were calculated and compared between groups. To evaluate the ability of a parameter or combinations of parameters to predict sPTD, the areas under the receiver operating characteristic curve (AUC) were calculated and compared. Logistic regression analysis was used to calculate and compare AUC when multiple parameters were put in the prediction model. We used c-statistics of the logistic regression model. The c-statistic, or concordance statistic is a measure of the discriminatory power of a predictive model, and is equivalent to AUC.29 A P value less than 0.05 was considered significant. STATA 14.0 (StataCorp, College Station, TX, USA) was used in statistical analyses.
Ethics statement
The study protocol was reviewed and approved by the Institutional Review Board (IRB) in each participating hospital (IRB No. Asan Medical Center 2015-0800, Cheil General Hospital CGH-IRB-2015-6, Dongguk University Ilsan Hospital 2015-42, Seoul St. Mary's Hospital KC15OIMI0289, Kyung Hee University Hospital at Gangdong 2015-05-006, Konkuk University Medical Center 1040044, Korea University Guro Hospital 2015GR0300, Samsung Medical Center 2015-04-014-002, and Seoul National University Bundang Hospital B-1505/297-002) and written informed consents were collected from all subjects. The patient agreed to publication of the elastography image of the uterine cervix.
RESULTS
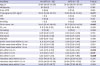
A total of 130 subjects were included in the analysis. Median gestational age (GA) at examination was 24.4 weeks IQR, 21.4–28.9), and the prevalence of sPTD was 20.0% (26/130). Table 2 lists the maternal and sonographic characteristics of these subjects, which incorporates the selected E-Cervix parameters previously described in Table 1. Among all the characteristics, pre-pregnancy body mass index (BMI) and funneling were significantly different between those with and without sPTD (P < 0.05). On the other hand, the ECI scores within 1.0 and 1.5 cm from the cervical canal, one of the E-Cervix parameters, were marginally different (P values of 0.067 and 0.056, respectively). All other maternal or sonographic characteristics including CL were not different between women with and without sPTD. The clinical courses after CL examination are presented in Table 3. According to the data, exam to delivery interval, GA at delivery, birth weight, and neonatal intensive care unit (NICU) admission were different between two groups (P < 0.001). The frequency of progesterone treatment was also significantly different between two groups.
Table 2
Maternal baseline characteristics and sonographic findings
Data are presented as the median (interquartile range) or number (%).
P values less than 0.05 are shown in bold.
sPTD = spontaneous preterm delivery, BMI = body mass index, DM = diabetes mellitus, HTN = hypertension, GA = gestational age, CL = cervical length, IOS = internal os of cervix, EOS = external os of cervix, ECI = elasticity contrast index.
Table 3
Clinical course after CL examination including elastography and delivery outcome

Next, we divided our original subjects into two groups: patients with CL < 1.5 cm, and those with CL ≥ 1.5 cm. This division was to investigate whether there is any difference in elastographic parameters in relation to CL—whether the patient's cervix is moderately short or severely short. In patients with CL < 1.5 cm, there was no difference between patients with and without sPTD in terms of E-Cervix parameters (data not shown). However, when subjects were limited to CL ≥ 1.5 cm, patients with sPTD showed significantly higher ECI scores within 0.5/1.0/1.5 cm from the cervical canal, compared to those without sPTD (Table 4).
Table 4
Comparison of E-Cervix parameters in subjects with CL ≥ 1.5 cm
Data are presented as the median (interquartile range) or number (%).
P values less than 0.05 are shown in bold.
sPTD = spontaneous preterm delivery, BMI = body mass index, DM = diabetes mellitus, HTN = hypertension, GA = gestational age, CL = cervical length, IOS = internal os of cervix, EOS = external os of cervix, ECI = elasticity contrast index.
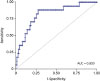
In subjects with CL ≥ 1.5 cm, we calculated the AUC of different models in predicting sPTD. These models included CL, GA at CL exam, pre-pregnancy BMI, and ECI score within 0.5/1.0/1.5 cm from the cervical canal, both individually and in combination. Then, we compared all the AUCs with that of CL alone (Table 5). According to the results, none of the individual parameters showed better AUCs than CL alone. However, combination of CL, GA at CL exam, and pre-pregnancy BMI showed better AUC than CL alone (P < 0.05), and an addition of ECI score within 0.5/1.0/1.5 cm from the cervical canal significantly increased the predicting ability of the models up to an AUC of 0.8256 (Fig. 3).
Table 5
Comparison of AUCs between CL and other models for the prediction of sPTD (< 37 weeks) in subjects with CL ≥ 1.5 cm (n = 110)

P values less than 0.05 are shown in bold.
AUC = area under receiver operating characteristic curve, CL = cervical length, ECI = elasticity contrast index, GA at CL = gestational age at cervical length measurement, preBMI = pre-pregnancy body mass index.
aComparison between CL alone and other models.
Fig. 3
Receiver operating characteristic curve using the predicted probability calculated from the logistic regression model using CL, pre-pregnancy BMI, GA at CL measurement, and parameters of ECI within 1.5 cm from the cervical canal.
AUC = area under receiver operating characteristic curve, BMI = body mass index, CL = cervical length, GA at CL = gestational age at cervical length measurement, ECI = elasticity contrast index.
DISCUSSION
Strain elastography can be done either by manual compression applied to the target tissue (external compression) or by internally generated fine vibration by organ motion such as adjacent arterial pulsation and breathing (internal or in vivo compression).30 Strain values from external compression can be more operator-dependent than those from intrinsic compression.12 We used in vivo compression method with a software named E-CervixTM which acquires data for three seconds and collects strain data from 51 frames of images. We previously demonstrated that the reproducibility of these elastographic parameters is in moderate to substantial agreement in terms of intra- and inter-observer variance including 90 singleton pregnant women between 16 weeks and 32 weeks.31 Shear wave elastography, which uses focused ultrasound beam displacing the target tissue and measures shear wave speed radiating outward, have advantages of being less operator dependent32 and more frequently applied to the elastography imaging of liver in clinical practice.33 However, since shear wave estimation is based on the assumption of tissue homogeneity within the target ROI,13 it was noted that anisotropic, heterogeneous and relatively small organ with microstructural complexity imposes the cervix tissue less suitable for shear wave elastography than larger isotropic organs such as liver.32 Intra- and inter reproducibility was presented from small number of pregnant patients (n = 8) in shear wave measurements of cervix in which the Aixplorer ultrasound system (SuperSonic Imagine, Aix-en-Provence, France) was applied.19 At current stage, the clinical application to cervix either by strain elastography (manual or internal compression) or by shear wave elastography needs to provide reproducibility data and requires further validation with larger study population.
Our study demonstrated that there was no difference between pregnancies with and without sPTD in terms of both the elastographic parameters and CL. However, after analyzing the subgroup of women whose CL were between 1.5 and 2.5 cm, there was a significant difference in ECI scores within 0.5/1.0/1.5 cm from the cervical canal. Our data also suggested that a combination of multiple parameters including both the E-cervix parameters and CL may help predict sPTD in women with a moderately short CL.
As a response to the limitation of CL measurement in predicting preterm delivery, cervical elastography has recently been recognized as an important research agenda, possibly as a better prediction tool for preterm birth.34 Various studies began to test this technology, targeting both low- and high-risk population (Table 6). Studies that analyzed the low-risk population have collectively suggested that the strain value in the internal os or anterior cervical lip is associated with sPTD. Studies targeting the high-risk population showed similar diagnostic performances as our own study in terms of AUC analysis. A study by Woźniak et al.27 including 109 women with a short CL (≤ 2.5 cm) demonstrated that a red color (soft) strain in the internal os showed an AUC of 0.84 for elastography and 0.68 for CL in prediction of preterm birth. In addition, von Schöning et al.25 revealed that the mean proportion of the stiff area within the ROI showed an AUC of 0.711 for elastographic findings and 0.604 for CL in predicting sPTD in women with preterm labor at 23–34 weeks. Despite such similarities, most of these studies used semi-quantitative method in elastographic assessment only using colors.
Table 6
Summary of studies predicting spontaneous preterm birth using elastography

| Year | Study | Design | Risk group | Total | Prevalence of sPTD | Ultrasound system | Compression | ROI | Assessment of elastography | Comparison | Results |
|---|---|---|---|---|---|---|---|---|---|---|---|
| 2014 | Köbbing et al.18 | Prospective cohort study | Low-risk (11–36 wk) | 182 | 17 (11.9) | Toshiba Aplio XG | External (manually) | Four circular ROIs in anterior lip of cervix | Strain measurements using TDI-Q software | Strain ratio (endo/midcx) between preterm and term delivery groups | Strain ratio R selective was identified as the best predictor of sPTD |
| 2014 | Wozniak et al.26 | Prospective observational study | Low-risk (18–22 wk) | 333 | 45 (8.2) | Samsung Medison V20 | Internal (patients' breathing, arterial pulsation) | IOS | Subjective IOS color assessment: red (soft), yellow (medium soft), blue (medium hard), purple (hard) | Frequency of preterm deliveries in various categories of IOS assessment | sPTD < 37 weeks were higher in the red and yellow groups |
| 2015 | Hernandez-Andrade et al.16 | Cross-sectional study | Low-risk (11–28 wk) | 566 | 35 (10.5) | Hitachi Hi Vision | External (manually) | Circular endocervical area in the IOS | The percentage of tissue displacement or deformation that resulted during the manual application of oscillatory pressure | IOS endocervical strain among sPTD ≤ 34, < 37 weeks, and term delivery groups | Strain in the 3rd and 4th quartiles in IOS has increased risk of sPTD ≤ 34, < 37 weeks |
| 2015 | Sabiani et al.22 | Prospective longitudinal study | Low-risk (exam in each trimester) | 72 | 9 (12.5) | Hitachi Hi Vision | External (manually) | 1 cm2 at anterior and posterior lip | EI = E ant. Lip/(E ant. Lip + E post. Lip) | Unfavorable outcome (PTD, PPROM, Em cerclage) between low and high EI groups | Low EI was associated with unfavorable outcomes |
| 2014 | Swiatkowska-Freund et al.24 | Not stated | High-risk (preterm uterine contractions at 22–36 wk) | 44 | 21 (47.7) | Samsung Medison V10 | Internal (patients' breathing, arterial pulsation) | A circle of 5 mm in diameter was placed in each of five regions | Elastography index, five-step (0–4) color scale in anterior.wall, posterior wall, IOS, EOS and cervical canal | Correlation between EI for different parts of the cx and risk of sPTD, and time from exam to delivery | Significant correlation between EI of IOS and time from exam to delivery and also risk of sPTD |
| 2015 | von Schöning et al.25 | Prospective cohort study | High-risk (preterm labor at 23–34 wk) | 64 | 25 (39.1) | Hitachi Hi Vision Preirus | No additional pressure | Rectangular ROI including the cervix and cervical canal | Color scale: blue (stiff), green (average), red (deformable) | Correlation between stiff tissue and preterm birth | The mean proportion of the blue area correlated significantly with preterm birth |
| 2015 | Woźniak et al.27 | Prospective observational study | High-risk (CL ≤ 25 mm at 18–22 wk) | 109 | 45 (41.3) | Samsung Medison V20 | Internal (patients' breathing, arterial pulsation) | IOS | Subjective IOS color assessment: red (soft), yellow (medium soft), blue (medium hard), purple (hard) | Percentage of PTDs in various categories of elastographic cervical assessment | The number of PTDs was significantly higher in the red group, than in the blue and purple groups |
| 2015 | Muller et al.19 | Cross-sectional study | High-risk (preterm uterine contraction at 24–35 wk)/control group | 81/110 | 10 (12)/5 (4.3) | Aixplorer SuperSonic Imagine | Acoustic radiation force impulse (shear wave) | A circle of 8 mm in diameter was placed in lower anterior part of the cervix | Shear wave speed | Shear wave speed in preterm labor or preterm birth (compared to control) | Shear wave speed was significantly reduced in patients diagnosed with pre-term labor and in patients who actually delivered preterm. |
| 2018 | Agarwal et al.14 | Prospective observational study | High-risk (preterm uterine contractions at 28–37 wk) | 34 | 14 (41.2) | Siemens Healthcare Acuson S2000 | Acoustic radiation force impulse (shear wave) | Rectangular ROI (10 × 6mm sized) was placed on the anterior wall of the internal os | 5 color EI and shear wave velocity | EI and shear wave speed between preterm and term birth group | Significant higher EI and lower shear wave speed was observed in preterm birth compared to term birth group |
In our study, we compared multiple elastographic parameters including strain mean level, ECI, and hardness ratio. Among these parameters, the ECI score was found to be crucial in our study population. The ECI score was originally introduced as a semi-quantitative score for assessing mass in thyroid ultrasonography.35 In addition, it was shown to discriminate benign from malignant lesions in the parotid gland, performing an adjunctive role in enhancing the diagnostic performance of gray-scale ultrasound.36 ECI scores are calculated from the strain map to quantify the local stiffness contrast within a nodule or ROI.35 For example, if there are mainly red (hard) pixels or pixels with a color close to red (hard) in the ROI, the contrast of the color in the ROI is small, and the ECI value will accordingly be small. On the other hand, if there is an equal mixture of red (hard) and purple (soft), the contrast of the color in the ROI is high and the ECI score will be larger. It is the same with purple (soft) pixels.
It is noteworthy that we performed subgroup analysis after excluding women with a severely short CL (< 1.5 cm) who account for about 15% of our initial study population. The rationale behind this division is that in a study including patients with an asymptomatic short cervix less than or equal to 1.5 cm, nearly a fourth of patients have intra-amniotic infection/inflammation and 40% of them delivered within 1 week from amniocentesis. Hence, patients with severely short cervix are less likely to benefit from screening and prophylactic administration of progesterone.3738 A recent meta-analysis of individual patient data was also consistent with this.39 In our study, there was no significant difference in the ECI score between the preterm and term delivery groups of women with CL ≤ 1.5cm. Therefore, the diagnostic performance of ECI in the prediction of sPTD was limited to women with a short CL between 1.5 and 2.5 cm. Our interpretation of this data is based on the fact that the mechanical changes in the composition of the cervix are closely related to the ripening process. Indeed, cervical ripening was proved to be associated with in vivo change in the elasticity of the cervix in the animal model.40 The biochemical change associated with a short CL such as the decreased collagen and increased water concentration should already be far advanced in the subgroup with CL less than 1.5 cm. Therefore, the cervix has already become homogenous in terms of biochemical composition in this subgroup, precluding the use of the ECI score to differentiate subsequent preterm delivery from term delivery. Given that the actual preterm birth rate is about 45% in women with CL ≤ 1.5 cm, cervical elastography may not convey additional information in these women with severely short cervix. Instead, women with CL between 1.5 and 2.5 cm, in whom preterm births occurred in about 16% in our study population, can benefit from cervical elastography. As we have very small number (n = 17) of patients with sPTD in patients with CL between 1.5 and 2.5 cm, there is a possibility of overfitting in the prediction model. A larger study looking into the usefulness of E-Cervix elastography will help address the issue, which is under way.
 XML Download