

 PDF
PDF Citation
 Print
Print


INTRODUCTION
Metabolic syndrome is defined as a cluster of metabolic disturbances, including central obesity, high blood pressure, insulin resistance, hypercholesterolemia and dyslipidemia, that are associated with the high risk of cardiovascular disease and diabetes.1234 Previous studies have investigated the prevalence of metabolic syndrome with respect to various demographic variables.56 For example, the prevalence of metabolic syndrome has been reported to show an increasing tendency with age5678 and white collar workers have been reported to have a higher risk of metabolic syndrome than blue-collar workers.9 Gender differences in the prevalence have also been reported, although results are inconsistent.57 Factors associated with metabolic syndrome have also been examined,101112 and in particular, increasing attention has been paid to the relation between serum uric acid and metabolic syndrome. Although serum uric acid is not one of the criteria for diagnosing metabolic syndrome, it is considered to be correlated with metabolic syndrome as both are closely linked with cardiovascular diseases.1314 Uric acid levels have been reported to be higher in those with metabolic syndrome than those without it and to be correlated with the presence of metabolic syndrome.1516 Although some found that the correlation was only valid among women,17 other studies that included only men participants found the correlation as well.1819
However, little study has been performed to examine the association between serum uric acid levels and metabolic syndrome in a nationally representative Korean cohort. One exception is Kim et al.,20 which found that the presence of metabolic syndrome and general obesity were risk factors of hyperuricemia, but it is still unknown whether serum uric acid is a risk factor of metabolic syndrome among the national Korean sample. Therefore, our aim is to examine the association between serum uric acid and metabolic syndrome by using national survey data and to determine how this association varies by age and gender. Although previous research has shown that elevated levels of uric acid are correlated with a risk of metabolic syndrome, optimal cutoff values of uric acid for the prediction of metabolic syndrome and the accuracies of the predictive values have not been determined. Therefore, our study aims to identify optimal uric acid level cutoffs and see if this can be applied in clinical settings.
METHODS
Participants
The current study was performed using data from the seventh Korea National Health and Nutrition Examination Survey (KNHANES VII-1), 2016. KNHANES is a cross-sectional and nationally representative survey study, which is conducted annually, by the Korea Centers for Disease Control and Prevention. KNHANES uses a two-stage, stratified, cluster sampling method, and data are obtained from a health interview, a health examination, and nutrition survey. Health interviews and examinations were conducted by trained staffs at mobile examination centers and nutrition surveys were conducted by visiting homes. The total sample of KNHANES VII-1 involved 8,150 individuals from 3,150 households. In the current study, we included individuals aged ≥ 19 years that reported drinking and smoking statuses and excluded those who are currently having renal failure. As a result, the final sample of this study included 5,758 individuals (2,502 men and 3,256 women).
Anthropometric and biochemical measurements
Waist circumference (WC) was measured at the midpoint between the bottom of the last palpable rib and the top of the iliac crest. Systolic blood pressure (SBP) and diastolic blood pressure (DBP) were measured three times, and the averages of the second and third measurements were subjected to analyses. Blood samples were obtained from a median cubital vein or cephalic vein after an 8-hour fast, and serum triglyceride (TG), high-density lipoprotein (HDL) cholesterol, fasting glucose, and uric acid levels were measured.
Definition of metabolic syndrome
Metabolic syndrome was defined by using the criteria proposed by the National Cholesterol Education Program Adult Treatment Panel III.21 For WC, we used abdominal obesity criteria suggested by Korean Society for the Study of Obesity.22 Metabolic syndrome was defined to be present when at least three of following criteria were met.
Statistical analysis
We performed the descriptive and regression analyses which accounted for sample weights assigned to participants. The association between uric acid and the presence of metabolic syndrome was investigated by logistic regression analysis. Bonferroni correction was used for multiple comparisons. Receiver operating characteristic (ROC) analyses were used to assess optimal uric acid cutoff values for predicting the presence of metabolic syndrome. Optimal uric acid cutoffs were assessed by using Youden's index in ROC analysis.23 The Youden's index is defined as J = sensitivity + specificity − 1 (0 ≤ J ≤ 1). To investigate differences in diagnostic accuracies among groups, we compared the area under receiver operating characteristic curves (AUCs) using the Z statistic and Delong's method using the Bootstrap test (for correlated AUCs). All analyses were conducted using IBM SPSS, version 20 (Complex Samples Plan; IBM Corp., Armonk, NY, USA) or R, version 3.5.3 (pROC package; R Foundation, Vienna, Austria). Statistical significance was accepted for P < 0.05.
RESULTS
Baseline characteristics of the study population
The characteristics of study participants (n = 5,758) are shown in Table 1. Of these, 4,159 were considered normal (not to have metabolic syndrome; 1,712 men and 2,447 women), and 1,599 were considered to have metabolic syndrome (790 men and 809 women). Mean age in the metabolic syndrome group (53.69 ± 0.54 years) was significantly higher than that in the normal group (44.15 ± 0.38 years; P < 0.001). Mean age of women with metabolic (58.95 ± 0.62) was significantly higher than that of men with metabolic syndrome (49.83 ± 0.58; P < 0.001 using a general linear regression analysis for complex data). The anthropometric and biochemical measurements among the metabolic syndrome and normal groups are also displayed in Table 1. Compared to the normal group, the metabolic syndrome group tended to be higher in their WC, TG, fasting glucose, diastolic pressure, uric acid levels and percentages of treatment of diabetes mellitus, and be lower in their HDL cholesterol levels.
Table 1
Characteristics of study population
Prevalence of metabolic syndrome
Prevalences of metabolic syndrome among study subjects are summarized in Table 2. The overall prevalence of metabolic syndrome was 27.8% (31.6% among men and 24.8% among women). Among men, the prevalence of metabolic syndrome was about 10% among those aged 19–29, about three times higher in those aged 30–39 years, and remained at around 35% in those aged ≥ 40. Among women, the prevalence was < 10% among those aged < 40 and gradually increased with age. Among all study subjects, the number of diagnostic criteria most frequently met was 3, followed in order by 4 and 5.
Table 2
Prevalences of metabolic syndrome by age and gender
Associations between metabolic syndrome and uric acid levels
Associations between metabolic syndrome and serum uric acid levels were examined using logistic analyses for complex survey data (Table 3). Among all study subjects, we found a significant association between uric acid levels and risk of metabolic syndrome. Specifically, a high uric acid level was found to confer significant risk of metabolic syndrome regardless of the number of metabolic syndrome criteria met in the simple and the multiple model adjusted for gender, age, drinking, and smoking (P < 0.001). The risk of metabolic syndrome (the number of criteria met ≥ 3) was found to be increased by a high uric acid level, odds ratio (OR), 1.508 (95% confidence interval [CI], 1.410–1.614) in the multiple model and OR, 1.404 (95% CI, 1.337–1.475) in the simple model. In the multiple model (number of criteria met ≥ 3), age and gender were associated with increased risk of metabolic syndrome (OR, 1.044; 95% CI, 1.039–1.049 for age and OR, 1.303; 95% CI, 1.041–1.631 for gender).
Table 3
Associations between uric acid level and the presence of metabolic syndrome

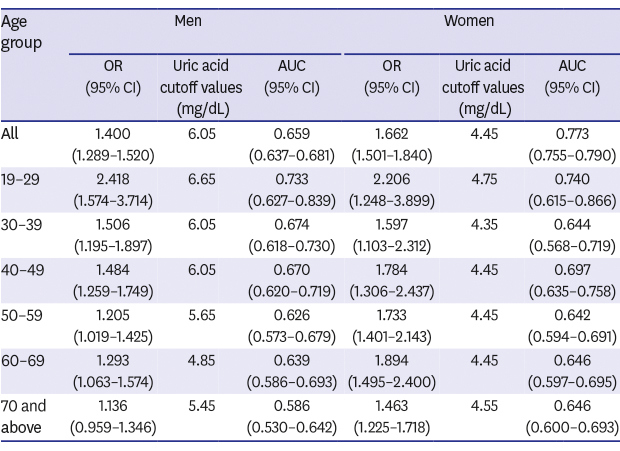
Therefore, we analyzed the effects of age and gender on the association between uric acid level and metabolic syndrome (Table 4). Within each gender group, uric acid levels were associated with the risk for metabolic syndrome in the simple models (OR, 1.733; 95% CI, 1.576–1.905 for all women and OR, 1.308; 95% CI, 1.212–1.411 for all men) and in the multiple models adjusted for drinking, smoking and age (OR, 1.662; 95% CI, 1.501–1.840 for all women and OR, 1.400; 95% CI, 1.289–1.520 for all men). Uric acid levels were also found to confer significant risks of metabolic syndrome among all age and gender subgroups in both the simple and multiple models (all Ps < 0.05) except for men in their 70s (P = 0.103 in the simple model and P = 0.139 in the multiple model). ORs for the presence of metabolic syndrome by age and gender are presented in Table 4.
Table 4
Results of ROC analyses by age and gender
Only adjusted models for ‘All’ groups were adjusted for smoking, drinking, and age. Bonferroni corrected P values for subgroup analyses were presented in parentheses.
OR = odds ratio, CI = confidence interval, AUC = area under the receiver operating characteristic curve.
aP values obtained by Bootstrap test for two correlated receiver operating characteristic curves.
Uric acid cutoffs for predicting the presence of metabolic syndrome
Optimal cutoff values were determined using Youden's index derived by ROC analyses. AUCs were used to assess the performances of the simple and adjusted multiple models.
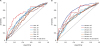
Results by age and gender are presented in Table 4. The AUC estimate for women in the multiple model (0.773; 95% CI, 0.755–0.790) was higher than that for men (0.659; 95% CI, 0.637–0.681; P < 0.001). When stratified by age, AUC estimates did not differ by gender (Bonferroni corrected Ps > 0.05). AUC estimates for those aged in their 20s (19–29 years) were highest for men (0.733; 95% CI, 0.627–0.839) and women (0.740; 95% CI, 0.615–0.866). A comparison of AUC values among men age groups revealed that men in their 20s, 30s, and 40s had significantly higher AUC values than those in their 70s (AUC = 0.733 vs. 0.586, P = 0.016 for 20s vs. 70s; AUC = 0.674 vs. 0.586, P = 0.029 for 30s vs. 70s; AUC = 0.670 vs. 0.586, P = 0.028 for 40s vs. 70s) (Fig. 1A). However, among women, AUC values did not differ by age (Fig. 1B). No significant difference in AUC performance was observed among age subgroups when the simple and multiple models were compared, with the exception of men in their 40s. Accordingly, for clinical purposes, we focused on optimal cutoffs estimated by using the simple model.
Fig. 1
Receiver operating characteristic curves of uric acid levels for predicting the presence of metabolic syndrome (multiple model after adjusting for smoking and drinking). (A) Men and (B) women. P = 0.016 for men in their 20s vs. men in their 70s; P = 0.029 for men in their 30s vs. men in their 70s; P = 0.028 for men in their 40s vs. men in their 70s.
The optimal uric acid cutoff was 6.05 mg/dL for men and 4.45 mg/dL for women. Overall, men had a higher uric acid cutoff value than women in all age groups. For men, the highest optimal cutoff value for the presence of metabolic syndrome was observed for those in their 20s (6.65 mg/dL). Men in their 30s and 40s had a cutoff value of around 6 and older men had slightly lower cutoffs. For women, the highest optimal cutoff value was also observed for those in their 20s (4.75 mg/dL), and cutoff values remained similar (showed a slight reducing tendency) with increasing age.
DISCUSSION
In the current study, the prevalence of metabolic syndrome was 27.8% among all participants, with 31.6% among men and 24.8% among women. Although our study only included 5,758 participants, these results are similar to the prevalence found in a previous study using data from the Korean National Health and Nutrition Examination Survey 2008–2013, which included 34,587 participants.24 Building on a previous finding that the prevalence of metabolic syndrome increased with age,5678 the present study provides a more detailed picture of how prevalence rates differ by age and gender. For men, the prevalence of metabolic syndrome increased sharply from 19 to 39 years and then stabilized, whereas women showed a steady increase in prevalence with age.
One of the aims of the present study was to determine the nature of the association between serum uric acid level and risk of metabolic syndrome. We found that those with metabolic syndrome had higher serum uric acid levels than those in the normal group, which is consistent with previous findings.151625 Furthermore, in the multiple model, age and gender were found to be significant confounding variables, which highlights the need to examine ORs by gender and age. When we examined the effects of age and gender on the association between uric acid level and metabolic syndrome, an elevated uric acid level was found to be associated with risk of metabolic syndrome for all gender and age sub-groups except for men in their 70s.
AUC analyses of uric acid levels for the detection of metabolic syndrome provided good performances with 0.661 (95% CI, 0.638–0.683) and 0.772 (95% CI, 0.754–0.790) for men and women, respectively. Women subjects had significantly higher AUC values than men subjects, but this gender difference may also have been influenced by age. When we compared the AUC values of men and women within each age subgroup, no significant difference was found. Among women subjects, we did not find any differences in AUC estimates among age subgroups. However, among men, AUC estimates were found to be more useful diagnostically for those in their 20s, 30s, and 40s than for those in their 70s. This suggests that the use of uric acid levels to diagnose metabolic syndrome is sounder in younger adult men than in older men. The uric acid level may be an important risk factor of metabolic syndrome in younger adult men, whereas in older men, other risk factors may become important.
In the present study, we identified optimal cutoff values of uric acid levels for determining the presence of metabolic syndrome by age and gender. The cutoff value for all men subjects (6.05 mg/dL) was higher than that of all women subjects (4.45 mg/dL), and this was true in all age subgroups. However, cutoff values were highest for subjects in their 20s for men and women. Given that AUC performances were highest for those aged in their 20s (AUC, 0.733; 0.740 for men and women, respectively), cutoff values may be particularly important in young adulthood. Furthermore, the patterns of the cutoff values among the age subgroups appeared to differ by gender. The cutoff values were similar across all age subgroups among women whereas they steadily decreased with age among men. Hyperuricemia is defined as a uric acid level of > 6.5 or 7.0 mg/dL in men and one of > 6.0 mg/dL in women.26 In the present study, except for men in their 20s, the optimal cutoff values of uric acid levels did not exceed hyperuricemia levels. In women, the optimal cutoff values were relatively far from hyperuricemia levels. These findings suggest that even when uric acid levels fall within normal ranges, attention should be paid to those with a uric acid level that exceed the cutoff values identified in the present study, particularly for women. The suggested cutoff values for uric acid levels might offer useful means of diagnosing metabolic syndrome in clinical settings.
Some limitations of the present study warrant consideration. First, we used a national survey but only 5,758 participants' data had uric acid data. Due to the small sample size compared to clinical studies using general national data, caution might be needed in terms of generalizability of our findings. Larger clinical studies will need to be conducted in the future to confirm the generalizability of the results. Second, this study shows that an association exists between serum uric acid level and metabolic syndrome, but its cross-sectional design preempts any conclusions regarding causality. Recent studies have shown the links between serum uric acid and its longitudinal effects on the incidence of metabolic syndrome,2728 but their inconsistent results raised the question regarding whether uric acid levels are risk or protective factors of metabolic syndrome. More longitudinal studies should be conducted to examine the links. Third, the use of some medications, such as statin, angiotensin receptor blocker, and fibrate, can affect the level of serum uric acid, but we could not control these factors as they were not available in the national Korean data we used. Further longitudinal studies that include factors that might influence this association are needed to investigate the directionality of the link between uric acid and metabolic syndrome.
Despite these limitations, the present study contributes to the literature by demonstrating how associations between serum uric acid level and metabolic syndrome differ by age and gender. We assessed substantial performances of uric acid levels for the detection of metabolic syndrome, particularly in younger adults. Also, the optimal cutoffs of uric acid levels by age and gender identified in the present study may be useful for diagnosing a risk of metabolic syndrome in the clinical setting.
 XML Download