

 PDF
PDF Citation
 Print
Print


INTRODUCTION
Traumatic brain injury (TBI) is one of the leading causes of pediatric disability that results in many emergency department (ED) visits and hospitalizations.1 There is a high risk of TBI while playing sports, especially those involving interpersonal contact and collisions. According to a national health statistics report, an average annual estimate of 8.6 million sports and recreation related injury episodes occurred in the United States (US). Among these injuries, 65% involved persons aged 5–24 years, with the highest rate observed in children aged 5–14 years.2 Previous studies demonstrated that 60%–90% of sports-related TBI ED visits are by children, with an estimated number of 283,000 cases of pediatric sports-related TBI occurring annually in the US.134 Although there is a report that the number has recently leveled-off since 2012, until then it had increased constantly and dramatically.34
TBI in childhood has clinical importance because it can result in hospitalization or significant disability. Although most children with head trauma do not require treatment, some children have clinically significant intracranial injuries.5678 Compared to adults, children are more vulnerable to head injury due to a larger head, softer cranial bones, weaker neck muscles, and a thinner cortex. Consequently, TBI can greatly impact the child's brain maturation and skill development.9 Even in minor head concussions, symptoms, such as headache, dizziness, and difficulty concentrating, can delay children from returning to play and school.10
Although there has been previous research about TBI among high school and professional athletes,111213 few studies have focused on the whole pediatric population. In addition, most of the studies focused on TBI caused by sports that are popular among adults. However, the type of sports practiced by children are much more diverse, and the characteristics of sports-related TBI could differ among different sports types. Overall, information on the characteristics and outcomes of children with sports-related TBI is still limited.
The purpose of this study was to examine the demographics and clinical characteristics of pediatric sports-related TBI through the analysis of an ED-based multicenter surveillance system in Korea.
METHODS
Study design
We performed a multicenter observational study using data from the Emergency Department–Based Injury In-Depth Surveillance (EDIIS) database in Korea. The Korea Center for Disease Control and Prevention developed the EDIIS, which is a prospective database of injured patients visiting the ED in Korea. Information about the injured patient and injury event is gathered in the EDIIS database, and is used for national policy planning in injury prevention.1415 The number of EDs that participated in the EDIIS was 20 during 2011–2014 and 23 during 2015–2016.16 All hospitals that participated in the EDIIS collected basic information of injury patients, which we used to perform this study.
Data collection
The EDIIS was developed based on the International Classification of External Causes of Injuries proposed by the World Health Organization.14 Patient characteristics, prehospital emergency medical service records, and injury-related information such as time, place, and mechanism of injury were included. The EDIIS also contains ED assessment, treatment, disposition, and patient outcomes after admission.
General physicians collected the initial data from patients who visited the hospital due to injury. Then, emergency medicine physicians and trained research coordinators supervised and revised most of the recorded information. The trained research coordinators regularly entered the information into a Web-based database system provided by the Korea CDC. The project quality management committee reviewed the data monthly, and provided feedback to ensure the quality of data.1415
Study population
The study population was patients aged 5 to 18 years old, who sustained an unintentional, sports-related head injury and visited 1 of the 23 EDs between January 2011 and December 2016. According to the International Classification of External Causes of Injuries, participation in a sport or exercise activity includes practice, training, and competition, as well as pre-event (e.g., taping and dressing), warm-up, cool down, and post-event (e.g., showering and dressing) activities. It does not include travel to and from the event or activity.17 Based on this definition, an injury was determined to be sports-related if the EDIIS code indicating the type of activity was either ‘sports’ or ‘school gym class or school sports.’ The activity ‘sports’ was defined as competitive physical activity or activity to enhance one’s physical strength. Such activities that were done in school were coded separately as ‘school gym class or school sports.’ Children simply playing without any competition or rules were considered doing ‘leisure activity’ and were not included in ‘sports.’ Also, children who sustained injury during commuting to school or other place were considered as doing ‘education activity’ or ‘other activity’ and were not included in ‘sports.’ Patients without information on the type of sports practiced before TBI were excluded.
Main outcomes
The primary outcome was TBI, defined by International Classification of Diseases Version 10 (ICD-10) codes of skull fracture (S02.0, S02.1, S02.7, S02.8), concussion (S06.0), or intracranial injury (S06.1-S06.9), as recorded on the discharge summary after the ED visit or hospital admission. Currently, there is no consensus on the definition of TBI by ICD-10 codes but most studies include diagnosis codes of S06.0-S06.9 as TBI.18192021 Considering the definition of TBI as a disruption in the normal function of the brain by head injury, we added codes for skull fractures which have a high possibility of impacting the brain, and excluded codes for superficial injuries, lacerations, and facial injuries which were less likely to do so.1822 The secondary outcomes were intracranial injury and admission to the general ward or ICU, as recorded on the discharge summary after the ED visit or hospital admission. The intracranial injury was defined by the ICD-10 code S06.1-S06.9.
Variables and measurements
The main variable of interest was the type of sports the patient participated in at the time of injury. Sports types were classified into 6 categories (field sports, floor sports, bicycle and street sports, water sports, racket sports, and others), based on Tator's literature “Catastrophic Injuries in Sports and Recreation: Causes and Prevention: a Canadian Study. Toronto,” with minor modifications.23 Field sports were defined as sports played on an outdoor field, including soccer, American football, rugby, baseball, softball, field hockey, track running. Floor sports were defined as sports played on a floor, including basketball, handball, volleyball, gymnastics, weight lifting, boxing, kick-boxing, and taekwondo. Jokgu (football) and dodgeball were not mentioned in the reference literature, but were included as floor sports due to their similarities with volleyball and handball respectively. Bicycle and street sports included a marathon, walking, running, cycling, skating, and kick-boarding. Water sports were defined as all kinds of sports that take place in or on water including diving, scuba-diving, surfing, swimming, canoeing, boating activities, waterskiing, water polo, and fishing. Racket sports included badminton, racquetball, squash, tennis and table tennis. Information on the demographic factors (age, sex), injury-related factors (time, place, mechanism, and activity), prehospital factors (emergency medical services use), hospital factors (initial Excess Mortality Ratio-adjusted Injury Severity Score [EMR-ISS] and ED disposition), and clinical outcomes were obtained from the patients or their guardians during the patient examination by the emergency physicians or general physicians.
Patients were grouped by age into 3 categories: 5–12 years old, 13–15 years old, and 16–18 years old. Children under 5 years of age were excluded as in previous literature,224 due to their limited participation in sports activities. These age brackets were determined considering the representations of typical stages in the educational system (preschool and primary school, middle school, and high school) and the increasing incidence of TBI with age. The season in which the patient arrived at the ED was categorized into 4 groups: spring (March–May), summer (June–August), fall (September–November), and winter (December–February). The day of the week on which the patient arrived at the ED was categorized into 2 groups: weekdays (Monday–Friday), and weekends (Saturday–Sunday). The time at which the patient arrived at the ED was categorized into 2 groups: nighttime (6PM–6AM) and daytime (6AM–6PM).
Statistical analysis
We performed descriptive analysis to examine and understand the distribution of the study variables. The primary and secondary outcome results are presented as odds ratios (OR) and adjusted odds ratios (aORs) with corresponding 95% confidence intervals (95% CIs), analyzed with the use of multivariable logistic regression model. All the multivariable analyses were conducted with multivariable logistic regression, adjusted for age, sex, season of visit, day of visit, hour of visit, and place of injury.
To examine the association between sports types and outcomes according to age and sex subgroups, separate logistic regression models were constructed for age and sex subgroups. Because of the limited sample size, the water sports group was incorporated into other groups in those stratified analyses. Age, sex, season of visit, day of visit, hour of visit and place of injury were adjusted in stratified analyses.
Additional sensitivity analyses of primary and secondary outcomes for patients with isolated head injury within the study population were performed to see if injuries of other parts of the body had affected the study outcomes.
All statistical analysis was performed using SAS software, version 9.4 (SAS Institute Inc., Cary, NC, USA). P values were based on a two-sided significance level of 0.05.
RESULTS
Patient demographics and injury characteristics
Of the 1,537,617 injured patients, 10,717 (0.7%) patients were eligible for study inclusion, excluding age < 5 or age > 18 years old (n = 1,275,309), sports unrelated injury (n = 235,460), trauma without head injury (n = 14,961), sports type missing or unknown (n = 1,162), and intentional injury or injury with unknown intention (n = 8) (Fig. 1).
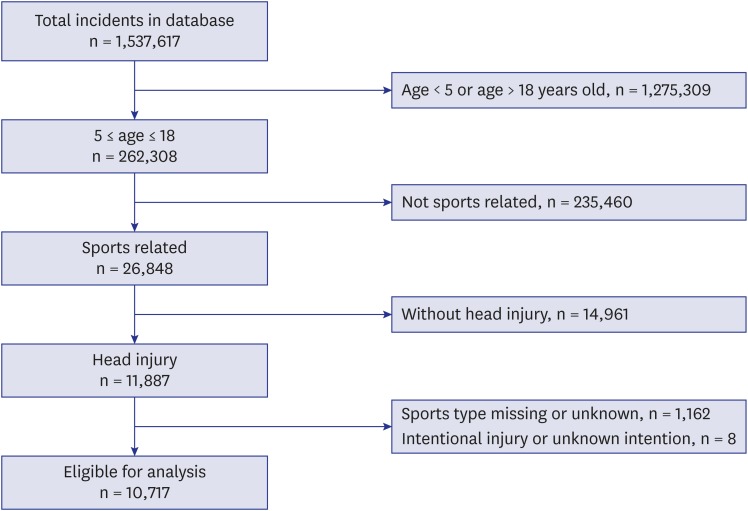
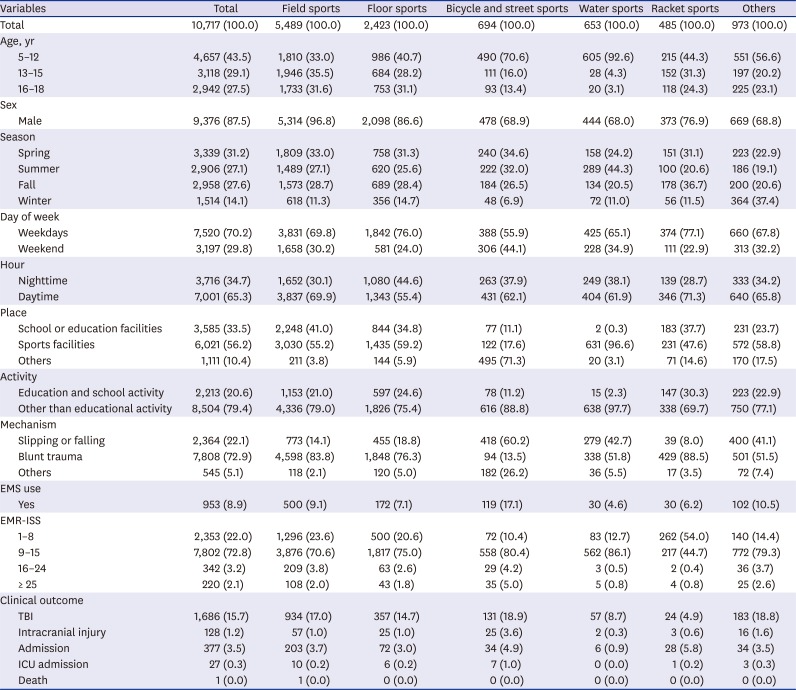
Table 1 shows patient demographics by sports type. Most of the patients were male (87.5%). Children aged 5-12 constituted 43.5% of the total study population. The percentages of patients injured at school or education facilities and sports facilities were 33.5% and 56.2%, respectively. The most common mechanism of injury was blunt injury (72.9%). The most common sports type category was field sports (51.2%), followed by floor sports (22.6%), bicycle and street sports (6.5%), water sports (6.1%), and racket sports (4.5%). In terms of clinical outcomes, the percentages of TBI, intracranial injury, and admission were 15.7%, 1.2%, and 3.5%, respectively (Table 1). The number of TBI in males was 1,502 (89.1%) which was 8 fold the number of that in females (10.9%).
Table 1
Demographic findings and clinical outcomes by sports type
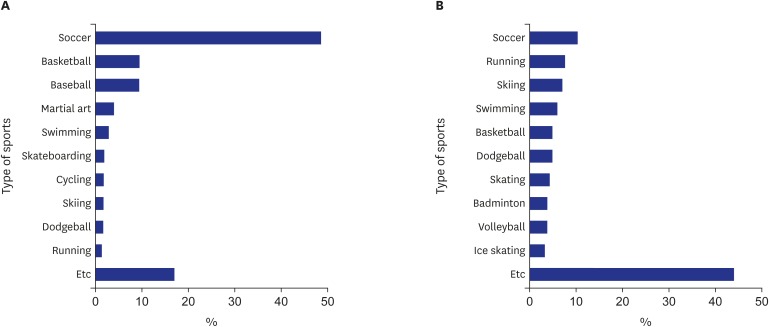
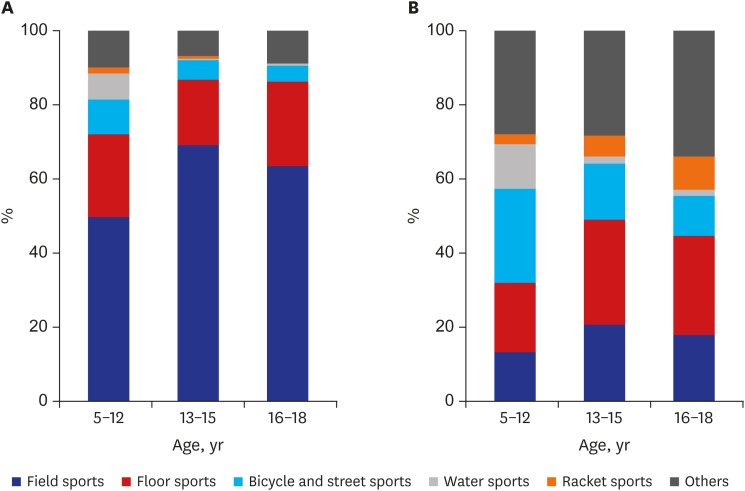
The percentages of the top ten sports-related TBI in males and females are shown in Fig. 2. The number of TBI in males was highest for soccer (48.6%), basketball (9.5%), and baseball (9.5%). In females, the number of TBI was highest for soccer (10.3%), running (7.6%), and skiing (7.1%) (Fig. 2). The percentages of each sports type of TBI in males and females are shown in Fig. 3. The number of TBI in males was highest in field sports, floor sports, bicycle and street sports in decreasing order for all age groups. For females aged 5–12, the number of TBI was highest in bicycle and street sports, floor sports, and field sports. For females older than 12, the number of TBI was highest in floor sports, field sports, and bicycle and street sports (Fig. 3).
Multivariable logistic regression analysis
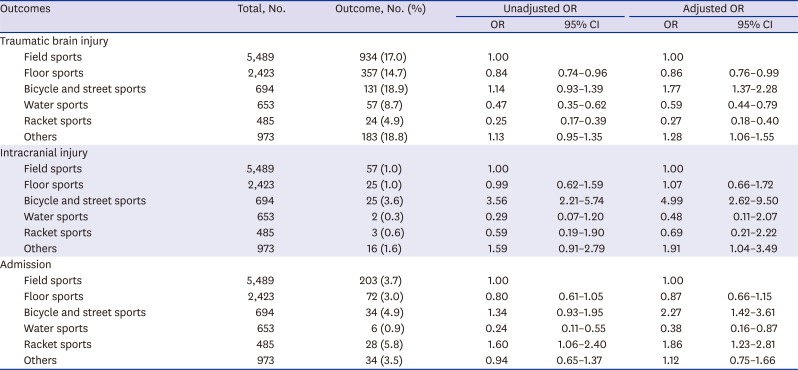
Table 2 shows the results of the multivariable logistic regression for the primary and secondary outcomes. The aOR of TBI compared to field sports was 1.77 (95% CI, 1.37–2.28) in bicycle and street sports, 0.86 (95% CI, 0.76–0.99) in floor sports, 0.59 (95% CI, 0.44–0.79) in water sports, and 0.27 (95% CI, 0.18–0.40) in racket sports. The aOR of intracranial injury compared to field sports was 4.99 (95% CI, 2.62–9.50) in bicycle and street sports. The aORs of admission compared to field sports were 2.27 (95% CI, 1.42–3.61) in bicycle and street sports, 1.86 (95% CI, 1.23–2.81) in racket sports, and 0.38 (95% CI, 0.16–0.87) in water sports (Table 2).
Table 2
Odds ratios and 95% CIs for outcomes by sports type
Tables 3 and 4 shows the results of multivariable logistic regression by different age groups and sex, respectively. The aORs of TBI sustained in bicycle and street sports compared to field sports were 1.43 (95% CI, 1.00–2.04; 14.9% vs. 16.5%) for the 5–12 years group, 3.11 (95% CI, 1.90–5.09; 31.5% vs. 18.9%) for the 13–15 years group, and 1.43 (95% CI, 0.81–2.54; 24.7% vs. 15.5%) for the 16–18 years group. Unlike other age groups, the aOR of TBI sustained in bicycle and street sports for the 16–18 years group was not significantly higher compared to field sports. The aORs of admission in bicycle and street sports were 3.63 (95% CI, 1.84–7.17; 4.5% vs. 2.2%) for the 5–12 years group, 0.88 (95% CI, 0.29–2.71; 3.6% vs. 4.8%) for the 13–15 years group, and 2.71 (95% CI, 1.07–6.88; 8.6% vs. 4.1%) for the 16–18 years group. Unlike other age groups, the aOR of admission in bicycle and street sports for the 13–15 years group was not significantly higher compared to field sports. The aOR of admission in racket sports was 4.20 (95% CI, 2.24–7.86; 7.0% vs. 2.2%) compared to field sports for the 5–12 years group, differing from other age groups that had no significant difference (Table 3).
Table 3
Association of sports type and outcomes by age group
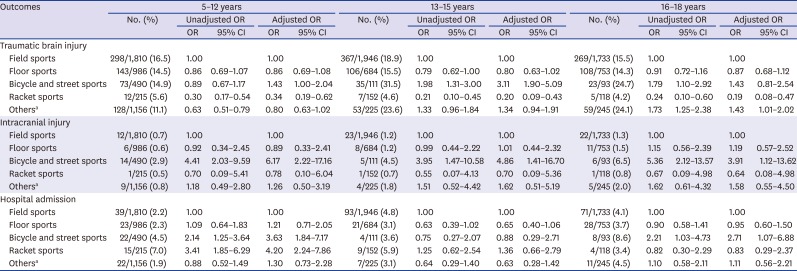
Table 4
Association of sports type and outcomes by sex
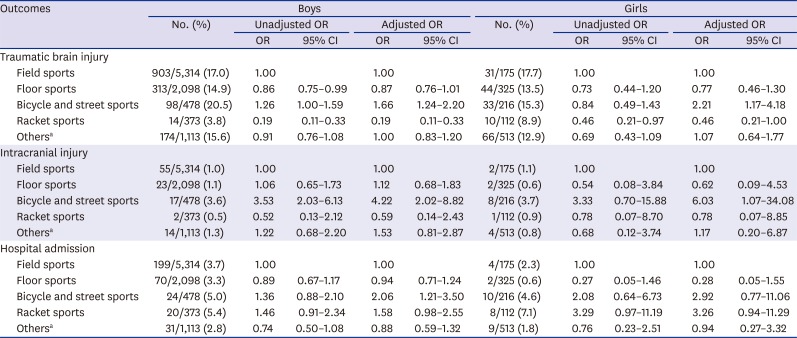
The aORs of intracranial injury sustained in bicycle and street sports were 4.22 (95% CI, 2.02–8.82; 3.6% vs. 1.0%) for males and 6.03 (95% CI, 1.07–34.08; 3.7% vs. 1.1%) for females. The aORs of admission sustained in bicycle and street sports were 2.06 (95% CI, 1.21–3.50; 5.0% vs. 3.7%) for males and 2.92 (95% CI, 0.77–11.06; 4.6% vs. 2.3%) for females (Table 4).
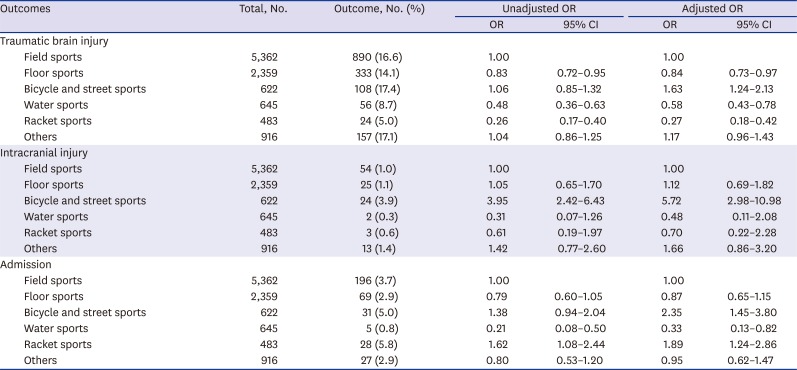
The sensitivity analysis for isolated head injury patients did not alter the trend of the results of multivariable logistic regression for the outcomes (Table 5).
Table 5
OR and 95% CIs for outcomes in isolated head injury patients
DISCUSSION
Pediatric sports-related TBI is an important public health concern that is gaining more attention as the number of injuries increases. However, large population-based studies in this field are insufficient. Using the EDIIS, we were able to obtain a large sample that fits into our inclusion criteria. TBI was chosen as the primary outcome, and serious injuries (intracranial injury) and hospitalizations were chosen as the secondary outcomes. Most of the patients were male (87.5%) and the most common sports type was field sports (51.2%). The percentage of sports type responsible for TBI were different among different age and sex subgroups. Multivariable logistic regression revealed that the aORs for TBI, intracranial injury, and admission were highest for bicycle and street sports.
To our knowledge, there is no nationwide epidemiologic study about sports-related TBI in Korea. This retrospective observational study presents epidemiologic data on ED visits of pediatric sports-related TBI in Korea. Previous literature typically focused on a few types of sports that were most commonly played at school or were most commonly associated with TBI.111224 In this study, we analyzed all types of sports that caused TBI resulting in ED visits during our research period. Then, we grouped the types of sports into 6 categories according to previous literature. Effective injury prevention programs have traditionally involved education, engineering (modifying the environment), and enforcement or legislation.23 The sports classification we used has strengths in injury prevention because it contains information about the environment of injury. For example, we could prevent injury by maintaining the quality of the playing fields, choosing a safer material for the floor, and enforcing life jackets while playing water sports. Using the EDIIS database, we could acquire information on injuries about individual sports, which helped us to understand the characteristics of each group.
The number of ED visits due to head injuries and TBI were 7–8 fold larger in males compared to females (Table 1). In studies conducted on US EDs, the number of TBI in males were 2–3 fold the number of females.134 To understand why the male to female ratio of TBI is higher in Korea, further research on the differences between male and female sports participation is needed. In our study, there was not much difference between the percentage of 13–15 years group (29.1%) and 16–18 years group (27.5%). Together, they constituted more than half of the total incidence, which is similar to other studies in that middle and high school age children bore a significant portion of the TBI burden.34
In particular, males most often sustained TBI while playing soccer, and the top 4 sports for causing TBIs were all field or floor sports (Fig. 2). In the US, the most common sports related to TBI in males was football. In Korea however, most children enjoy soccer, but football is not popular which would have made the difference between the countries. The type of sports most related to TBI is expected to be different among countries due to differences in the popularity of each sport. The type of sports responsible for TBI in females was more diverse.
We found that the rate of TBI due to water sports, bicycle, and street sports decreased after age 12. On the other hand, the rate of TBI due to field sports and floor sports increased after age 12. Sports activities become more systematic in the community starting in middle childhood, which could be a possible explanation for this trend.1 Although the specific sports could differ, this trend is consistent with other studies done in the US.14 As children playing group sports, such as soccer, basketball, baseball, increase, the incidence of injury due to these sports increases.
The multivariable logistic regression revealed that the AOR of TBI, intracranial injury, and admission due to bicycle and street sports was significantly higher compared to field sports (Table 2). The possible reason for this result is that in the group bicycle and street sports, there are many high-velocity sports including cycling, skating, and kick-boarding. In a previous study conducted in New Zealand, it was found that cycling resulted in the highest number of moderate and severe injuries for those under age 16.25 In light of this logistic analysis result, a physician should consider performing further evaluations such as a brain CT scan in a case of head injury due to bicycle and street sports. Additionally, the Centers for Disease Control and Prevention reported an 80% decrease in bicycling-related head injuries associated with helmet use in 2011.26 Thus, to reduce TBI and admission, helmet use should be more strongly encouraged.
Compared to field sports, the AOR of TBI for water sports and racket sports were significantly lower (Table 2). Most of the water sports and racket sports do not involve interpersonal contact, which could be a reason for this result. The AORs of intracranial injury for water sports and racket sports show a similar trend, although not significant. With a larger study population, we might be able to retrieve a significant result. The ratio of admission for racket sports injuries was significantly higher compared to field sports. We first assumed that admission from injuries other than head injuries had affected this result. However, the sensitivity analysis for isolated head injury patients showed the same results (Table 5). Further studies are required to explain this result.
Although some results were not statistically significant, age and sex do not seem to alter the trend of multivariable logistic regression analysis results (Tables 3 and 4).
This study has several limitations. First, we used data from the EDIIS, which is a database of 23 tertiary hospitals in Korea. Although the hospitals are in diverse areas of the country, the included subjects represent only a proportion of children with TBI in Korea. Minor TBI patients may not have visited a hospital for evaluation, and patients with more severe injuries tend to visit a tertiary hospital rather than a primary or secondary hospital. Considering these factors, the incidence of TBI and intracranial injury of children with a head injury could have been overestimated. To overcome this selection bias, a national survey is highly desirable.
Second, data of patient and injury characteristics were missing in many fields of the EDIIS database. Therefore, we excluded the patients with unknown information about the type of sports they participated in. Additionally, we did not analyze other factors such as prehospital care, initial emergency department GCS scores, and initial vital signs because many data were missing.
Third, as mentioned in a previous epidemiologic study using the EDIIS database, there were insufficient data about the main department of admission and coexisting injuries.5 Therefore, it was difficult to determine whether the admission was due to TBI or intracranial injury or due to other coexisting problems.
Fourth, distinguishing sports from simple playing could be ambiguous in children. For example, children playing with a soccer ball on the street without rules could be in a competing physical activity, but it would be uncertain whether they are participating in sports. However, through quality control measures as aforementioned, different physicians from different hospitals were guided to follow the definition of sports according to the EDIIS manual, ensuring consistency and reducing bias.
In conclusion, the clinical characteristics and outcomes of sports-related TBI in children significantly differ by the types of sports. The ratios of TBI, intracranial injury and admission of pediatric sports-related head injury were highest in bicycle and street sports. The epidemiology of TBI differs among different age and sex groups indicating the need for individualized prevention strategies. This is the first nationwide epidemiologic study of pediatric sports-related TBI in Korea. We propose that prevention strategies for pediatric sports-related TBI can be developed according to sports types.
 XML Download