

 PDF
PDF Citation
 Print
Print


INTRODUCTION
The selection of embryo with best quality for transfer has been the major issue in in vitro fertilization (IVF) era. The standard morphological evaluation has been the most widely used method for embryo selection.1 However, this method has some limitations. First, it is a very subjective assessment which results may vary among different observers. Second, there may be high variability in embryo scoring since the morphology can vary widely within a few hours.2 Therefore, the clinical outcomes of patients with challenging infertility diagnoses such as recurrent pregnancy loss or recurrent implantation failure have not been improved much when their embryos were evaluated solely with morphological evaluations. Another method that may screen embryos with better implantation chances has been needed.
Preimplantation genetic screening (PGS) is derived from preimplantation genetic diagnosis, which was used for testing whether the embryo has the genetically inheritable gender-linked monogenic diseases.3 PGS analyzes all 24 chromosomes by comprehensive chromosomal screening with different techniques such as fluorescent in situ hybridization, array comparative genomic hybridization (aCGH), and next generation sequencing (NGS) to select euploid embryos that will most likely result in pregnancy. It was hypothesized that PGS may improve the pregnancy rates in women with advanced maternal age, recurrent implantation failure, or recurrent miscarriage.456
However, PGS also had limitations such as having large numbers of false-positive diagnoses due to mosaicism, disposal of normal euploid embryos, or excluding patients from access to ETs.78 Because of this limitation, the Preimplantation Genetic International Society defined new diagnostic criteria for PGS.9 Technical advancements such as blastocyst trophectoderm (TE) biopsy and NGS are aiming for better accuracy, but PGS is still not yet a perfect study for every patient. Selecting the right indication for PGS is beneficial for saving both time and money required for the challenging infertile patients to get pregnant.
The aims of this study are to find the correlation between morphologic grading and PGS euploid rates, and the indication of PGS according to age. The present study analyzed the relationship between morphological grading and PGS euploidy rates on blastocyst stage, and compared clinical efficiency of PGS among different age groups by calculating the ongoing pregnancy rate to see which category of patients may benefit the most by having PGS done.
METHODS
Patient details
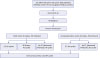
This retrospective study was performed using the medical records of 136 patients who underwent IVF procedures with PGS on blastocyst stage between January 2016 and February 2017 in Fertility Center of CHA Gangnam Medical Center. PGS on blastocyst stage was offered to infertile patients of advanced age (≥ 35 year; 61.0%), and/or with ≥ 3 unexplained recurrent pregnancy losses previously (27.9%) and/or ≥ 3 recurrent implantation failures previously (47.8%) (Table 1). The exclusion criteria were those who had 3-day embryo biopsied for PGS and those who did not undergo PGS (Fig. 1).
Table 1
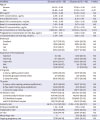
Baseline characteristics of the study participants
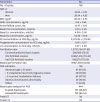
Values are presented as mean ± standard deviation (SD) or number (%).
BMI = body mass index, AMH = anti-Mullerian hormone, FSH = follicle stimulating hormone, LH = luteinizing hormone, E2 = estradiol, hCG = human choriogonadotropin, ICSI = intracytoplasmic sperm injection, PGS = preimplantation genetic screening, ET = embryo transfer.
Clinical protocols
Gonadotropin-releasing hormone (GnRH) antagonist and agonist protocols were used in this study. Gonadotropin doses were formulated according to the patient's antral follicular count, antimüllerian hormone, and previous response to stimulation. Transvaginal ultrasound was performed to monitor follicular response to stimulation and gonadotropin doses were adjusted accordingly. Final oocyte maturation was triggered with hCG (Ovidrel; Merck, Kenilworth, NJ, USA) with or without GnRH agonist (Superfact; Sanofi-Aventis, Paris, France) when the mean diameter of ≥ 2 follicles sized ≥ 17 mm. Ultrasound-guided oocyte-retrieval under conscious sedation was performed 34–36 hours after the trigger.
Luteal phase support was provided either with progesterone vaginal suppositories, such as Utrogestan (Besins Healthcare, Paris, France), Lutinus (Ferring, Saint-Prex, Switzerland), Crinone gel 8% (Merck) or intramuscular injections (Sugest; Sanzyme Ltd., Banjara Hills, India) starting on the day of fresh ET. For frozen-thawed ET, luteal phase support was given starting from 5 days before the ET.
Embryo morphologic grading and biopsy
Blastocysts were graded according to the degree of expansion, inner cell mass (ICM) and TE morphology. The blastocoel expansion grading system is as follows: Early, the blastocoel filling < 50% of the nonexpanded embryo; Mid, the blastocoel filling > 50% of the embryo; Expanded, full blastocyst, cavity completely filling the embryo, or expanded blastocyst, cavity larger than the embryo with a thin zona pellucida; Hatching, a hatching blastocyst; Hatched, a blasctocyst that has completely hatched out of the zona pellucida. The ICM grading was as follows: A, many, tightly packed cells; B, loosely grouped several cells; C, very few cells. Similarly TE grading was A, many cells creating cohesive epithelium; B, few cells forming loose epithelium; C, very few large cells.10 The embryo grades were categorized into 4 groups according to their morphologic grading before TE biopsy: Excellent (E; Expanded AA, Hatching AA, Hatched AA), Good (G; Early AA, Mid AA, Expanded AB, BA, Hatching AB, BA, Hatched AB, BA), Fair (F; Early AB, BA, Mid AB, AC, BA, BB, Expanded AC, BB, CA, Hatching AC, BB, CA, Hatched AC, BB, CA), and Poor (P; Early AC, BB, BC, CA, CB, CC, Mid BC, CA,CB CC, Expanded BC, CB, CC, hatching BC, CB CC, Hatched BC, CB CC).
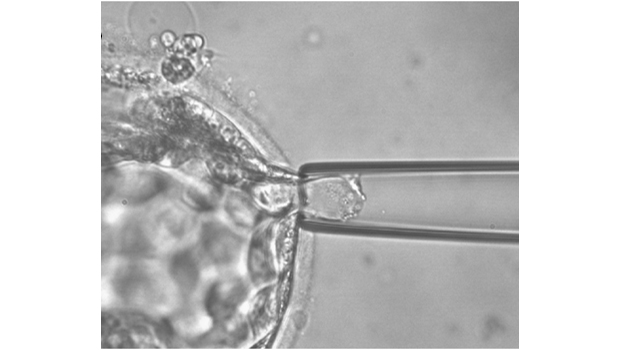
All embryos were biopsied on day 5, during their blastocyst stages. TE biopsy was done from blastocysts that were cultured after conventional IVF or intracytoplasmic sperm injection (ICSI) using a pair of micromanipulators (NT-88; Narishige, Tokyo, Japan) with microscope (TE-2000; Nikon, Tokyo, Japan). The culture media consisted of G-PGD (Vitrolife, Göteborg, Sweden) with 5% HSA-solution (Vitrolife). For TE biopsy, the embryos were immobilized with a holding pipette (left side), and the zona pellucida was perforated using laser pulses ZILOS-tk noncontact laser (Hamilton Thorne Biosciences, Beverly, MA, USA). Using the right side biopsy pipette, gentle suction of TE cells was done through the zona pellucida perforation. The cells were eventually separated out of the zona pellucida (Fig. 2). The biopsied TE cells were washed with D-phosphate-buffered saline (D-PBS; Ca2+ and Mg2+-removed) and contained in RNase–DNase-free 0.2 mL polymerase chain reaction (PCR) tubes for PGS referral to MG-MED Inc. (Seoul, Korea). The biopsied blastocysts were then cultured in sterile oil-covered media at 37°C, 6% CO2, 6% O2, and observations at 24–48 hour-interval was done to check development of the embryos.
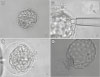
Fig. 2
The process of blastocyst biopsy. (A) Expanded blastocyst (magnification ×200). (B) TE cells were separated by biopsy pipette (magnification ×400). Arrow indicates biopsied TE cells. (C) Shrunk blastocyst appears after TE biopsy (magnification ×400). (D) Following further incubation for 24 hours after biopsy, the blastocyst undergoes a process of expansion and hatching from the zona pellucida (magnification ×200).
TE = trophectoderm.
PGS (aCGH) protocol
The biopsied cells were washed and collected into a PCR tube with 2.5 μL of PBS. Extraction and amplification of the DNA from the biopsied cells were performed according to the MG Flex single cell whole genome amplification kit system protocol (MG Flex; MGMED, Seoul, Korea). Approximately 3 μg of amplified DNA was used in the aCGH experiments (MGMED). Briefly, the amplified DNA was labeled with Cy-3 and Cy-5 dCTP for 3 hours using a random priming method. The labeled DNA was purified, dissolved in hybridization buffer, and hybridized overnight. The slides were washed several times and dried. Images of the slides were acquired with a GenePix4000B dual-laser scanner (Axon Instruments, Union City, CA, USA) and analyzed with MG Viewer analysis software (MGMED).
Statistical analysis
Continuous data are expressed as mean ± standard deviation, and categorical variables are in absolute and percentage frequency. Pearson's χ2 test, Fisher's exact test, student's t-test, and Mann-Whitney test were used for statistical analysis. A P value < 0.05 was considered statistically significant and the statistical analysis was performed with SPSS ver.23 (IBM, Armonk, NY, USA).
RESULTS
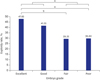
Baseline characteristics of the patients are described in Table 1. The number of developed blastocysts is 676 embryos in 136 cycles and actual number of embryos that underwent PGS is 444 embryos. PGS was done on all blastocysts that have developed in fresh ET cycles, but in frozen ET cycles, mostly only 2–3 embryos (maximum 5) per cycle were thawed and underwent PGS. Therefore, other 232 embryos were left frozen without PGS. For this reason, the number of developed blastocysts (676 embryos) and actual number of embryos that underwent PGS (444 embryos) is different. Total of 136 cycles which contain 444 PGS-blastocysts were included (Fig. 1). Among the total 444 blastocysts, there were 153 euploid blastocysts that were analyzed by PGS (34.46%) in Table 1. The euploid embryos were categorized into 4 groups according to their morphological grades and the euploidy rates are as follows: E (n = 33/69; 47.82%), G (n = 32/77; 41.55%), F (n = 22/75; 29.33%), and P (n = 66/223; 29.60%) in Table 2 and Fig. 3. The E group had significantly higher rate of euploid embryos than group F (P = 0.023) and group P (P < 0.01) in Table 2 and Fig. 3. However, the difference between groups E and G was without statistical significance (P = 0.448) in Table 2 and Fig. 3. When the four groups were recategorized into two groups (E and G vs. F and P), they also showed significant difference in euploidy rates (P = 0.002) (Fig. 3).
Table 2
Correlation between the human blastocyst morphological evaluations and their euploidy rates

Fig. 3
Correlations between morphologic grades and euploidy rates. The excellent group had significantly higher rate of euploid embryos than group fair (P = 0.023) and group poor (P = 0.005). However, the difference between groups excellent and good was without statistical significance (P = 0.448). When the four groups were recategorized into two groups (excellent and good vs. fair and poor), they also showed significant difference in euploidy rates (P = 0.002).
aP < 0.01;bP < 0.05.
In Table 2, when the embryos were divided by their degrees of blastocoel expansion, the euploidy rates showed a tendency to increase as the level of blastocoel expansion progressed, except the hatched group. However, there was no significant difference when compared to hatched degree since the number of hatched embryos were too small for statistical analysis. Therefore, we only compared the hatching group with Expanded, Mid and Early groups, excluding the hatched group in Table 2. ICM grades showed significant difference for the euploidy rates between A grade and C grade (P = 0.022). The TE grades were also significantly different between A grade and lower quality grade such as B and C (P < 0.05).
Only total of 84 cycles that have euploid embryos proceeded with ET and remaining 52 out of 136 cycles did not undergo ET due to no euploid embryos available (Fig. 1). When the 84 cycles were divided into two groups by age 35 (Table 3), the clinical pregnancy (CP) rate for those under 35 was 44.74% and 47.83% for those over 35 years old, which showed no significant difference. The implantation rate and ongoing pregnancy rate also showed no significant difference between the age groups. Miscarriages were noted only from the older age group (31.82%) and none from those under 35 years old.
Table 3
Comparisons of IVF outcomes between young and old age groups after PGS (Total of 84 cycles)
Values are presented as mean ± standard deviation (SD) or number (%).
IVF = in vitro fertilization, PGS = preimplantation genetic screening, BMI = body mass index, NS = not significant, AMH = anti-Mullerian hormone, FSH = follicle stimulating hormone, LH = luteinizing hormone, E2 = estradiol, hCG = human choriogonadotropin, ICM = inner cell mass, TE = trophectoderm, ICSI = intracytoplasmic sperm injection, CP = clinical pregnancy.
Multiple logistic regression analysis was done to find out which is the most influential morphologic grading factor that impacts euploidy status of the embryo (Table 4). Among the three grading factors, the blastocoel expansion grade was the most influential (odds ratio, 1.261; P = 0.045).
Table 4
Multiple logistic regression analysis of the correlation between morphologic grading and euploidy status

| Variables | Euploidy status | |
|---|---|---|
| OR (95% CI) | P value | |
| Morphologic grading | 1.314 (1.109–1.557) | < 0.01 |
| Expansion | 1.261 (1.005–1.582) | 0.045 |
| ICM | 1.003 (0.654–1.537) | 0.989 |
| TE | 1.335 (0.809–2.205) | 0.258 |
DISCUSSION
To summarize, the present study described the correlations between blastocyst morphologic grades and their euploidy rates. As the morphologic grades get better, the euploidy rates also increase. Among the morphologic grading criteria, all three parameters, such as the blastocoel expansion grade, ICM grade, and TE grade were relevant to euploidy rates. The embryos express their own genes after the third day of fertilization and their potential genetic abnormalities will result in embryo maldevelopment, which causes the lower morphologic grade of embryos.1112 Lastly, the different age groups by age 35 did not show much difference in CP and ongoing pregnancy rates, suggesting that the PGS may be more useful for older women, over 35 years old with poorer chances of pregnancy.
Assessing the embryo morphology has been the classic tool for selecting the embryos for intra-uterine transfer. However, not all embryos with the best morphologic grade match the euploid status as this study demonstrated about 52% of excellent blastocysts being aneuploid and in contrast, about 30% of poor grades being euploid. Previous studies also showed that several aneuploid embryos scored high morphologically.111314 This emphasizes that it may be hazardous to select embryos solely by morphological assessment and underlines the importance of utilizing PGS for best embryo selection.
PGS methods have evolved continuously throughout the past decades. To mention the aspect of biopsy methods, cleavage stage biopsy was first utilized. However, Fragouli et al.12 demonstrated that PGS biopsy during cleavage stage showed high rates of aneuploidy even in reproductively younger women (73% for average 33.6 years of women's age). Other studies also reported similar results.151617 This phenomenon might be attributed to the sperm-derived men's meiotic errors, oocyte abnormalities and post-zygotic chromosome malsegregation during mitosis.18 On the other hand, blastocyst biopsy has improved the chances of selecting euploid embryos among the top morphology-scored embryos.12 TE biopsy has been the preferred method due to its extraembryonic origin rather than ICM which develops into embryo itself. It is also known to predict the ICM karyotype status without impairing the embryonic implantation.19 Alfarawati et al.11 described that declining TE grades was correlated with increasing aneuploidy rates. Furthermore, the study by Minasi et al.20 reported that euploid blastocysts showed a higher percentage of top grade ICM and TE, higher blastocoel expansion grades and shorter time to beginning of blastulation, expansion, and hatching, compared to aneuploid blastocysts. Another recent study demonstrated that embryos with higher grade of blastocyst expansion, ICM and TE had greater chances of being euploid.21 All these data underlines our result showing correlations between blastocyst morphology and euploidy rates on blastocyst stage.
PGS has been debated in terms of clinical efficiency. Not only it is imperfect as errors may occur, it may also burden patients with extra costs. Moreover, the incidence of mitotic mosaicism is not known, which can result in sampling errors. Therefore, it is unavoidable that some of normal embryos will be thrown away. Paulson22 presented an estimation of normal embryos lost due to PGS as high as 40% and 50% of the remaining embryos achieving implantation. A recent study also demonstrated that PGS for women under 40 years of age at their first IVF attempt is unlikely to be beneficial for most women.23 But, on the contrary, Harton et al.24 showed that implantation and pregnancy rates were not significantly different between reproductively younger and older patients by selective transfer of euploid embryos, and also describes that chromosome screening was able to decrease the maternal age effect in pregnancy. Since older patients had greater risks of developing aneuploid embryos, PGS sorting out euploid embryos for transfer may significantly increase the chances of pregnancy. Another study by Kang et al.25 demonstrates that only the women older than 37 years old benefitted from PGS, having improved implantation rates and live birth rates. Therefore, PGS might be useful to improve the IVF outcomes in older aged patients, which is similar to the result of this study.
There are some limitations in this study. The selection bias might have affected our results. In Table 3, the miscarriage rate in old age group (≥ 35 years old) is 31.82%, which is rather high. But, the unexpected high miscarriage rate could be attributed to selection bias. Significant number of patients with history of recurrent pregnancy loss might be included in this study. Also, the retrospective nature of this study also remains as a limitation. The present study's patient group with over 35 years of age had relatively good ovarian reserve (mean level of anti-Mullerian hormone [AMH], 4.18 ng/mL in Table 3), and it is probably because patients aged 35 or older who can produce more number of embryos are more feasible to undergo PGS. Many patients over 35 years of age who have decreased ovarian reserve undergo IVF treatment. In order to perform PGS for patients over 35 years of age who have decreased ovarian reserve, we need to collect their small number of embryos several times using embryo cryopreservation, and better start PGS when there are enough embryos to be evaluated. These procedures take much longer time and were not appropriate for retrospective short term follow-up study like this. Further prospective long-term studies including more number of patients with decreased ovarian reserve should be performed to analyze the cost-effectiveness of PGS for older patients.
In conclusion, the different age groups by age 35 did not show much difference in CP rates and ongoing pregnancy rates, suggesting that the PGS may be more useful for older women who are over 35 years old with poorer chances of pregnancy.
 XML Download