

 PDF
PDF Citation
 Print
Print


INTRODUCTION
Information on health indicators in small geographical areas may provide better opportunities to address specific local health problems among the most vulnerable populations. More accurate methods for measuring diseases, exposures, behaviors, and other health measures could facilitate better assessments of population health and the development of policies and targeted programs for preventing disease.1 In Korea, the Seventh District Healthcare Plan that every local district government must set up by law requires information on health indicators stratified by income and geography.2 However, there is a paucity of information on health indicators at the town (eup/myeon/dong) level in Korea.
In some previous studies, eup/myeon/dong areas, the smallest administrative units in Korea, were used as the unit of analysis for calculating mortality in Korea by geographical area.3456 However, those studies only provided town-level mortality within a city3 or for both men and women combined45, mainly due to limitations of the data used in those studies.
The National Health Information Database (NHID) is considered to be a data source suitable for monitoring mortality at the town level. The NHID utilizes data from the National Health Insurance Service (NHIS), which covers the entire Korean population.7 The eligibility database of the NHID includes information on the gender, age, residential area, and death status of all people enrolled in the national health insurance program.7 Also, various health and medical information can be obtained through linkage with other databases of the NHIS.7 A previous study showed that the NHID could be used to estimate mortality and life expectancy at the national, provincial, and district levels.8 However, it has not yet been explored whether the NHID can be used for calculating mortality or life expectancy at the town level.
The purpose of this study was to examine the feasibility of estimating town-level mortality using the NHID. We compared town-level mortality rates based on the NHID with those derived from the National Administrative Data (NAD) of the Ministry of Interior and Safety (MOIS), which constitutes the official national database on vital and internal migration statistics. In this study, we first compared the overall numbers of population and deaths between the NHID and NAD during the study period. Second, we compared the distribution of town-level numbers of population and deaths between the two data sets. Third, correlation analyses were conducted of the numbers of population and deaths, the crude mortality rate, and the standardized mortality ratio (SMR) between the NHID and NAD.
METHODS
Data
In this study, we used the NHID and the NAD provided by the MOIS in 2014–2017. All subjects present on January 1 of each year in the NHID eligibility data were followed up for one year. The numbers of population and deaths by year, gender, 5-year age group (0, 1–4, 5–9, 10–14, …, 85+), and eup/myeon/dong were obtained. The data set includes both the beneficiaries of the national health insurance and medical aid programs. We excluded foreigners and cases where a subject's gender, age, or address was not known. The NAD is based on the resident registration statistics provided on the MOIS website, which provides figures since 2008.9 The number of registered residents in the current year was obtained in aggregated form according to gender, 5-year age group (0, 1–4, 5–9, 10–14, …, 85+), and eup/myeon/dong at the end of December of the previous year. The number of deaths was calculated annually by gender and eup/myeon/dong. The study period was limited to 2014–2017 because the numbers of deaths in the NAD were not provided separately for men and women between 2008 and 2014.
Unit of analysis
The unit of analysis in this study was eup/myeon/dong, categorized according to the administrative unit classification as of December 31, 2017 of the Korean Administrative Unit Classification issued by the Statistical Policy Bureau of Statistics Korea.10 However, eight towns (Gunnae-myeon, Jangdan-myeon, Jinseo-myeon in Paju, Gyeonggi and Geundong-myeon, Wondong-myeon, Wonnam-myeon, Imnam-myeon in Cheorwon-gun, Gangwon and Sudong-myeon in Goseong-gun, Gangwon), which are civilian access control areas (for military purposes), were excluded from the analysis. Besides, 26 towns with an average annual population of fewer than 500 persons were integrated with neighboring areas to ensure stable mortality calculations.11 Towns that were divided or merged during the study period were consolidated into a single unit. Ultimately, a total of 3,431 towns across the nation were analyzed.
Statistical analysis
First, we compared the national-level numbers of population and deaths according to the calendar year and gender between the NHID and NAD. Second, the distribution of the town-level numbers of population and deaths between the two data sets was compared according to year and gender during the whole study period. Third, we analyzed the correlations between the NHID and NAD for the town-level numbers of population and deaths, crude mortality rate, and SMR throughout the entire study period. The crude mortality was defined as the number of deaths per 100,000 population. SMR is a mortality measure derived from an indirect standardization method that can be used when the number of deaths by age group is unknown, or the number of deaths is tiny.12 This method is considered suitable for measuring differences in health status between small areas.13 The standard population in the SMR calculation was the total population of the data set.
RESULTS
Table 1 shows the national-level numbers of population and deaths in the two data sets according to the calendar year and gender for the entire study period. When the data for the entire study period were combined, the resulting total number of population was 203,741,630 in the NHID, which was nearly identical to the corresponding figure of 203,748,512 in the NAD. The NHID recorded 1,101,739 men and women deaths in 2014–2017, 0.7% less than the 1,109,705 deaths recorded in the NAD for the same period. When comparing the two data sets by year, the population numbers were almost the same, and the number of deaths was 0.1%–1.3% less in the NHID than in the NAD. This tendency was similar when men and women were separately examined.
Table 1
Comparison of numbers of population and deaths at the national level between the NHID of the NHIS and NAD of the Ministry of Interior and Safety, 2014–2017

Table 2 shows the distribution of the town-level numbers of population and deaths in the two data sets for the entire study period and each year. During the entire study period, for both men and women, the median population number from the NHID was 44,680 (interquartile range [IQR], 73,004), which was similar to the median population number of 44,661 (IQR, 72,964) from the NAD. The minimum and maximum values were 4,092 and 476,523, respectively, in the NHID, which were also similar to the corresponding values of 4,093 and 476,375 in the NAD. The median number of deaths in the NHID was 280 (IQR, 229), which was also nearly identical to the value obtained using the NAD, and the minimum and maximum values were not significantly different. This was also true when analyzed by year, gender, or both year and gender. Supplementary Figs. 1 and 2 depict graphical representations of the very similar distribution of the town-level numbers of population and deaths for the whole study period between the two data sets.
Table 2
Distribution of numbers of population and deaths among 3,431 towns in Korea: findings from the NHID of the NHIS and the (NAD of the Ministry of Interior and Safety, 2014–2017

Table 3 shows the results of the correlation analysis between the NHID and NAD for the numbers of population and deaths, crude mortality, and SMR throughout the study period. In both gender, the Pearson correlation coefficient was 1.000 for the number of population, and 0.998 for the number of deaths and crude mortality, respectively. The same findings were obtained in a sub-analysis by gender. The Pearson correlation coefficient of the SMR was 0.960 for men and women combined, 0.972 for men, and 0.937 for women.
Table 3
Results of the correlation analysis between the number of population and deaths, crude mortality rate, and SMR according to gender: findings from the NHID of the NHIS and the NAD of the Ministry of Interior and Safety, 2014–2017

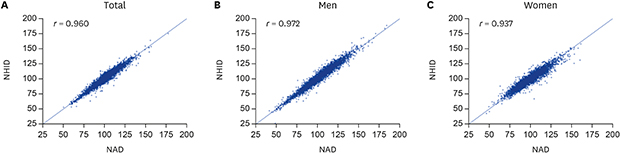
Fig. 1 presents the scatter plots and correlation coefficients of the town-level crude mortality of the two data sets according to gender throughout the study period. Regardless of gender, the town-level crude mortality of the two data sets showed an almost perfect correlation (a 45° diagonal line) for almost all towns, implying that the crude mortality rates from the NHID and NAD were nearly identical. Fig. 2 shows the scatter plots and correlation coefficients of the town-level SMR from the NHID and NAD according to gender throughout the study period. Overall, the town-level SMRs of the two data sets were relatively more different than the crude mortality rates, but most showed a close relationship. Supplementary Figs. 3 and 4 show the scatter plots and correlation coefficients of the town-level numbers of population and deaths according to gender throughout the study period. As for crude mortality and SMR, the town-level numbers of population and deaths in both data sets were almost on the 45° diagonal line, regardless of gender.
Fig. 1
Scatter plots and Pearson correlation coefficients [r] of town-level crude mortality from the NHID of the National Health Insurance Service and the NAD of the Ministry of the Interior and Safety among 3,431 towns in Korea, 2014–2017. (A) Correlation of crude mortality in both men and women combined. (B) Correlation of crude mortality in men. (C) Correlation of crude mortality in women.
NAD = National Administrative Data, NHID = National Health Information Database.
Fig. 2
Scatter plots and Pearson correlation coefficients [r] of the town-level SMR from the NHID of the National Health Insurance Service and the NAD of the Ministry of the Interior and Safety among 3,431 towns in Korea, 2014–2017. (A) Correlation of the SMR in both men and women combined. (B) Correlation of the SMR in men. (C) Correlation of the SMR in women.
SMR = standardized mortality ratio, NAD = National Administrative Data, NHID = National Health Information Database.
DISCUSSION
In this study, the NHID from the NHIS and the NAD from the MOIS showed similar numbers of population and deaths at the national level. In particular, the number of population in the two data sets was approximately the same. The distribution of the number of population and the number of deaths at the town level was also similar between the two data sets. The Pearson correlation coefficients of the town-level numbers of population, numbers of deaths, and crude mortality from the NHID and NAD pooled over the entire study period were 0.996 or over. The Pearson correlation coefficient of the SMR ranged from 0.937 to 0.972.
Bahk et al.8 reported that crude mortality and life expectancy at the national, provincial, and municipal levels estimated using the NHID were highly correlated and concordant with data from the Korean Statistical Information Service (KOSIS). Regardless of gender, the national-level crude mortality of the NHID was 0.99 fold the KOSIS data. The concordance correlation coefficient of crude mortality at the municipal level of the two data sets ranged from 0.997 to 0.999, and that of life expectancy was 0.914 to 0.990 depending on the period and gender. This study showed that the NHID presented very similar results to the NAD of the MOIS, in addition to its high level of similarity with the KOSIS data. It has also been found that the NHID is useful for estimating regional mortality rates not only at the national, provincial, and municipal levels but also at the level of towns.8
The NHID has several strengths over the NAD. First of all, the NAD only provides total numbers of death while the NHID provides age-specific numbers of deaths. Using the NAD data, mortality rates in each town can be derived only by the indirect standardization method while both direct and indirect standardization methods can be applied to the NHID data. Town-level life expectancy can be also calculated using age-specific mortality rates from the NHID. Second, the NHID provides information on the numbers of death according to individual linkage to mortality registration data from Statistics Korea, using unique personal identification numbers. However, the numbers of death in the NAD are aggregate data which are not based on individual linkage. Numerator-denominator bias in the calculation of town-level mortality rate would be an unresolved problem in the NAD. Finally, the NHID contains various health indicators. If the NHID is accepted as a reliable source for town-level health indicators, many health indicators could be produced and used in the future.
The correlation coefficients of the town-level crude mortality rates and SMRs between the NHID and NAD were very high, but the magnitudes of the correlation coefficients for the SMRs were smaller than those of the crude mortality rates. The tendency was particularly evident in women. The SMR is calculated by dividing the actual number of deaths by the number of expected deaths in each region. The number of expected deaths is estimated by multiplying the nationwide average age-specific mortality rate by the age-specific population in each region. Therefore, even if a small absolute difference in the number of deaths exists between the two data sets, the difference in the SMR can be relatively large compared to the difference in the crude mortality rate.
This study has limitations. First, the MOIS only provides the combined number of deaths for both gender in the data from 2008 to 2013, while the number of deaths for each gender is only available starting in the 2014 data. Therefore, the period of this study was limited to 2014 and later. The results of correlation analysis for both gender combined for the four years from 2010 to 2013 are shown in Supplementary Table 1. The results for the years 2010–2013 were very similar to the results for the years 2014–2017. Second, there is uncertainty about the validity of using the SMR to measure mortality, as was explored in this study. Some studies have shown that a significant difference in SMR could occur if the structures of two study populations are significantly different.1415 However, the town-level population by 5-year age groups in the two data sets was entirely consistent. When we compared the number of population, and the population proportion by 5-year age group between the two data sets used in this study, the concordance correlation coefficient in all age groups was above 0.999.
In this study, the town-level mortality calculated using the NHID of the NHIS was found to be nearly identical to and highly correlated with the town-level mortality obtained using the NAD of the MOIS. This result shows that the NHID can be used to estimate town-level mortality in Korea in the future. It is necessary to monitor the health status of each eup/myeon/dong in Korea through the SMR and life expectancy calculated using the NHID. In addition, if the NHID is considered as a reliable source for town-level health indicators other than mortality rates, many health indicators can be produced and used in the future.
 XML Download