

 PDF
PDF Citation
 Print
Print


INTRODUCTION
Iron accumulation in the brain increases with age in the substantia nigra (SN), putamen (PU), globus pallidus (GP), caudate nucleus (CN), and cortex.1 The accumulation is greater in patients with Parkinson's disease (PD) who exhibit widespread neurodegeneration in the basal ganglia (BG). Neuropathological studies have revealed that iron concentrations are increased in the SN pars compacta (SNc) and reticulata (SNr) in patients with PD.23 Although the mechanisms underlying the increased accumulation of iron in patients with PD are unclear, researchers have used various methods to measure the in vivo levels of iron accumulation.1
Iron deposits in the deep nuclei of the brain influence regional magnetic susceptibility, which can be detected with brain magnetic resonance imaging (MRI).4 Previous studies using brain MRI in patients with PD have measured the transverse relaxation rates (R2 and R2*) and revealed that R2* was increased in the SNc and related to motor severity.56 Longitudinal studies have suggested that R2* values increase with PD progression.789 However, R2* is limited because it cannot exclude the magnetic susceptibility of the surrounding tissue. To solve this problem, a new method, quantitative susceptibility mapping (QSM), was developed.
Studies that have used QSM to measure iron accumulation in patients with PD have found that magnetic susceptibility was increased in the SNc compared with that in healthy controls,10111213141516 and these increases were also found in patients in the early stage of PD.111316 Several studies have also found increased susceptibility in the GP, red nucleus (RN), and thalamus of patients with PD.101116 As expected, QSM measures are more precise than R2*.121314 The QSM values in the SNc of patients with PD increase with disease duration1216 and correlate with disease severity.101216 In addition, QSM values are increased in the dentate nucleus (DN) in patients with the tremor dominant subtype of PD.17 A recent study reported that the Movement Disorder Society-sponsored revision of the Unified PD Rating Scale (MDS-UPDRS) Part I (non-motor experiences in daily life) scores positively correlated with magnetic susceptibility in the GP, CN, SN, and PU.10
Interest is increasing in the non-motor symptoms (NMSs) of patients with PD.1819 Some NMSs precede the motor symptoms and would be used for diagnosis of early or prodromal stage of PD. Furthermore, several early NMSs are related to the prognosis of the patients with PD.20 However, because few studies have evaluated the relationships of the in vivo pathology and NMSs, the current understanding of the pathophysiology of NMSs depends on indirect anatomic correlations from post-mortem pathology studies.21 Based on neuroanatomic knowledge, NMSs originate from various brain lesions beyond the motor circuit in the BG.21 Hyposmia is related to the anterior olfactory nucleus; depression and sleep disorders are related to the pontine nuclei such as the locus ceruleus, raphe, lateral tegmental nuclei; executive, emotional, and behavior problems are related to the nucleus basalis Meynert and amygdala; dementia and psychosis are related to the neocortex. According to the current pathologic staging system for PD, the more extensive pathologic changes exist, the severer pathology can be found.22 Therefore, patients with more NMSs probably have more extensive and severe pathology in the brain.
In this study, we assumed that wider iron accumulation, which reflects pathologic changes, would be observed in the brain of patients with more NMSs. To prove this hypothesis, we examined the relationship between NMSs and iron accumulation in the deep nuclei, which was measured with QSM, in patients with PD.
METHODS
Patients and clinical assessments
Participants eligible for this study were patients who were diagnosed with PD and who underwent brain MRI within 5 years of the onset of motor symptoms at the Seoul Nation University-Seoul Metropolitan Government (SNU-SMG) Boramae Medical Center. The diagnosis of PD was confirmed by movement disorder specialists using the UK brain bank clinical diagnosis criteria.23 Patients with other neurodegenerative diseases or secondary brain lesions were excluded. Control candidates were selected from the brain MRI database of the SNU-SMG Boramae Medical Center. Individuals with a history of neurological diseases or abnormalities on brain MRI were excluded from the control group.
The clinical data were acquired with retrospective reviews of medical records. The demographic data included sex, age at acquisition of brain MRI, and age at the onset of motor symptoms. Disease duration was defined as the time from the age at the onset of motor symptoms to the age at acquisition of brain MRI. The severity of PD was evaluated with the Hoehn and Yahr (HY) stage, and MDS-UPDRS part III scores24 that were evaluated within 1 month of the acquisition of brain MRI. The levodopa-equivalent daily dose (LEDD) was calculated by reviewing the medication history of each patient.25 The NMS burden of the patients were evaluated using the Korean version of the NMS scale (K-NMSS).26 The patients were further divided into a high NMS group and low NMS group according to the cut-off value of 20 in K-NMSS. This value was adopted from the comprehensive grading system of NMS severity in PD,27 in which the value discriminates mild vs. more severe NMS burden in patients with PD.
MRI protocol and data reconstruction
All patients were scanned with 3-Tesla brain MRI (Achieva 3.0T; Koninklijke Philips N.V., Amsterdam, the Netherlands) using an 8-channel head coil. All scans were in the axial plane. A three-dimensional single gradient-echo sequence was acquired; the parameters were the following: echo time = 25.7–28.5 ms; repetition time = 18.2–20.0 ms; field of view = 200 × 200 mm2; matrix = 256 × 256; slice thickness = 2 mm, no gap; and flip angle = 10°. The voxel size was same (0.390625, 0.390625, 2) for all subjects. The entire slices of 3D scan data were reconstructed in QSM images using a susceptibility tensor imaging software suite (version 2.2, Updated on Jan. 8, 2014; Brain Imaging & Analysis Center, Durham, NC, USA).428 All other parameters which are required for the calculation of susceptibility were the same; Tol_LSQR was 0.01, D2_thres was 0.1, and Max_iter was 100.
Region-of-interest analysis
The region-of-interest (ROIs) were manually segmented on the reconstructed QSM images by one investigator using ITK-SNAP (www.itksnap.org).29 No normalization on the brain size was done. The targeted deep nuclei were the following: SNc, SNr, RN, GP, DN, PU, and head of the CN (HCN, Fig 1). The ROIs were drawn on the slices that covered the SNc, SNr, RN, and DN. We selected the 2–5 most representative slices of the GP, HCN, and PU to minimize the influence of the surrounding structures due to unclear margins. The QSM values of deep nuclei of the patients and controls were calculated separately by averaging the values of selected ROIs.
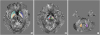
Fig. 1
Representative image of quantitative susceptibility mapping (QSM) with color overlay of the deep nuclei in the region-of-interest segmentation in a 64-year-old female patient with Parkinson's disease. (A) Axial section at the level of the basal ganglia showing the head of the caudate, putamen, and globus pallidus. (B) Axial section at the level of the midbrain showing the substantia nigra pars compacta, substantia nigra pars reticulata, and red nucleus. (C) Axial section at the level of the cerebellum showing the dentate nucleus.
Statistical analyses
All statistical analyses were performed with SPSS (version 21.0; IBM Corporation, Armonk, NY, USA). Non-parametric tests (Fisher's exact and Kruskal-Wallis tests) were used to compare the demographics of the patients with high and low NMS scores and controls. Mann-Whitney U tests were used to compare the clinical data between the patients with high and low NMS scores. The QSM susceptibility value in each ipsilateral and contralateral deep nucleus to the dominant side of motor symptoms of the patients was compared with mean QSM value of left and right deep nuclei of controls with Kruskal-Wallis tests. Bonferroni correction was used for multiple comparison (P value threshold = 0.025). The Pearson's partial correlation analyses adjusting the age at acquisition of brain MRI were performed to evaluate the linear correlations between the clinical characteristics and QSM data in the entire patient group. Two-tailed P values less than 0.05 were considered statistically significant.
RESULTS
Clinical data comparisons
The detailed clinical characteristics are presented in Table 1 (see supplemental data for individual clinical and QSM data; Supplementary Tables 1 and 2). The percentage of males and age at acquisition of brain MRI did not differ among the patients with high and low NMS scores and controls. The patients with high and low NMS scores did not differ in the age at the onset of motor symptoms, disease duration, HY stage, MDS-UPDRS III score, and LEDDs.
Table 1
Clinical characteristics of the patients and controls
Data not otherwise specified are presented as mean ± standard deviation. Data are presented as percentage (frequency) or median (minimum, maximum).
NMS = non-motor symptom, MRI = magnetic resonance imaging, HY = Hoehn and Yahr, LEDD = levodopa-equivalent daily dose, MDS-UPDRS = Movement Disorder Society-sponsored Unified Parkinson Disease Rating Scale, K-NMSS = Korean version of the Non-motor Symptoms Scale.
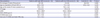
The comparisons of the scores for each item on the K-NMSS between the patients with high and low NMS scores are presented in Table 2. Patients with high NMS scores had higher scores for dizziness, fatigue, difficulty falling asleep, restless legs, nervous feeling, urinary urgency, frequency, nocturia, and weight change.
Table 2
Detailed comparisons of the patients with high and low K-NMSS scores
ROI analysis results
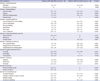
The regional QSM values were compared among the patients with high and low NMS scores and controls (Table 3). There were no significant differences in the QSM values of all deep nuclei among the patients with high and low NMS scores and controls.
Table 3
Regional differences in the susceptibility values in patients with PD and controls
Data are presented as mean ± standard deviation.
PD = Parkinson's disease, NMS = non-motor symptom, RN = red nucleus, SNc = substantia nigra pars compacta, SNr = substantia nigra pars reticulata, DN = dentate nucleus, GP = globus pallidus, PU = putamen, HCN = head of the caudate nucleus.
aThe Kruskal-Wallis test with Bonferroni correction was used to test for statistical significance. Uncorrected P value was presented.
QSM and clinical data correlations
In the partial correlation analyses adjusting the age at acquisition of brain MRI, LEDD was correlated linearly with the QSM values of ipsilateral SNc (r = −0.426; P value = 0.024) and ipsilateral SNr (r = −0.518; P value = 0.005). Disease duration, HY stage, MDS-UPDRS part III score, and K-NMSS total score were not correlated with regional QSM values.
DISCUSSION
This study was the first study that evaluated the relationship between NMSs and regional iron accumulation in PD using a detailed NMS questionnaire and QSM. In contrast with our hypothesis, the QSM values in deep nuclei of the patients with PD, including SNc, were not different from the values of the controls. The QSM values of ipsilateral SNc and SNr were negatively correlated with LEDD.
Several possible reasons may explain these results. First, it can be assumed that different pathologies, which are not confined to the deep nuclei in this study, resulted in NMSs of patients with PD. This is consistent with a previous study that evaluated the relationship between the striatal dopamine level and NMS burden.30 Second, most of the patients who participated in this study had a very early stage of PD, hence the NMS burden was not severe. As a result, the pathological changes in the brain associated with this NMS burden may not be evident. Finally, the K-NMSS is a collection of heterogeneous NMSs possibly originated from various brain regions. The definition of NMS burden in this study is a clinically meaningful distinction27 but a simple sum without consideration of the heterogeneous nature of K-NMSS. Therefore, the association with the iron accumulation in a specific region of the brain may not be properly reflected. Neuroimaging studies on the brain pathology of NMSs in the future would be better to use specific and detailed clinical evaluation tools rather than K-NMSS.
In contrast with previous studies, the QSM values in the SNc were not increased in patients with early PD.111316 The mean disease durations of the patients with high and low NMS scores in our study were 1.9 years and 1.0 years, respectively, which is much shorter than those reported in previous studies (mean 2.7–4.6 years).111316 Therefore, the patients selected in this study were a purer group of patients with very early stage of PD than those recruited in previous studies. On the other hands, the small number of participants in this study might have resulted in the inability to find statistical differences. For example, the QSM value in the contralateral SNc showed a tendency to be increased in the patients compared with the controls. Taken together, these observations suggest that the diagnostic accuracy of the QSM values in patients in the very early or prodromal stage of PD needs to be verified in large numbers of patients.
This study had several limitations. First, the generalization of our results is limited because inferential statistics were not used due to the small number of participants. Second, the ROIs were not drawn by independent investigators, and the reliability and reproducibility of the ROI analysis were not confirmed in this study. Third, the diagnosis of PD was based on clinical criteria without pathologic confirmation,23 hence the QSM results would be influenced. Forth, the interval from K-NMSS to the acquisition of brain MRI was not consistent in patients, which may confound the correlation. Finally, the controls were not evaluated by a neurologist, and unknown neurodegenerative diseases could be present in the control group.
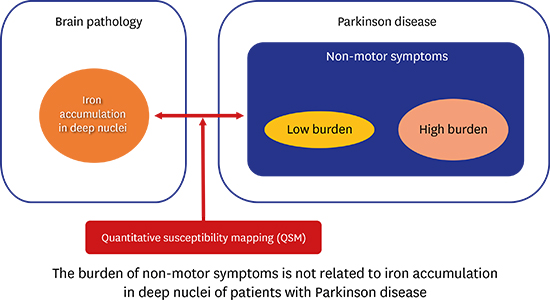
In conclusion, the study demonstrated that the NMS burdens are not associated with iron accumulation in the deep nuclei of patients with PD. These results suggest that future neuroimaging studies on the pathology of NMSs in PD should use more specific and detailed clinical tools and recruit PD patients with severe NMSs.
 XML Download