Journal List > J Korean Med Sci > v.33(9) > 1107731

Rim, Lee, Kim, Yang, Yoon, Koom, and Kim: A Survey of Radiation Therapy Utilization in Korea from 2010 to 2016: Focusing on Use of Intensity-Modulated Radiation Therapy

Abstract

Background

This study aimed to assess the recent changes of radiation therapy (RT) modalities in Korea. In particular, we focused on intensity-modulated radiation therapy (IMRT) utilization as the main index, presenting the application status of advanced RT.

Methods

We collected information from the Korean Health and Insurance Review and Assessment Service data based on the National Health Insurance Service claims and reimbursements records by using treatment codes from 2010 to 2016. We classified locating region of each institution as capital vs. non-capital areas and metropolitan vs. non-metropolitan areas to assess the regional difference in IMRT utilization in Korea.

Results

IMRT use has been steadily increased in Korea, with an annual increase estimate (AIE) of 37.9% from 2011 to 2016 (P < 0.001) resulting in IMRT being the second most common RT modality following three-dimensional conformal radiotherapy. In general, an increasing trend of IMRT utilization was observed, regardless of the region. The rate of AIE in the capital areas or metropolitan areas was higher than that in non-capital areas or non-metropolitan areas (40.7% vs. 31.9%; P < 0.001 and 39.7% vs. 29.4%; P < 0.001, respectively).

Discussion

The result of our survey showed that IMRT has become one of the most common RT modalities. IMRT is becoming popular in both metropolitan and non-metropolitan areas, while metropolitan area has faster AIE possibly due to concentration of medical resources and movement of advanced patients.

Graphical Abstract

jkms-33-e67-abf001.jpg

INTRODUCTION

The techniques of radiation therapy (RT) have rapidly progressed in the recent decades. Among the most remarkable techniques is intensity-modulated radiation therapy (IMRT), which uses advanced planning software and the dynamic multileaf collimator to produce a highly conformal plan.1 The superior target conformality of IMRT enables dose escalation to tumor, which results in better tumor control without an increase of treatment-related toxicity.23 Better quality of life and lower treatment-related toxicity were reported among patients who received IMRT than those who received other RT treatment.456789
In Korea, cancer incidence has been increasing in the past 20 years owing to the aging population and the popularization of screening.1011 The use of RT has also increased in terms of both the overall number of treatments and utilization rates.1213 Also, the number of RT facilities have steadily increased over time.14 In addition, the previous report stated that 35% of all institutions were capable to implement IMRT in 2006.15
Concentration of the medical resources in capital areas, where nearly half of the whole national population lives, is an important issue in Korea. A total of 22 out of the 43 advanced general hospitals as well as 52,078 (52.7%) of the 98,878 medical doctors in Korea are in capital areas, including Seoul, Incheon, and Gyeonggi province. The difference in healthcare resources between metropolises and non-metropolitan areas is also significant, with 73,933 (74.8%) of the 98,878 doctors in Korea working in the capital area and regional metropolises.16
Thus, in this paper, we aimed to assess the temporal changes of RT according to specific RT modality in Korea. In addition, the IMRT utilization rate as the main index in determining accessibility to advanced RT was examined by geographical region, classified into the capital area vs. non-capital areas and metropolitan areas vs. non-metropolitan areas.

METHODS

Sources of data and data acquisition

The Korean government has operated the National Health Insurance Service (NHIS) for over 30 years, which covers more than 98% of the nation's population.17 The Korean Health and Insurance Review and Assessment Service (HIRA) has provided information on the medical activities based on NHIS claim and reimbursement records.18 We collected information from 2010 to 2016 using treatment codes representing the first planning of RT. Based on the treatment codes, we acquired information regarding the number of RT modalities used. Treatment codes with an average number of use of < 20 per year were excluded from the study. We classified the treatment codes into the following treatment categories: two-dimensional radiotherapy (2DRT), three-dimensional conformal radiotherapy (3DCRT), stereotactic radiotherapy (SRT), proton therapy (PRT), brachytherapy, and IMRT. SRT included both stereotactic body radiotherapy and stereotactic radiosurgery. The details of the classification codes of treatment types are described in Table 1. Because the NHIS had not covered IMRT and PRT before 2011, the number of patients who received IMRT and PRT before 2011 was not calculated in the NHIS database. In addition, information on the regions of each institution that performed the treatments of each code was acquired.
Table 1

Categorization of RT codes

jkms-33-e67-i001
Category Treatment code Description
2DRT HD010 Teletherapy radiotherapy planning—single port
HD011 Teletherapy radiotherapy planning—parallel opposed ports
HD012 Teletherapy radiotherapy planning—non-parallel opposed ports, more than 3 ports
3DCRT HD013 Computerized radiotherapy planning—single port
HD014 Computerized radiotherapy planning—parallel opposed ports
HD015 Computerized radiotherapy planning—non-parallel opposed ports, more than 3 ports
HD016 Computerized radiotherapy planning—rotational therapy
HD018 Computerized radiotherapy planning—three-dimensional conformal radiation therapy
SRTa HD019 Computerized radiotherapy planning—stereotactic radiosurgery and radiotherapy
PRT HD020 Computerized radiotherapy planning—proton therapy planning
BT HD022 Brachytherapy—intracavitary or intraluminal therapy
IMRT HD041 Computerized radiotherapy planning—intensity-modulated radiation therapy planning
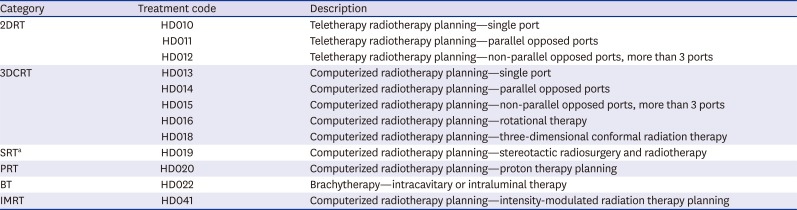
HD017 (computerized radiotherapy planning intraoperative radiation therapy), HD021 (brachytherapy-mold therapy), and HD023 (brachytherapy-interstitial therapy) were excluded because their average number of use was < 20 per year.
RT = radiation therapy, 2DRT = two-dimensional radiation therapy, 3DCRT = three-dimensional conformal radiation therapy, SRT = stereotactic radiotherapy, PRT = proton therapy, BT = brachytherapy, IMRT = intensity-modulated radiation therapy.
aSRT included both stereotactic body radiotherapy and stereotactic radiosurgery.

Classification of locating regions

The capital area included Seoul, which is the capital city of Korea, Incheon, and Gyeonggi province, which are easily accessible and surrounding to Seoul. Metropolitan areas encompassed seven administered metropolises and a province; Seoul, Daegu, Daejeon, Gwangju, Busan, Incheon, Ulsan, and Gyeonggi province. Gyeonggi province was categorized as metropolitan area because it is highly urbanized as metropolis with population of > 10 million and population density of > 1,100 per km2.19

Statistical analysis

To evaluate the temporal changes according to specific types of RT use, we performed a Poisson regression analysis. The calculated amount of annual rate changes in specific type of RT was defined as annual increase estimate (AIE) and considered statistically significant with a P value of < 0.05. The differences of AIEs between capital and non-capital areas and metropolitan and non-metropolitan areas were also analyzed. All statistical analyses were performed via SPSS version 20.0 (IBM Inc., New York, NY, USA).

Ethics statement

The ethical approval for this study is waived in consultation with Institutional Review Board of the relevant facilities since this study is an exceptional subject of the ethical consideration based on public open data only.

RESULTS

Distribution of RT from 2010 to 2016 according to specific modalities

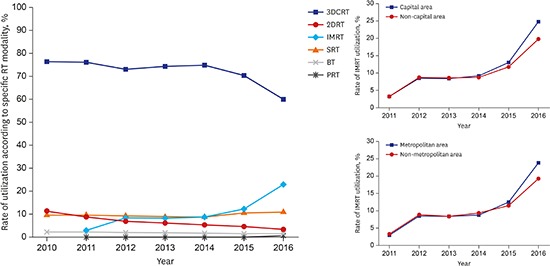
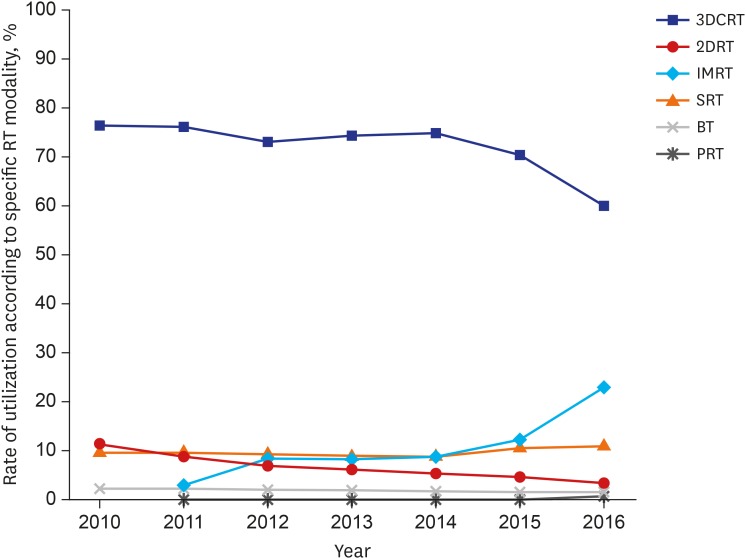
A total of 480,417 patients received RT from 2010 to 2016. The numbers of patients treated with various RT modalities in each year were listed in Table 2. The most dominant RT modality used during the past 7 years was 3DCRT (72%), although the rate of utilization showed a decreasing trend. However, the rate of IMRT utilization showed a steady increase since 2011, making it the second most common RT modality used. The utilization of 2DRT and 3DCRT showed an annual decreasing trend. The AIE of 2DRT and 3DCRT from 2010 to 2016 was −17.0% (95% confidence interval [CI], −16.5 to −17.5; P < 0.001) and −3.1% (95% CI, −2.9 to −3.3; P < 0.001), respectively. Meanwhile, the utilization of IMRT and SRT increased per year, with the AIE of IMRT and SRT being 37.9% (95% CI, 37.1 to 38.7; P < 0.001) and 2.2% (95% CI, 1.7 to 2.7; P < 0.001) from 2010 to 2016, respectively. Fig. 1 shows the change in the rate of RT utilization according to specific RT modalities from 2010 to 2016. In particular, the rate of IMRT utilization had two sharply rising periods, that is, between 2011 and 2012 and between 2015 and 2016. By contrast, the rate of 3DCRT utilization showed a relative abrupt reduction during both periods.
Table 2

Distribution of RT in Korea from 2010 to 2016 according to specific modalities
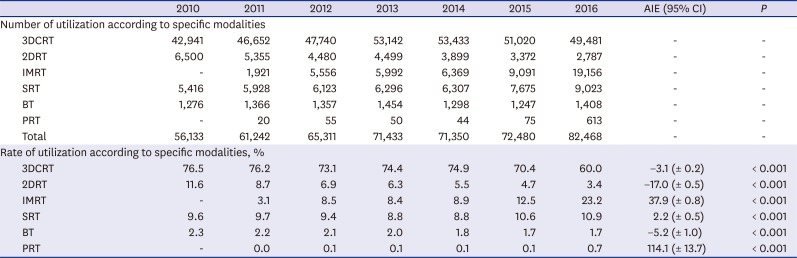
jkms-33-e67-i002
2010 2011 2012 2013 2014 2015 2016 AIE (95% CI) P
Number of utilization according to specific modalities
3DCRT 42,941 46,652 47,740 53,142 53,433 51,020 49,481 - -
2DRT 6,500 5,355 4,480 4,499 3,899 3,372 2,787 - -
IMRT - 1,921 5,556 5,992 6,369 9,091 19,156 - -
SRT 5,416 5,928 6,123 6,296 6,307 7,675 9,023 - -
BT 1,276 1,366 1,357 1,454 1,298 1,247 1,408 - -
PRT - 20 55 50 44 75 613 - -
Total 56,133 61,242 65,311 71,433 71,350 72,480 82,468 - -
Rate of utilization according to specific modalities, %
3DCRT 76.5 76.2 73.1 74.4 74.9 70.4 60.0 −3.1 (± 0.2) < 0.001
2DRT 11.6 8.7 6.9 6.3 5.5 4.7 3.4 −17.0 (± 0.5) < 0.001
IMRT - 3.1 8.5 8.4 8.9 12.5 23.2 37.9 (± 0.8) < 0.001
SRT 9.6 9.7 9.4 8.8 8.8 10.6 10.9 2.2 (± 0.5) < 0.001
BT 2.3 2.2 2.1 2.0 1.8 1.7 1.7 −5.2 (± 1.0) < 0.001
PRT - 0.0 0.1 0.1 0.1 0.1 0.7 114.1 (± 13.7) < 0.001
RT = radiation therapy, AIE = annual increase estimate, CI = confidence interval, 3DCRT = three-dimensional conformal radiation therapy, 2DRT = two-dimensional radiation therapy, IMRT = intensity-modulated radiation therapy, SRT = stereotactic radiotherapy, BT = brachytherapy, PRT = proton therapy.
Fig. 1
Rate of RT utilization from 2010 to 2016 according to specific RT modalities.
RT = radiation therapy, 3DCRT = three-dimensional conformal radiation therapy, 2DRT = two-dimensional radiation therapy, IMRT = intensity-modulated radiation therapy, SRT = stereotactic radiotherapy, BT = brachytherapy, PRT = proton therapy.
jkms-33-e67-g001

IMRT utilization between the capital and non-capital areas from 2010 to 2016

RT utilization in both the capital and non-capital areas is shown in Table 3. A total of 67% (321,734/480,417) of RTs was performed in the capital area. The proportion of RT utilization in the capital area during the past 7 years ranged from 66% to 68%. In terms of IMRT utilization, a steady increasing trend (P < 0.001, Fig. 2A) was noted from 2010 to 2016, in both capital and non-capital areas. Considering AIE from 2010 to 2016 between the capital and non-capital areas, the rate of AIE in the capital area was higher than that in non-capital areas (40.7% vs. 31.9%; P < 0.001).
Table 3

Comparison of RT utilization between capital and non-capital areas

jkms-33-e67-i003
2010 2011 2012 2013 2014 2015 2016 AIE (95% CI) P P (difference of AIE)
Number of utilization according to specific modalities
3DCRT Capital area 28,296 30,701 30,913 34,850 34,566 32,768 30,930 - - -
Non-capital area 14,645 15,951 16,827 18,292 18,867 18,252 18,551 - - -
2DRT Capital area 4,378 3,892 3,363 3,375 2,882 2,532 2,391 - - -
Non-capital area 2,122 1,463 1,117 1,124 1,017 840 396 - - -
IMRT Capital area - 1,309 3,682 3,998 4,305 6,268 13,860 - - -
Non-capital area - 612 1,874 1,994 2,064 2,823 5,296 - - -
SRT Capital area 4,283 4,604 4,721 4,730 4,771 5,809 6,991 - - -
Non-capital area 1,133 1,324 1,402 1,566 1,536 1,866 2,032 - - -
BT Capital area 757 833 761 897 789 767 905 - - -
Non-capital area 519 533 596 557 509 480 503 - - -
Total (capital area) 37,714 41,359 43,495 47,900 47,357 48,219 55,690 - - -
Total (non-capital area) 18,419 19,883 21,816 23,533 23,993 24,261 26,778 - - -
Grand total 56,133 61,242 65,311 71,433 71,350 72,480 82,468 - - -
Rate of utilization according to specific modalities, %
3DCRT Capital area 75.0 74.2 71.1 72.8 73.0 68.0 55.5 −3.7 (± 0.2) < 0.001 < 0.001
Non-capital area 79.5 80.2 77.1 77.7 78.6 75.2 69.3 −1.9 (± 0.3) < 0.001
2DRT Capital area 11.6 9.4 7.7 7.0 6.1 5.3 4.3 −14.6 (± 0.6) < 0.001 < 0.001
Non-capital area 11.5 7.4 5.1 4.8 4.2 3.5 1.5 −23.7 (± 0.9) < 0.001
IMRT Capital area - 3.2 8.5 8.3 9.1 13.0 24.9 40.7 (± 1.0) < 0.001 < 0.001
Non-capital area - 3.1 8.6 8.5 8.6 11.6 19.8 31.9 (± 1.3) < 0.001
SRT Capital area 11.4 11.1 10.9 9.9 10.1 12.0 12.6 1.9 (± 0.6) < 0.001 < 0.001
Non-capital area 6.2 6.7 6.4 6.7 6.4 7.7 7.6 3.5 (± 1.0) < 0.001
BT Capital area 2.0 2.0 1.7 1.9 1.7 1.6 1.6 −4.0 (± 0.8) < 0.001 < 0.001
Non-capital area 2.8 2.7 2.7 2.4 2.1 2.0 1.9 −7.2 (± 1.6) < 0.001
Proton therapy was performed in the capital area only.
RT = radiation therapy, AIE = annual increase estimate, CI = confidence interval, 3DCRT = three-dimensional conformal radiation therapy, 2DRT = two-dimensional radiation therapy, IMRT = intensity-modulated radiation therapy, SRT = stereotactic radiotherapy, BT = brachytherapy.
Fig. 2
Utilization of IMRT from 2010 to 2016. (A) between the capital and non-capital areas, (B) between metropolitan and non-metropolitan areas.
IMRT = intensity-modulated radiation therapy.
jkms-33-e67-g002

IMRT utilization between metropolitan and non-metropolitan areas from 2010 to 2016

Table 4 shows the comparison of RT modality utilization between the metropolitan and non-metropolitan areas. A total of 86% (410,771/480,417) of RTs was performed in the metropolitan areas. The proportion of RT utilization in the metropolitan areas was consistent per year, ranging from 85% to 86%. With respect to IMRT utilization, increasing patterns were observed in both metropolitan and non-metropolitan areas (P < 0.001, Fig. 2B), which is similar to the results for comparison of RT utilization between capital and non-capital areas. The metropolitan areas showed a higher AIE of IMRT use than non-metropolitan areas (39.7% vs. 29.4%; P < 0.001).
Table 4

Comparison of RT utilization between metropolitan and non-metropolitan areas

jkms-33-e67-i004
2010 2011 2012 2013 2014 2015 2016 AIE (95% CI) P P (difference of AIE)
Number of utilization according to specific modalities
3DCRT Metropolitan 36,481 39,579 40,036 44,690 44,813 42,327 40,812 - - -
Non-metropolitan 6,460 7,073 7,704 8,452 8,620 8,693 8,669 - - -
2DRT Metropolitan 5,775 5,012 4,266 4,351 3,726 3,229 2,728 - - -
Non-metropolitan 725 343 214 148 173 143 59 - - -
IMRT Metropolitan - 1,628 4,699 5,143 5,382 7,825 16,828 - - -
Non-metropolitan - 293 857 849 987 1,266 2,328 - - -
SRT Metropolitan 4,962 5,390 5,568 5,774 5,759 6,980 8,254 - - -
Non-metropolitan 454 538 555 522 548 695 769 - - -
BT Metropolitan 1,056 1,139 1,118 1,240 1,100 1,048 1,196 - - -
Non-metropolitan 220 227 239 214 198 199 212 - - -
Total (metropolitan) 48,274 52,768 55,742 61,248 60,824 61,484 70,431 - - -
Total (non-metropolitan) 7,859 8,474 9,569 10,185 10,526 10,996 12,037 - - -
Grand total 56,133 61,242 65,311 71,433 71,350 72,480 82,468 - - -
Rate of utilization according to specific modalities, %
3DCRT Metropolitan 75.6 75.0 71.8 73.0 73.7 68.8 57.9 −3.4 (± 0.2) < 0.001 < 0.001
Non-metropolitan 82.2 83.5 80.5 83.0 81.9 79.1 72.0 −1.8 (± 0.4) < 0.001
2DRT Metropolitan 12.0 9.5 7.7 7.1 6.1 5.3 3.9 −15.7 (± 0.5) < 0.001 < 0.001
Non-metropolitan 9.2 4.0 2.2 1.5 1.6 1.3 0.5 −36.2 (± 1.7) < 0.001
IMRT Metropolitan - 3.1 8.4 8.4 8.8 12.7 23.9 39.4 (± 0.9) < 0.001 < 0.001
Non-metropolitan - 3.5 9.0 8.3 9.4 11.5 19.3 29.4 (± 2.0) < 0.001
SRT Metropolitan 10.3 10.2 10.0 9.4 9.5 11.4 11.7 2.4 (± 0.5) < 0.001 < 0.001
Non-metropolitan 5.8 6.3 5.8 5.1 5.2 6.3 6.4 1.0 (± 1.6) 0.189
BT Metropolitan 2.2 2.2 2.0 2.0 1.8 1.7 1.7 −4.6 (± 0.9) < 0.001 < 0.001
Non-metropolitan 2.8 2.7 2.5 2.1 1.9 1.8 1.8 −8.4 (± 2.3) < 0.001
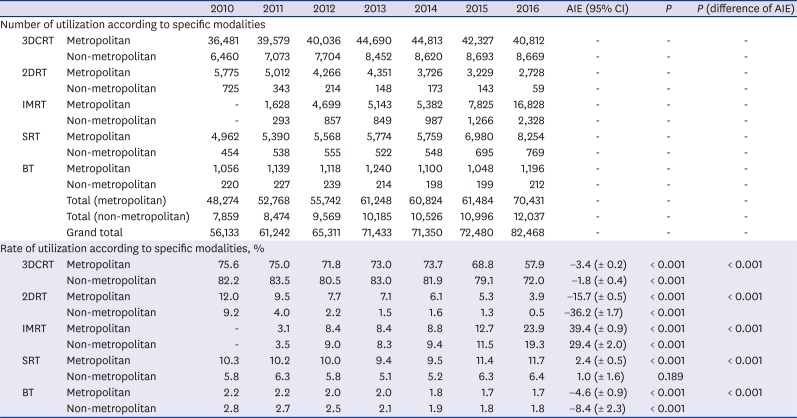
Proton therapy was performed in the metropolitan area only.
RT = radiation therapy, AIE = annual increase estimate, CI = confidence interval, 3DCRT = three-dimensional conformal radiation therapy, 2DRT = two-dimensional radiation therapy, IMRT = intensity-modulated radiation therapy, SRT = stereotactic radiotherapy, BT = brachytherapy.

DISCUSSION

This survey assessed the utilization of RT, specifically IMRT, and its comparison between regional areas with socioeconomic differences. In our analysis of IMRT utilization in Korea from 2010 to 2016, an increasing trend of IMRT use was predominant. Presently, advances in RT techniques have significantly altered the RT implementation landscape.202122 The benefits of IMRT, such as reducing toxicity, maximizing quality of life, and maintaining disease control,168920 contributed to the change in RT practice.
We observed that the utilization of IMRT showed a steady increase from 2012 to 2015, with an abrupt increase from 2011 to 2012 and from 2015 to 2016. In particular, IMRT utilization in Korea increased by an average rate of 1.3% between 2012 and 2015, by 5.4% from 2011 to 2012, and by 10.7% from 2015 to 2016. In 2011, the Korean NHIS announced that the national insurance will cover IMRT for patients with head and neck cancer, prostate cancer, brain tumor, spinal tumor, and recurrent or persistent tumors previously treated with RT. Thereafter, in 2016, NHIS announced subsequently that the national insurance on IMRT will cover all tumors if IMRT was implemented to spare an organ at risk or to reduce irradiated dose to normal organ. As such, the remarkable growth of IMRT use at both periods was associated with the extension of the national insurance for IMRT utilization by the NHIS.
Notably, the increasing pattern of IMRT use has been found in all institutions across Korea, regardless of the geographical region that encompasses and socioeconomic differences. As previously mentioned, the Korean NHIS covers more than 98% of the population.18 It facilitates patient access to advanced medical care by reducing the economic burden and leads to the implementation of advanced medical treatment in each institution.2123 Korea's universal healthcare system has lowered the socioeconomic barriers to advanced medical services, such as IMRT. However, in the current survey, a difference was noted in the increasing degree of IMRT utilization. The capital and the metropolitan areas had higher AIE of IMRT utilization than non-capital areas and non-metropolitan areas (40.7% vs. 31.9% and 39.7% vs. 29.4%, respectively). These differences were associated with both the concentration of medical institutions and the movement of patients who have advanced disease and are candidates for recent treatment from non-capital areas or non-metropolitan areas to urban areas depending on their willingness, rather than inadequate access to advanced medical care.1524
The increase in use of IMRT is a global trend. Mell et al.25 reported that only 32% of radiation oncologists in the United States used IMRT in 2002, whereas 73.2% used IMRT in 2004.26 In the United Kingdom, 45.8% of radiation oncology centers performed IMRT in 200727 and 76% in 2010.28 In Canada, only 37% of radiation oncology centers implemented IMRT in 2006, whereas 72% of these centers performed IMRT for all patients who could benefit from the treatment in 2010.29 In our study, the rate of IMRT use in Korea has steadily increased, but it was only 23.2% in 2016, which is still lower than the rates in the abovementioned countries. This suggests that the treatment efficiency of RT can be improved with continuous increase of IMRT treatment in Korea.
Our study has several limitations. Because the claims and reimbursement records from the HIRA include only the insured treatment, uninsured cases, including uninsured benign disease or RT for foreign patients, cannot be analyzed. Thus, the total number of RT utilization in this survey might be smaller than the actual number of implemented treatment. Moreover, we assumed that the use of IMRT can be an indicator of the accessibility of advanced medical care because possession of the equipment capable of IMRT is directly connected to the socioeconomic burden of each institution. Therefore, we hypothesized that IMRT implementation implied a strong commitment to perform recent treatments. However, we also agree that this hypothesis has its limitations because it was strongly related to the viewpoint of radiation oncologists.
In conclusion, the number of patients who received IMRT in Korea has shown a steady increase in the past 6 years. Furthermore, the increasing trend of IMRT utilization had the same patterns regardless of geographical region with political and socioeconomic difference, although the rate of increase varied. Regarding the increase of IMRT utilization being a global trend, this survey detailed the status of IMRT implementation and showed that IMRT has become one of the most common RT modalities for cancer treatment in Korea.

ACKNOWLEDGMENTS

We are grateful to the Korean Health and Insurance Review and Assessment Service for providing valuable information.

Notes

Funding: This work was supported by the year 2017 research grant from Korea University Ansan Hospital.

Disclosure: The authors have no potential conflicts of interest to disclose.

Author Contributions: Conceptualization: Yang DS, Yoon WS, Kim CY. Methodology: Kim WC, Koom WS. Formal analysis: Rim CH, Lee J. Writing - original draft: Rim CH, Lee J. Writing - review & editing: Rim CH, Lee J.

References

1. Nutting C, Dearnaley DP, Webb S. Intensity modulated radiation therapy: a clinical review. Br J Radiol. 2000; 73(869):459–469. PMID: 10884741.
crossref
2. Zelefsky MJ, Fuks Z, Hunt M, Lee HJ, Lombardi D, Ling CC, et al. High dose radiation delivered by intensity modulated conformal radiotherapy improves the outcome of localized prostate cancer. J Urol. 2001; 166(3):876–881. PMID: 11490237.
crossref
3. Lu TX, Mai WY, Teh BS, Zhao C, Han F, Huang Y, et al. Initial experience using intensity-modulated radiotherapy for recurrent nasopharyngeal carcinoma. Int J Radiat Oncol Biol Phys. 2004; 58(3):682–687. PMID: 14967420.
crossref
4. Barnett GC, Wilkinson J, Moody AM, Wilson CB, Sharma R, Klager S, et al. A randomised controlled trial of forward-planned radiotherapy (IMRT) for early breast cancer: baseline characteristics and dosimetry results. Radiother Oncol. 2009; 92(1):34–41. PMID: 19375808.
crossref
5. Donovan E, Bleakley N, Denholm E, Evans P, Gothard L, Hanson J, et al. Randomised trial of standard 2D radiotherapy (RT) versus intensity modulated radiotherapy (IMRT) in patients prescribed breast radiotherapy. Radiother Oncol. 2007; 82(3):254–264. PMID: 17224195.
crossref
6. Kam MK, Leung SF, Zee B, Chau RM, Suen JJ, Mo F, et al. Prospective randomized study of intensity-modulated radiotherapy on salivary gland function in early-stage nasopharyngeal carcinoma patients. J Clin Oncol. 2007; 25(31):4873–4879. PMID: 17971582.
crossref
7. Nutting CM, Morden JP, Harrington KJ, Urbano TG, Bhide SA, Clark C, et al. Parotid-sparing intensity modulated versus conventional radiotherapy in head and neck cancer (PARSPORT): a phase 3 multicentre randomised controlled trial. Lancet Oncol. 2011; 12(2):127–136. PMID: 21236730.
crossref
8. Pignol JP, Olivotto I, Rakovitch E, Gardner S, Sixel K, Beckham W, et al. A multicenter randomized trial of breast intensity-modulated radiation therapy to reduce acute radiation dermatitis. J Clin Oncol. 2008; 26(13):2085–2092. PMID: 18285602.
crossref
9. Pow EH, Kwong DL, McMillan AS, Wong MC, Sham JS, Leung LH, et al. Xerostomia and quality of life after intensity-modulated radiotherapy vs. conventional radiotherapy for early-stage nasopharyngeal carcinoma: initial report on a randomized controlled clinical trial. Int J Radiat Oncol Biol Phys. 2006; 66(4):981–991. PMID: 17145528.
crossref
10. Jung KW, Won YJ, Kong HJ, Oh CM, Cho H, Lee DH, et al. Cancer statistics in Korea: incidence, mortality, survival, and prevalence in 2012. Cancer Res Treat. 2015; 47(2):127–141. PMID: 25761484.
crossref
11. Jung KW, Park S, Kong HJ, Won YJ, Boo YK, Shin HR, et al. Cancer statistics in Korea: incidence, mortality and survival in 2006–2007. J Korean Med Sci. 2010; 25(8):1113–1121. PMID: 20676319.
crossref
12. Kang JK, Kim MS, Jang WI, Seo YS, Kim HJ, Cho CK, et al. The clinical utilization of radiation therapy in Korea between 2009 and 2013. Radiat Oncol J. 2016; 34(2):88–95. PMID: 27381419.
crossref
13. Kang JK, Kim MS, Jang WI, Kim HJ, Cho CK, Yoo HJ, et al. The clinical status of radiation therapy in Korea in 2009 and 2013. Cancer Res Treat. 2016; 48(3):892–898. PMID: 26693912.
crossref
14. Ji YH, Jung H, Yang K, Cho CK, Yoo SY, Yoo HJ, et al. Trends for the past 10 years and international comparisons of the structure of Korean radiation oncology. Jpn J Clin Oncol. 2010; 40(5):470–475. PMID: 20139270.
crossref
15. Huh SJ. Korean Society of Therapeutic Radiology and Oncology (KOSTRO). Current status of the infrastructure and characteristics of radiation oncology in Korea. Jpn J Clin Oncol. 2007; 37(8):623–627. PMID: 17673472.
crossref
16. The Korean Health and Insurance Review and Assessment Service. Updated 2017. Accessed June 2017. http://opendata.hira.or.kr.
17. Kwon S. Thirty years of national health insurance in South Korea: lessons for achieving universal health care coverage. Health Policy Plan. 2009; 24(1):63–71. PMID: 19004861.
crossref
18. Jung KW, Park S, Kong HJ, Won YJ, Lee JY, Park EC, et al. Cancer statistics in Korea: incidence, mortality, survival, and prevalence in 2008. Cancer Res Treat. 2011; 43(1):1–11. PMID: 21509157.
crossref
19. Korean Statistical Information Service (KOSIS). Updated 2017. Accessed June 2017. http://kosis.kr.
20. Intensity Modulated Radiation Therapy Collaborative Working Group. Intensity-modulated radiotherapy: current status and issues of interest. Int J Radiat Oncol Biol Phys. 2001; 51(4):880–914. PMID: 11704310.
21. Shen X, Showalter TN, Mishra MV, Barth S, Rao V, Levin D, et al. Radiation oncology services in the modern era: evolving patterns of usage and payments in the office setting for medicare patients from 2000 to 2010. J Oncol Pract. 2014; 10(4):e201–e207. PMID: 24756145.
crossref
22. Young R, Snyder B. IMRT (intensity modulated radiation therapy): progress in technology and reimbursement. Radiol Manage. 2001; 23(6):20–26. PMID: 11793560.
23. Dunlop S, Coyte PC, McIsaac W. Socio-economic status and the utilisation of physicians’ services: results from the Canadian National Population Health Survey. Soc Sci Med. 2000; 51(1):123–133. PMID: 10817475.
crossref
24. Brabbins D, Martinez A, Yan D, Lockman D, Wallace M, Gustafson G, et al. A dose-escalation trial with the adaptive radiotherapy process as a delivery system in localized prostate cancer: analysis of chronic toxicity. Int J Radiat Oncol Biol Phys. 2005; 61(2):400–408. PMID: 15667959.
crossref
25. Mell LK, Roeske JC, Mundt AJ. A survey of intensity-modulated radiation therapy use in the United States. Cancer. 2003; 98(1):204–211. PMID: 12833473.
crossref
26. Mell LK, Mehrotra AK, Mundt AJ. Intensity-modulated radiation therapy use in the U.S., 2004. Cancer. 2005; 104(6):1296–1303. PMID: 16078260.
crossref
27. Jefferies S, Taylor A, Reznek R. Radiotherapy Planning Working Party. Results of a national survey of radiotherapy planning and delivery in the UK in 2007. Clin Oncol (R Coll Radiol). 2009; 21(3):204–217. PMID: 19250811.
crossref
28. Mayles WP. Radiotherapy Development Board. Survey of the availability and use of advanced radiotherapy technology in the UK. Clin Oncol (R Coll Radiol). 2010; 22(8):636–642. PMID: 20667700.
crossref
29. AlDuhaiby EZ, Breen S, Bissonnette JP, Sharpe M, Mayhew L, Tyldesley S, et al. A national survey of the availability of intensity-modulated radiation therapy and stereotactic radiosurgery in Canada. Radiat Oncol. 2012; 7(1):18. PMID: 22309806.
crossref
TOOLS
ORCID iDs

Chai Hong Rim
https://orcid.org/0000-0001-7431-4588

Jeongshim Lee
https://orcid.org/0000-0002-7280-5401

Woo Chul Kim
https://orcid.org/0000-0002-1653-6147

DaeSik Yang
https://orcid.org/0000-0003-4193-6801

Won Sup Yoon
https://orcid.org/0000-0002-6098-1993

Woong Sub Koom
https://orcid.org/0000-0002-9435-7750

Chul Yong Kim
https://orcid.org/0000-0002-5485-6125

Similar articles