

 PDF
PDF Citation
 Print
Print


INTRODUCTION
Mitochondrial heteroplasmy refers to the co-existence of mitochondrial DNA genomes with different polymorphisms in an individual or a cell, whether the polymorphisms are originated from wild type inheritance or de novo mutation. This phenomenon could be found not only in normal samples with inherited heteroplasmy or somatic mutations by aging, but also in pathologic status, such as cancers or hereditary mitochondrial diseases.
In clinical medicine, mitochondrial heteroplasmy can be used in the assessment of treatment plan and its prognosis.1 If a patient has a heteroplasmic mutation in the mitochondrial region which is critical to certain disease or symptoms, the heteroplasmy level in the affected organ can be related to the penetrance, severity, or expected course of the disease. This is explained by the complementary function of normal mitochondria against mutated ones. Recently, there are attempts to utilize this phenomenon in more advanced areas such as prenatal detection,2 stem cell research or cell therapy.345 Meanwhile, forensic scientists have noticed the role of mitochondrial heteroplasmy in human identification. When the samples of comparison are identical in their haplotypes, the presence of same point heteroplasmy can increase the strength of evidence,6 as we have seen in the classic example of Tsar Nicholas II and his brother Georgij Romanov.7
In the past, Sanger direct sequencing or restriction fragment length polymorphism methods were used in distinction of homoplasmy and heteroplasmy,8 which are known to be insufficient to detect the minor alleles with frequencies under about 10% to 20%. With these methods, there is risk of misjudging the low-level heteroplasmies as homoplasmies, which can lead to failure to identify the targeted person or relationship, because the level of heteroplasmy could be variable between the individual or family members. In clinical medicine, a patient's clinical phenomenon can be misunderstood, followed by wrong diagnosis. Fortunately, with the development of the massively parallel sequencing (MPS) method, both the accurate detection and measurement of low-level heteroplasmy has become feasible, at least theoretically.9 However, the reliability and the accuracy of each system should be evaluated separately because they have different characteristics generating their own pros and cons.10
Considering many ongoing efforts to reveal the role and function of mitochondria and its genome, it could be expected that there would be increased need for mitochondrial DNA researches in the near future. But although many researchers have reported successful detection results of low-level heteroplasmy using MPS,11121314151617 there is no consensus about the criteria for determining mitochondrial heteroplasmy so far; whether the cut-off value should be applied to the frequency or read coverage of minor alleles, and if so, how the value could be determined; whether secondary confirmation through duplicate sequencing tests or other analysis tools would be necessary for the procurement of reliability; what kind of computation models would be appropriate to determine the status of heteroplasmy; and so on. This indicates that the reliability of the detection results of mixed alleles obtained from MPS techniques might be controversial yet. Still, some recent articles have regarded the nucleotide positions (nps) with minor allele frequencies (MAFs) up to 15% as ‘homoplasmy.’1819 There is more classic problem in analyzing mitochondrial heteroplasmy. As their name indicates, nuclear mitochondrial DNA sequences (NUMTs) are parts of nuclear genome which have same or at least similar sequences with them of mitochondrial genome.20 They could be amplified together with mitochondrial genome by the primers bound to the sequence homologous between nuclear and mitochondrial genomes, and pretend as mitochondrial heteroplasmy. Historically, many researchers have mistaken NUMTs for novel mitochondrial mutations.21 The two amplicon method has been widely used to prevent amplification of NUMTs, especially for MPS.9 There are sets of primers previously suggested for this method2223 and one of them was adopted in this study.
In addition, it should not be overlooked that there are barriers against proper analysis of the MPS data. Despite several bioinformatics tools and pipelines of no cost being suggested and launched,111924252627 they usually require specific operation systems such as Unix or Linux, knowledge about programming languages or structures, or additional compilation of numerous result files and spreadsheet works. Although there are some commercial programs with more integrated functions and user-friendly interfaces,28 their costs to purchase and maintenance might be a burden to a small group of researchers. It can be expected that considerable need exists for easily accessible and reliable analysis tools for detecting low-level heteroplasmies, but as of yet, there are no perfect choices. Even after the analysis tools and pipelines are determined and the sequencing results are acquired, understanding of the actual meaning of the result data is required for proper interpretation.
Bearing in mind these situations, we present in this study the detection and analysis results of mitochondrial heteroplasmic patterns from artificially mixed samples using the Ion Torrent system. There are several previous studies that have used this type of controlled samples to show the accuracy of heteroplasmy detection by different MPS systems or techniques.1314172930 This study has different experiment design from them, with the combination of the MPS system and mixture ratios. This study focuses on the evaluation of point heteroplasmy, considering the characteristics of the Ion Torrent system and the relative importance of point heteroplasmy in the area mentioned above. The results of two different analysis tools are compared, presenting the points of consideration in analyzing heteroplasmies of mitochondrial genomes.
METHODS
Sample selection
The authors have a dataset of the whole mitochondrial genome sequences of over two hundred Korean subjects using the Ion Torrent System, and part of these results were reported previously.31 Based on these MPS data, we selected samples for this study.
First, we chose the original samples that were confirmed to have innate point heteroplasmies, in the purpose to confirm the reproducibility of heteroplasmy detection. For straightforward analysis, samples having insertion or deletion against the revised Cambridge Reference Sequence (rCRS) were excluded.
Next, as we know the whole mitochondrial sequence of each sample, the numbers of discordant nps were counted for every case of mixture pairs. These positions would be observed as ‘heteroplasmy’ when the pairs were mixed. The pairs with the largest numbers of discrepant positions were selected.
Finally, 5 samples with various levels of MAFs, ranged from 24% to 45%, were selected and labeled as A to E. Among them, 4 samples were mixed to generate 2 pairs with artificial heteroplasmies. As a control, AmpFlSTR® Control DNA 9947A (Lot No. 1104081; Applied Biosystems, Warrington, UK) was used. 9947A was previously reported to have heteroplasmy at 2 nps.2932
DNA extraction, mixing and amplification
All samples were stored as blood, so DNA was extracted using the Maxwell® 16 Blood DNA Purification Kit and Maxwell® 16 instrument (Promega, Madison, WI, USA), according to the manufacturer's protocol. Mitochondrial copy numbers were quantified with PowerUpTM SYBRTM Green Master Mix (Applied Biosystems, Austin, TX, USA), according to the manufacturer's protocol. Partial sequence of mitochondrial NADH dehydrogenase subunit 5 (ND5) gene was used for the standard of qPCR, as suggested by Kavlick et al.33 The original stock of ND5 gene was serially diluted to 109, 108, 107, 106, 105, 104, 103, 102 copies per 2 μL. For every dilution process, Tris EDTA (TE) buffer (10 mM Tris-HCl, pH 8.0; 0.1 mM EDTA) was used.
The extracted DNAs were diluted to have 1,000,000 mitochondrial gene copies per 1 μL. Then each pair was mixed to 5 different ratios of 50:50, 20:80, 10:90, 2.5:97.5, and 1:99. Sample A of A-B pair and sample C of C-D pair were minor components, so their proportions in the mixtures were 50%, 20%, 10%, 2.5%, and 1.0%, respectively. The numbers of discrepant positions were 30 for A-B and 35 for C-D, excluding the innate heteroplasmies of original samples.
Two amplicon method which produces 2 overlapping 8 kb-length amplicons covering the whole mitochondrial genome was adopted to prevent NUMTs.22 Each 3 μL DNA and TaKaRa LA Taq DNA polymerase (Takara Bio Inc., Shiga, Japan) were used according to the manufacturer's guide. All samples were prepared in triplicate from the amplification step and the amplicon size of each product was confirmed by gel electrophoresis.
The PCR products were purified with HiYieldTM Gel/PCR DNA mini Kit (Real Biotech Corporation, Taipei, Taiwan) or Wizard® SV Gel and PCR Clean-Up System (Promega) and quantified by NanoDrop spectrophotometry (Thermo Fisher Scientific, Waltham, MA, USA). Two amplicons of each sample were pooled 20 μL equally and the final concentration was 50 ng/μL.
Library preparation and sequencing
Barcoded libraries were constructed with Ion XpressTM Plus Fragment Library Kit and Ion XpressTM Barcode Adapters Kit (Thermo Fisher Scientific), according to the manufacturer's protocols. These were quantified by Ion Library Quantitation Kit (Thermo Fisher Scientific), and pooled in equal concentrations of 26 pM per target. The libraries were used as template for emulsion PCR, and Ion Sphere Particles (ISPs) were enriched according to the manufacturer's protocol. Samples were loaded on Ion 316 chips (Thermo Fisher Scientific) as described below and Supplementary Fig. 1, and sequenced by Ion Torrent PGM platform (Thermo Fisher Scientific). Every sequencing process included negative controls.
Total 6 chips were used. 3 chips were allocated to standard coverage set (‘Std set’) and other 3 chips to high coverage set (‘High set’) for triplicate experiment. Sixteen samples were placed on each chip of Std set, which were composed of 5 original samples, 10 mixed samples, and 1 control. In case of High set, 5 samples were placed on each chip, which were composed of 4 mixed samples of 2.5% and 1.0% MAFs from each pair and 1 control. The expected average coverages were 1,562.5× for Std set and 5,000× for High set.
Data analysis
The sequenced data were analyzed with Ion Torrent SuiteTM Software version 5.0 and Variant Caller plug-in (TVC) version 5.0–13/e975447 (Thermo Fisher Scientific) using the rCRS as reference. The default setting of ‘Germline-Low Stringency’ was used for the overall parameters, which is described as ‘optimized for allele frequencies > 10%, high sensitivity, and minimal false negative calls’ in the manual. The called variants and their frequencies were generally consistent across the modified thresholds of MAF which ranged from 0.1 to 0.01. Other parameters were not adjusted from their default values.
Also, mtDNA-Sever (mDS) version 1.0.6 (https://mtdna-server.uibk.ac.at/) was used for the variant detection. mDS is a free web-based mitochondrial analysis tool that provides reports of heteroplasmy and haplotyping status of uploaded samples.11 Their parameters are fixed as presented in the user manual, for example, the threshold of MAF is 1%.
Integrative Genomics Viewer (IGV; http://software.broadinstitute.org/software/igv/home) was also used for the visual inspection of the interested positions. Additional analysis of the result files was performed with Microsoft Excel (Microsoft Corporation, Redmond, WA, USA).
RESULTS
Coverage depths
In TVC, the average coverage depth of each sample was reported as 1,369× in Std set and 4,517× in High set, which was similar with expectation. However, there were considerable imbalances between the samples placed on each chip. In the Std set, the maximum average value was up to 5.66-fold of the minimum within the same chip, and they were ranged from 644 to 4,122× entirely. In the High set, the maximum was up to 8.34-fold of the minimum, and they were ranged from 1,034 to 8,620×.
Meanwhile, mDS reported the average coverage depth as 1,275× in the Std set and 4,213× in the High set, which were about 7% less than that of TVC. This tendency was observed throughout all the individual samples and positions, which implies that mDS accepts less number of reads for analysis than TVC does.
Innate heteroplasmy in 5 original and 1 control samples
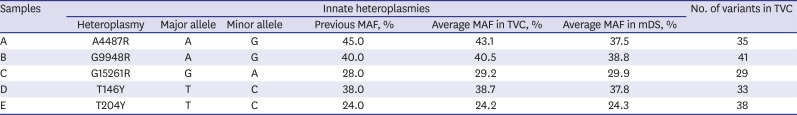
All the variants called by TVC were identical to our previous results as presented in Table 1, which could be easily expected because the same analysis method was used in both studies.31 The observed MAFs by TVC and mDS were both very close to the previous results. However, in the case of A4487R of sample A, the gaps of the average MAFs between mDS and TVC were larger than that of other innate heteroplasmies. This seems to be originated from the calculation error of mDS, as explained in Supplementary Table 1.
Table 1
Innate heteroplasmies and variants in 5 original samples
Meanwhile, a few variants were not reported by mDS as presented in Supplementary Table 2. The homoplasmic variants of T489C and T10873C were frequently dropped-out from several samples but these events were not regular and the reason is also not clear. Though the coverage depths of these positions were generally lower than average values, they were still high enough to be analyzed. The visual inspection of the reads of these positions also showed no specific differences.
In case of A2706G in sample C, TVC reported it as homoplasmic variant, while mDS included it in heteroplasmy report because of minor allele A with very low MAF as 2.3% and 2.1%. It seems to be due to different strategy of reporting homoplasmy and heteroplasmy between TVC and mDS, which can be overcame easily by the researcher with careful reading of the results.
If the minor alleles are identical to previously reported NUMTs, the heteroplasmy report of mDS provides the information of NUMTs based on the publication of Dayama et al.34 In this study, mDS reported 232 low-level heteroplasmies which were not reported by TVC, as presented in Supplementary Table 3. Among them, 73.7% were from sample C and all but one from sample D were reported as NUMTs before. Moreover, 214 (92.2%) of them was located within the range of about 700 bps started from np 2499 which is one end of the primer binding sites (Supplementary Fig. 2).
Meanwhile, the results of the control sample 9947A in this study were discordant with previous studies. Two heteroplasmies of 9947A had been observed at np 1393 and np 7861 through several methods, with MAFs of about 10% to 20%.2932 But in this study, TVC reported only np 7861 as a variant with average MAF of 18.1%, while mDS reported only np 1393 as NUMTs with average MAF of 2.5%. Based on the visual inspection and the detailed data from both analysis tools, it seems to be due to strand imbalance or low detection rate of low-level heteroplasmy, which will be further described in the following section. Also, the different source of control DNA could be the reason for different sequencing results.
Artificial heteroplasmy in 10 mixed samples
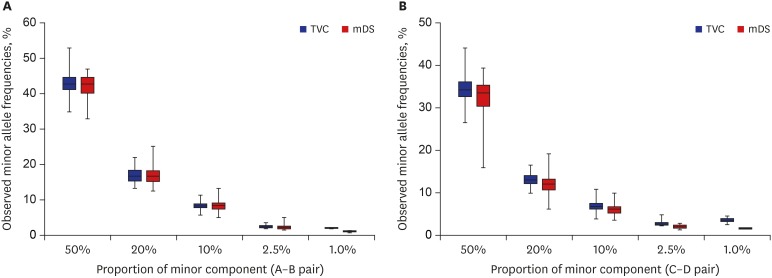
Total 1,035 heteroplasmic positions, including 975 artificially mixed and 60 innate, were generated by triplicated experiments for 10 mixed samples. Average MAFs were proportionately well correlated to the targeted MAFs, but were generally lower than their targeted values, except for the 2.5% and 1.0% heteroplasmies reported in TVC (Fig. 1). The average MAFs of 1.0% heteroplasmies were even higher than the targeted values in TVC, which seems due to the extremely low detection rate and erroneous read counts of minor alleles.
Fig. 1
Observed MAFs of each mixed pair. For A-B pair (A) and C-D pair (B), the MAF distribution of TVC is represented as gray boxes and mDS as white boxes. Both analysis tools showed generally lower MAFs than expected without significant differences.
MAF = minor allele frequency, TVC = Torrent Suite Variant Caller, mDS = mtDNA-Server.
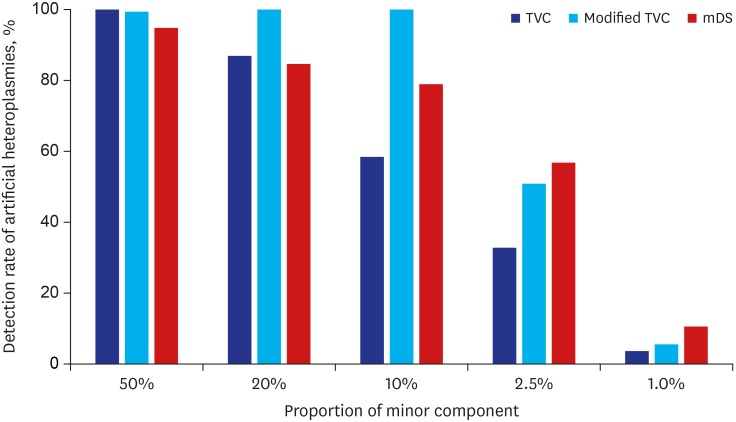
For targeted MAFs of 50%, 20%, 10%, 2.5%, and 1.0%, the detection rates of TVC were 100%, 87.2%, 58.5%, 32.8% and 3.6%, while those of mDS were 94.9%, 84.6%, 79.0%, 56.9% and 10.8%, respectively (Fig. 2). The detection rates were close to 90% for high-level heteroplasmies ≥ 20%, but they decreased for low-level heteroplasmies ≤ 10%. Also, TVC and mDS showed similar results for high-level heteroplasmies, but mDS showed generally higher detection rates than TVC for low-level heteroplasmies. At first, these results were thought to be due to different MAF thresholds between these programs. The threshold of MAF is fixed to 1% in mDS, while TVC provides parameter customization with recommending its range between 1% and 20%. However, some selected MAF thresholds within this range showed very similar results (data not shown).
Fig. 2
Detection rates of artificial heteroplasmies according to the analysis tools. TVC with reference modification shows the highest detection rates for high-level heteroplasmies, while mDS shows better results for low-level heteroplasmies.
TVC = Torrent Suite Variant Caller, mDS = mtDNA-Server.
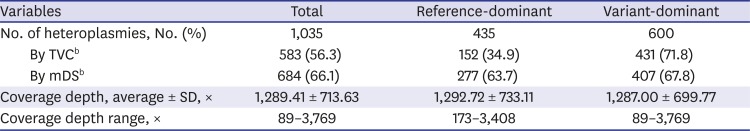
Interestingly, there were great differences in the detection rates between reference-dominant heteroplasmies, the heteroplasmies with major allele identical to rCRS, and variant-dominant heteroplasmies, the heteroplasmies with major allele different from rCRS. Table 2 summarizes these findings. In TVC, the reference-dominant heteroplasmies showed less than half detection rate compared to variant-dominant. These differences were not related with the levels of total coverage depths, minor allele coverage depths, or MAFs and not observed in the results of mDS.
Table 2
Detection results of artificial heteroplasmiesa
To confirm that the differences were originated from the algorithm of TVC dealing with reference sequence and variants, we tried some modification to the rCRS. We hypothesized that if the rCRS sequences of heteroplasmic positions were replaced by minor allele sequence, the reference-dominant and variant-dominant heteroplasmies would be treated equivalently and the differences in detection rates would be disappeared. As a result, these modifications were successful and the detection rates were markedly improved, especially for the heteroplasmies ≥ 10%, as shown in Fig. 2.
Relationship of coverage and detection rate of low-level heteroplasmies
To observe the effect of coverage depths on the detection rates of low-level heteroplasmies, different numbers of samples were placed on the Ion 316 chips between Std set and High set (Supplementary Fig. 1). In the High set, the overall coverage depths were expected to be higher than in the Std set, by allocating fewer samples. But as mentioned above, there were imbalances in the coverage depths of individual samples placed on the same chips. As the result of these imbalances, some samples of the High set had similar or even lower average coverage depths than some of the Std set. To observe the relationship of coverage depth and detection rate, the samples were ordered according to their average coverage depths, regardless of the type of set. There was no correlation between average coverage depths and detection rates per samples, as shown in Supplementary Fig. 3. The modification of reference sequence or minimum allele frequency threshold had no effect on these tendencies.
DISCUSSION
In this study, 5 blood samples of Korean with known innate heteroplasmy were selected and 2 pairs of extracted DNA samples were mixed in 5 serial ratios to confirm the accuracy of Ion Torrent platform in measurement of heteroplasmy level. Seneca et al.13 also made artificial mixtures for heteroplasmy analysis with Ion Torrent system, but they observed only 11 heteroplasmic positions and focused on the determination of the detection limit for heteroplasmy. Also, they analyzed their data only with TVC which is originally developed for nuclear mutations rather than mitochondrial heteroplasmy. In the present study, over 30 heteroplasmic positions per each mixed pair were artificially generated, and the sequenced data were analyzed with both TVC and mDS. mDS reported heteroplasmy with remarkable detection rate and detailed information. TVC generated clearly filtered and well-organized results, but its algorithm did not appear to be optimized for mitochondrial genome or heteroplasmy. However, after a simple modification of the reference sequence, the detection rates of TVC for mitochondrial heteroplasmy were improved to comparable level with mDS.
As presented in Supplementary Fig. 2, mDS reported very low-level heteroplasmies congregated in the front sequence of an amplicon, supposing them as NUMTs. This indicates the possibility of sharing homologous sequences between the primer binding site of mitochondrial DNA and multiple sites of nuclear DNA, resulting in the binding of primer to the nuclear DNA and generating NUMTs.20 For example, several nuclear sequences highly similar to the sequence of the primers used in this study were found by BLAST search on the reference human genome (data not shown). Mitochondrial DNA has tens to hundreds of times more chance of binding with primer than nuclear DNA does because of their large copy number, which explains the low proportion of NUMTs. Therefore, these heteroplasmies reported by mDS had considerable possibility of NUMTs amplified by unintentional binding of primers to nuclear homologous sequences, rather than ‘actual’ mitochondrial heteroplasmies.
Because the length of mitochondrial genome is absolutely and relatively short compared to that of nuclear genome, the perfect primer for universal mitochondrial population without nuclear homology is difficult to design. Unfortunately, there are no established criteria yet for discriminating NUMTs from mitochondrial heteroplasmy or technical error. So researchers should keep in mind that the NUMTs could always exist in the PCR product even the long amplicon method was adopted.35 NUMTs should be filtered out by bioinformatical approaches, using appropriate thresholds of quality score, minimum MAF and strand bias, and comparing the sequences with previously reported lists of NUMTs. Confirmation by other analysis tools or MPS systems specialized for mitochondrial genome could be also considered.9
The actual heteroplasmy and noise signal could be more easily discriminated if the sequence of minor allele or the location of heteroplasmy is known in advance. For example, in familial search, if the information of inherited heteroplasmy has been obtained from the family members of maternal lineage, the researcher can directly target the interested region or compare the suspected low signals. In clinical practices targeting known mutations or variants, it would be more straightforward. But without clues for the composition and distribution of minor components, the possibility of the presence of NUMTs or contamination should always be kept aware of, especially for the low-level heteroplasmies under 5%.
Meanwhile, the actual heteroplasmy and situational mixture might be discriminated by comparing the pattern of heteroplasmies throughout the sequenced genome. Innate heteroplasmies tend to appear in small number, leading to only little effect in determination of haplogroup. For example, in our previous study in Korean, only 7 of 186 individuals showed more than 2 point heteroplasmies and 5 heteroplasmies in an individual were the maximum.31 Also, the levels of heteroplasmies observed in each individual showed considerable difference. The pattern of situational mixture could be referred to that of artificial heteroplasmy generated in this study. The number of discrepant position of all pairs generated in this study ranged from 7 to 42, with an average of 30 (data not shown). The levels of these artificial heteroplasmies were consistent to the mixture ratio as described above.
Although there is no consensus for heteroplasmy analysis yet, about 10 to 20× coverage depths are regarded as a minimum threshold of minor allele in general. Also, about 1,000 to 2,000× of coverage depths per position are thought to be appropriate even for low-level heteroplasmy, considering both the data capacity of each MPS run and the financial limitation. The generally recommended sample numbers for the Ion Torrent chip models satisfies these suggestions.19 Increase of the coverage depths more than these seems to be not effective, as shown in this study.
It should be noted that the actual coverage depth could not always be reached the expected value for two reasons. First, as known before, there is significant variation in coverage depth per position within the mitochondrial genome. So when the heteroplasmy is located in the region of low coverage depth, minor allele sequence may be unable to be detected or discriminated from noise signal. Also, as observed in this study, the coverage imbalances between the samples placed on a chip could be another important factor. So the expectation of the coverage depth should consider not only the level and location of the targeted heteroplasmy, but also the unexpected variation of entire coverage depths which could be several-folds between samples. More study about the coverage imbalance itself and the strategy of balance enhancement is needed in the future.
Mitochondrial heteroplasmy generates very similar sequencing result to the somatic mutation of nuclear DNA. But the important difference is that the mutated sequences are ‘abnormal’ against the reference, while mitochondrial heteroplasmy is a ‘normal’ phenomenon, which could be observed in any person, organ, or np. Many variant caller programs, including TVC, were designed focusing on the nuclear mutation. They are usually based on the concept of ‘normal’ reference and ‘abnormal’ variants. If this concept is reflected in the variant detection criteria or computation algorithm of quality scores, different performances in variant detection between the types of dominant allele are inevitable. This study revealed that this difference actually exists, and significantly affects the detection rate of heteroplasmy.
From the fact that the quality score is one of the most important criteria to call a variant in TVC, it can be supposed that this difference has originated from the computation strategy for the quality score. According to their manual, the quality score for each variant position is computed by posterior probability which is applied differently depending on the type of call. For a variant call, they would adopt the posterior probability that the variant allele frequency of the sample is greater than the pre-set threshold of minimum allele frequency. For a reference call, the posterior probability that the variant allele frequency is under the threshold would be used. In contrast, the log likelihood ratio model adopted by mDS categorizes the alleles to major or minor by frequency level, regardless of their coincidence to the reference sequence. This will be more reasonable strategy for the mitochondrial genome.
It could be assumed that the computations by TVC would overlook some low-level heteroplasmies having reference major allele and variant minor allele, as observed in this study. As seen in Fig. 2, reference modification by replacement of the interested sequence actually improved the detection rates greatly. However, its usefulness is restricted to only a few situations when the minor allele sequences are known, or at least predictable. Meanwhile, the modified results of TVC paradoxically show its well-established criteria for the discrimination of false signals. Also, TVC detected considerable numbers of low-level variants, even though their level was under the pre-set thresholds of minimum allele frequency for single nucleotide polymorphisms.
Open-source programs and their developers have been contributing to the progress of algorithms to analyze MPS data. There are several programs for mitochondrial genome, and some of them are specialized for heteroplasmy detection.11242527 Most are Unix-based programs developed by small non-commercial groups of researchers. This unfamiliar operating system could be challenging for the researchers who lack knowledge of computer science or bioinformatics. The developers might have difficulties in maintenance, such as updates for coding or system errors and algorithms. Besides, each module might have been developed for a specific group, adopting different algorithms and reporting items according to their own purposes. For example, MToolBox, known to be a specialized tool for heteroplasmy analysis,24 warns in their manual that they provide a heteroplasmy report only for variants found against the reference sequence chosen for read mapping.36 There are increasing needs for easily accessible and integrated mitochondrial analysis tools, as interest in mitochondrial heteroplasmy is increasing in not only forensic science and classical clinical medicine,37 but also developing areas of laboratory medicine2 and biotechnology.345 Fortunately, new programs like mDS have adopted previously known algorithms with modification, introducing more user-friendly interfaces, and are continuously being developed.11 Also, mDS automatically provides the information about NUMTs for each variant, which can help researchers interested in NUMTs detection. But the difficult decision whether a variant is NUMTs or not is still on the researcher himself.
Also, interestingly, the sequencing results of 9947A in this study showed different heteroplasmy profiles from previous reports.2932 9947A, extracted liquid DNA from human lymphoblastoid cell line GM009947A, is one of the Standard Reference Materials certified by the National Institute of Standards and Technology, and is called as NIST SRM 2392 component B. It is known to have two heteroplasmy positions, np 1393 and 7861, but only part of them was reported in this study. In addition to the differences of the detection algorithm of each tool as described above, the effect of mitochondrial segregation during repetitive cell culture could be an important factor in this result. During mitosis, the mitochondria in a cell are randomly allocated to daughter cells. This might result in a shift in the distribution of mutation or heteroplasmy.1 This indicates that the detailed sequence information of reference materials, including heteroplasmy status, should be monitored and informed periodically, according to the cell line generation and the lot number.
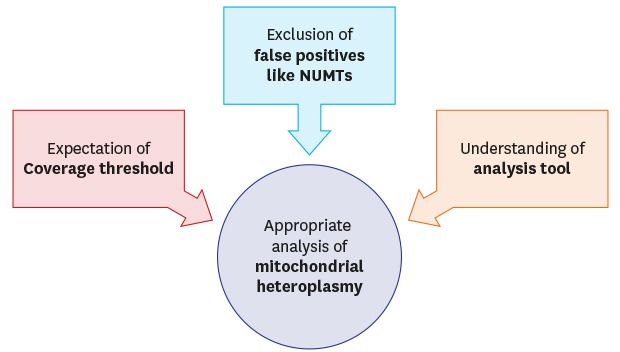
Finally, the following suggestions could be derived from this study. Coverage depths over about 1,500× seem to be sufficient to obtain reliable detection results of heteroplasmy, while the level of MAF itself is the most important factor for the detection rate. Both the location and level of the heteroplasmy and the effects of coverage imbalances between samples sharing data capacity should be considered in the expectation of coverage depths. The possibility of NUMTs should be kept in mind for the heteroplasmies lower than 5%, especially when they appear unexpectedly. If possible, securing the candidate sequences of the minor component would be helpful in heteroplasmy analysis. The selection of the analysis tools for heteroplasmy detection and the interpretation of their results should be based on the understanding of the different purposes and meanings of the computation algorithms and parameter settings. Secondary analysis tools might be helpful in confirming the results, especially if they use different computation algorithms.
 XML Download