

 PDF
PDF Citation
 Print
Print


INTRODUCTION
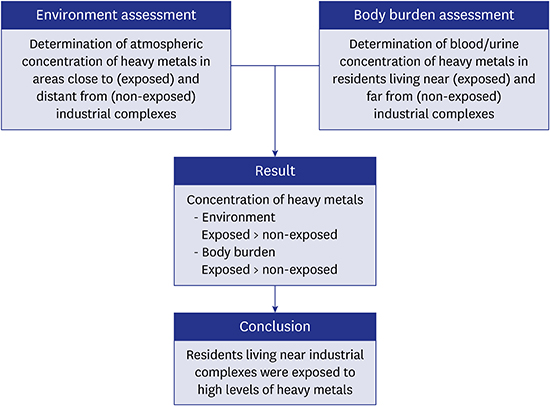
Heavy metals, such as lead, mercury, and cadmium, can have adverse effects on the immune system, cardiovascular system, urinary system, endocrine system, and nervous system.1234 These heavy metals usually enter the body by inhalation of metal fumes or dust at the workplace.134 Heavy metal exposure in the workplace can directly increase the body burden of workers, and indirectly increase the body burden of residents living near industrial complexes due to the pollution of nearby air, soil, and water.567 In addition to environmental exposures, the effects of heavy metals on humans also depend on an individual's demographic and clinical characteristics (e.g., sex, age, presence of anemia, menstruation, and other medical factors), so heavy metals may have different health effects in different individuals.8910 Heavy metals can also affect the fetus, because they can pass through the placenta.111213 Therefore, it is important to assess the concentrations of external exposure to heavy metals of residents living near industrial complexes, and to consider modification of body burden by personal factors.
However, few studies in Korea have assessed heavy metal exposures of residents living near industrial complexes. The purposes of the present study are to: 1) determine the average concentrations of atmospheric heavy metals in areas near and distant from industrial complexes; 2) measure the body concentrations of heavy metals in residents living near and distant from industrial complexes; and 3) assess the effect of personal factors on heavy metal body burden.
METHODS
Study area and environmental heavy metal measurements
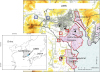
The Ulsan metropolitan region (UMR), located in south-east Korea, has a population of 1.1 million and contains large industrial complexes, including the world's largest shipbuilder, automobile assembly plant and a petrochemical complex along the coast (Fig. 1). This region has several industrial plants that are potential sources of heavy metal pollution and are close to an urban residential area. Thus, many people living in this area have increased risk for exposure to heavy metals.14
Fig. 1
Geography of the UMR, showing sites that used to monitor atmospheric heavy metals (AQ1–4), and residential locations of study subjects in the “non-exposed group” (blue squares) and the “exposed group” (red squares).
UMR = Ulsan metropolitan region, AQ = air quality monitoring site.
To compare the average atmospheric concentration of heavy metals (lead and cadmium) in different urban environments in the UMR, we obtained daily measurements over 10 years (2006–2015) from four air quality monitoring sites (AQ1 to 4 in Fig. 1) operated by the Korea Ministry of Environment, and also used annual average concentrations, which were calculated based on monthly validated daily data. AQ1 and AQ2 are near the industrial complexes; AQ3 and AQ4 distant from the industrial complexes, and near the urban center.
Study subjects
The target population of this study comprises Korean residents who either lived near industrial complexes (“exposed” group) or distant from industrial complexes (“non-exposed” group) residing in Ulsan. A probability sampling method, with a multi-stage cluster design, was conducted. At first, five primary sampling units (PSUs) were drawn from geographically defined areas in Ulsan. A total of 200 target households were finally sampled for each PSU, which consisted of 1,254 households on average, using systematic sampling. In the selected households, individuals aged 20 years and over were targeted. The exposed group and non-exposed group were approximately 3:1 matched on age and sex. Participants were recruited between August 2012 and October 2015. A total of 1,148 participants completed the questionnaires and provided biological samples. There were 872 participants (354 males and 518 females) in the exposed group and 276 participants (106 males and 170 females) in the non-exposed group. Subjects who may have occupational exposures to dusts (five hazards), fumes (five hazards), and vapors (two hazards) were excluded. Nine subjects involved in occupations exposed to lead soldering were excluded in the analysis, but no subjects were involved in occupations exposed to cadmium or mercury. The exposed group (red rectangles in Fig. 1) lives near industrial complexes, including petrochemical factories (“Petrochemical complex”) and non-ferrous metal producing factories (“Onsan industrial complex”). All study subjects completed written questionnaires that collected information about demographic characteristics, exposure to environmental hazards, lifestyle, current dietary habits, and time-use patterns. They also provided blood and urine samples. We used blood lead, urinary cadmium, and urinary total mercury to assess the body concentrations of these heavy metals.
Biological monitoring
Heparinized venous blood and urine samples were obtained, with special care taken to avoid contamination. Whole blood samples were frozen and stored at −20°C prior to analysis. For evaluation of blood lead concentrations, samples were first diluted, and then analyzed with a graphite furnace-atomic absorption spectrophotometer (GF-AAS). More specifically, 100 µL of whole blood, 100 µL of 0.2% HNO3, and 800 µL of diluted solution (0.2% [NH4]2HPO4 and 0.2% Triton X-100) were combined in a 5-mL tube. This tube was vortexed for several seconds, and the contents were then analyzed using a GF-AAS (AA-600, PerkinElmer, MA, USA).15
A similar procedure was used to determine urinary cadmium concentrations. Urine was collected, then 100 µL of urine, 100 µL of 0.2% HNO3, 800 µL of diluted solution (0.2% [NH4]2HPO4 and 0.2% Triton X-100) were combined in a 5-mL tube. The tube was then vortexed for several seconds, and the contents were analyzed using a GF-AAS. Urinary cadmium concentrations are expressed relative to urinary creatinine (Cr) concentration.16 External quality control was provided by the German External Quality Assessment Scheme (G-EQUAS). Total urinary mercury concentrations were measured using a gold amalgamation direct mercury analyzer (SP-3DS; NIC, Tokyo, Japan).
The method detection limits were 0.15 μg/dL for lead, 0.07 μg/L for cadmium, and 0.06 μg/L for total mercury. For statistical analysis, we classified the concentration of any sample below the detection limit as the detection limit divided by 2. Fifteen cadmium samples and 12 mercury samples were below the limits, but no samples of lead were below the limit.
Statistical analysis
The distribution of each heavy metal had positive skewness, so these values were log-transformed before analysis. For comparison of means, we used analysis of variance (ANOVA) or Student's t-test. Geometric means (GMs) and 95% confidence intervals (CIs) of body heavy metal concentrations were reported for the exposed and non-exposed groups, and according to sex, age group, body mass index (BMI), education level, smoking status, alcohol drinking, and seafood intake. To identify factors associated with body concentrations of each heavy metal, we performed a multiple linear regression analysis. To assess the changes of the combined body concentration of all 3 metals according to demographic, lifestyle, and exposure variables, all individuals with concentrations of each metal more than the mean were placed in a “high combined concentration” group; all individuals with concentrations of each metal below the mean were placed in a “low combined concentration” group; and all others were placed in an “intermediate combined concentration” group. To evaluate differences in categorical variables such as demographic, lifestyle, and exposure variables among these three groups, we performed χ2 tests and calculated P for trend. To assess the effect of age and residence in an exposed area on the combined body concentration of the metals, adjusted odds ratios (aORs) and 95% CIs for high combined concentration group of heavy metals (vs. other combined concentration groups) were calculated after adjustment for covariates.
We used IBM SPSS Statistics for Window version 21.0 (IBM SPSS Inc., Chicago, IL, USA) to perform data analysis, and defined a P value less than 0.05 as statistically significant.
RESULTS
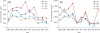
Table 1 presents the mean atmospheric concentrations of lead and cadmium at the four monitoring sites in the UMR over the 10-year study period (2006–2015). These data, from the Air Monitoring Network in Ulsan, indicate the mean concentration of lead was significantly higher at the two sites near industrial complexes (AQ1, 0.055 µg/m3; AQ2, 0.075 µg/m3) than at the two sites near the urban center (AQ3, 0.039 µg/m3; AQ4, 0.037 µg/m3). In addition, the mean air concentration of cadmium was significantly higher at a site near the Onsan industrial complex (AQ2, 0.0026 µg/m3) than at two sites near the urban center (AQ3, 0.0014 µg/m3; AQ4, 0.0016 µg/m3). Measurement of lead concentrations over time showed the concentrations were greatest at AQ2, intermediate at AQ1, and lowest at AQ3–4, although the lead concentrations at all sites decreased over time (Fig. 2). The air concentrations of cadmium had similar changes over time.
Table 1
Average atmospheric concentrations of lead and cadmium at the four monitoring sites in the UMR from 2006 to 2015 (see Fig. 1)

Fig. 2
Average annual atmospheric concentrations of lead and cadmium at the four monitoring sites (2006–2015).
Pb = lead, Cd = cadmium, AQ = air quality monitoring site.
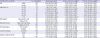
We enrolled 1,148 subjects, 276 (24.0%) in the non-exposed group and 872 (76.0%) in the exposed group. The GM concentration of blood lead in the exposed group (2.264 µg/dL) was significantly higher than that in the non-exposed group (1.944 µg/dL). Similarly, the GM concentrations of urinary cadmium and mercury were greater in the exposed group than in the non-exposed group (cadmium, 0.976 vs. 0.763 µg/g Cr; mercury, 0.686 vs. 0.582 µg/g Cr). There were also significant differences in the body concentrations of each metal according to sex. Males had higher concentrations of lead (2.598 vs. 1.946 µg/dL), but females had higher concentrations of cadmium (1.083 vs. 0.721 µg/g Cr) and mercury (0.691 vs. 0.614 µg/g Cr). The GM of lead and mercury tended to increase with age, and cadmium showed remarkable increase with age. In addition, the lead concentration was significantly higher in those who had less education, smoked tobacco, and were non-drinkers; the cadmium concentration was higher in those with less education, and who were drinkers; and the mercury concentration was higher in those with less education, and who regularly consumed seafood (Table 2). When we stratified study subjects into exposed and non-exposed groups, the metal concentrations showed similar tendencies according to demographic and lifestyle factors (Tables 3 and 4).
Table 2
Concentrations of blood lead (μg/dL), urinary cadmium (µg/g Cr), and urinary mercury (µg/g Cr) in total study subjects, with classification by different variables
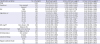
Table 3
Concentrations of blood lead (μg/dL), urinary cadmium (µg/g Cr), and urinary mercury (µg/g Cr) in exposed group, with classification by different variables
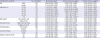
Table 4
Concentrations of blood lead (μg/dL), urinary cadmium (µg/g Cr), and urinary mercury (µg/g Cr) in non-exposed group, with classification by different variables
Analysis of these data using a multiple linear regression model showed that blood lead concentration had a significant and positive association with age, non-drinking status, male sex, and residence near an industrial complex (Table 5).
Table 5
Multiple linear regression model of the association of log (blood lead) with different variables after adjusting for covariates (n = 1,139)

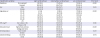
Cadmium concentration had a significant and positive association with age, less education, non-drinking status, female sex, residence near an industrial complex, and smoking (Table 6). In addition, a separate analysis of smokers indicated that age, female sex, and residence near an industrial complex had a significant and positive association with urinary cadmium concentration. A separate analysis of non-smokers indicated similar trends (Table 6).
Table 6
Multiple linear regression model of the association of log (urinary cadmium) with different variables after adjusting for covariates in all subjects (n = 1,148), smokers (n = 214), and non-smokers (n = 934)
Urinary mercury concentration was significantly and positively associated with age, less education, non-drinking status, female sex, regular consumption of seafood, and residence near an industrial complex (Table 7).
Table 7
Multiple linear regression model of the association of log (urinary mercury) with different variables after adjusting for covariates (n = 1,148)

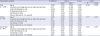
To assess the association of the combined body concentration group of all 3 metals with demographic, lifestyle, and exposure variables, analysis using χ2 tests showed that individuals in the high combined concentration group were more likely to live near an industrial complex, were older, and had less education than those in the low combined concentration group (Table 8).
Table 8
Characteristics of groups whose combined body concentrations of lead, cadmium, and mercury were high, intermediate, or lowa (n = 1,132)
Values indicate number and percentage.
BMI = body mass index.
aHigh combined concentration: body concentrations of lead, cadmium, and mercury that were each above the mean; low combined concentration: body concentrations of lead, cadmium, and mercury that were each below the mean; intermediate combined concentration: all others.
To assess the effect of age and exposure status on the combined body concentration of all three heavy metals, we also calculated aORs and 95% CIs for the high combined concentration group of the metals after adjustment for covariates (Table 9). The results showed that advanced age (aOR, 1.039; 95% CI, 1.026–1.052) and residence near an industrial complex (aOR, 2.238; 95% CI, 1.439–3.481) were significantly associated with the high combined metal concentration group.
Table 9
Multiple logistic regression analysis of the relationship of age and residence (exposed or non-exposed) with high combined body concentration group of heavy metals (n = 1,132)

| Variables | Classification | aOR | 95% CI |
|---|---|---|---|
| Age, yr | 1.039 | 1.026–1.052 | |
| Residence | Non-exposed | Reference | |
| Exposed | 2.238 | 1.439–3.481 |
DISCUSSION
The present study showed that the atmospheric concentrations of lead and cadmium were greater in areas near industrial complexes than in areas more distant from these facilities. In the past, leaded gasoline was a major environmental source of lead. The 1993 prohibition of leaded gasoline in Korea significantly decreased lead pollution.1718 However, there are other environmental sources of lead, such as batteries, paints, and solder.19 Similarly, cadmium is used in the manufacture of batteries, pigments, and plastics, and mercury is used in production of batteries, light bulbs, thermometers, and paints.20 This explains why the atmospheric concentrations of heavy metals near industrial complexes, in particular the Onsan industrial complex (which uses non-ferrous metals), are higher than in other regions.
Our biological monitoring results also showed that the concentrations of blood lead, urinary cadmium, and urinary mercury were greater in subjects who lived near industrial complexes. More specifically, the GM concentrations of blood lead in the non-exposed group (1.944 µg/dL) and the exposed group (2.264 µg/dL) were both higher than the mean for the Korean general population in 2015 (1.940 µg/dL), reported by the Korean National Environmental Health Survey (KNEHS).21 Similarly, the urinary cadmium and mercury concentrations in the exposed group (0.976 and 0.686 µg/g Cr, respectively) and the non-exposed group (0.763 and 0.582 µg/g Cr, respectively) were higher than the means for the Korean general population in 2015 (0.496 and 0.487 µg/g Cr, respectively) reported by the KNEHS.21
Taken together, our results suggest that the higher atmospheric concentrations of lead and cadmium at sites near industrial complexes explain the higher blood lead and urinary cadmium concentrations of residents near these complexes.22 Furthermore, aged residents near industrial complexes had greater combined concentrations of all three heavy metals.
We found that, in addition to living near an industrial complex, demographics and lifestyle factors also affected the body concentrations of all three heavy metals. When we stratified study subjects into exposed and non-exposed groups, we also showed that demographics and lifestyle factors affected the body concentrations of the heavy metals irrespective of exposure status. In particular, the blood lead concentration increased with age, male sex, and tobacco smoking, in agreement with previous reports.2324 The higher blood lead concentration in males may be because females have greater concentrations of estrogen, which promotes bone formation and induces movement of blood lead into bone tissue.8 Tobacco also contains lead,252627 and this explains the greater blood lead concentrations in smokers.
We found that the urinary cadmium concentration increased with age, female sex, and tobacco smoking, consistent with previous studies.28 Smoking is the major source of cadmium exposure, so we separately analyzed smokers and non-smokers. The results showed that the urinary cadmium concentration increased with age, female sex, and living near an industrial complex for both groups. Female sex was the most statistically significant factor in both groups. The higher concentrations of cadmium in females is partly because iron deficiency is more common in females, and iron deficiency leads to increased cadmium absorption in the intestines.29
We found that the urinary mercury concentration increased with age, female sex, avoidance of alcohol, regular consumption of seafood, and less education. Seafood is a well-known source of organic mercury,3031 however, mercury resulting from fish consumption can explain total mercury concentrations in urine to some degree (about 30%), partly through the degradation into the inorganic form in the human body,32 although urinary total mercury mainly reflects exposure to inorganic mercury.26 Dietary ethanol can reduce lung absorption of inorganic mercury by inhibiting reactions within red blood cells,333435 and previous research in Korea also indicated that people who consumed alcohol had lower concentrations of urinary mercury.36 In contrast, blood organic mercury concentration is higher in alcoholics and males.3738
Interestingly, the concentrations of blood lead, urinary cadmium, and urinary mercury all increased with age. For lead and cadmium, this may be because of their long biological half-lives (low rates of excretion).39 For mercury, the measured urinary mercury concentration mainly reflects inorganic mercury, and therefore indicates a bioaccumulation of inorganic mercury. Our findings are compatible with those of previous studies.1026
The present study has several public health implications. We found elevated concentrations of heavy metals in individuals who resided near industrial complexes, although atmospheric concentrations of lead and cadmium decreased over time. Thus, the higher heavy metal concentrations in individuals living near industrial complexes may be due to their long-term cumulative exposure to air from the industrial complexes. Thus, we suggest that individuals living near the industrial complexes should continue to be monitored to assess the body burden of heavy metals and related health effects. Next, the present study showed that individuals living near the industrial complex area had greater complex exposure to all three heavy metals. Toxicologically, complex exposure implicates not only an addition of each metal's toxicity, but also potential complicated synergistic toxicity, leading to unexpected adverse health effects. Thus, health evaluations and public health measures should consider the cumulative complex exposures to all heavy metals, instead of short-term exposure to individual heavy metal. Finally, we also should consider the effect of demographic and lifestyle factors on the concentration of heavy metals when addressing metal concentration in the general population.40
The strengths of the present study are that we evaluated the concentration of heavy metals in the atmosphere and in biological samples. This allowed us to show that the higher concentrations of heavy metals in residents near industrial complexes is mainly due to prolonged exposure from these industrial complexes. The present study also has several limitations. First, this study was a cross-sectional study, so we can identify associations, but cannot make conclusions regarding causality. Second, we defined the “exposed” group and “non-exposed” group according to residential proximity to industrial complexes. Although we excluded subjects who may have received occupational exposures using questionnaires on involvement in occupations potentially exposed to 12 kinds of occupational hazards, there was the possibility of misclassification. Third, this study only used 4 air quality monitoring sites to estimate ambient concentrations of lead and cadmium. We had no data on the concentration of atmospheric mercury.
In conclusion, this study showed that individuals living near industrial complexes in UMR had significantly higher body concentrations of lead, mercury, and cadmium. These results indicate that it is particularly important to monitor environmental and body concentrations of heavy metals, and to regularly assess the health of individuals living near industrial complexes.
 XML Download