

 PDF
PDF Citation
 Print
Print


INTRODUCTION
Lead and cadmium are widely dispersed in the environment, and individuals in the general population are increasingly exposed to these heavy metals.12 Workers are often exposed to these metals in their places of employment, but adolescents are mainly exposed from non-occupational sources. Lead can damage the central nervous system, kidneys, cardiovascular system, reproductive organs, and hematological system. The main environmental sources of lead are leaded gasoline, lead paint (including lead paint-contaminated dust and soil), water from lead pipes, and industrial emissions.2 Lead exposure also occurs through cigarette smoking or consumption of certain foods.2 Thus, lead enters the body via inhalation or ingestion.2 A recent systematic review concluded that long-term exposure to high levels of lead can lead to hypertension in adults.3 A previous meta-analysis reported that a two-fold increase in blood lead (PbB) concentration was associated with a 1.0 mmHg increase in systolic blood pressure (SBP) and a 0.6 mmHg increase in diastolic blood pressure (DBP).4 A more recent meta-analysis by Nawrot et al.5 confirmed the statistically significant relationship between elevated PbB and increased blood pressure (BP). Our previous studies showed that PbB level was associated with increased BP and risk of hypertension in the general adult population of Korea.6 However, previous studies of the relationship of PbB level with BP in adolescents and children have had inconsistent results.7891011
Cumulative exposure to cadmium can also increase the risk for overall mortality, as well as cardiovascular, neurological, renal, and developmental diseases.1 Environmental cadmium is ubiquitous in air, soil, and water due to industrial activities, use of phosphate fertilizers, combustion of motor fuels, and release of particles from tire wear.1 Cadmium has a biological half-life of more than 10 years in the whole body, and body levels increase with age because only a minute part of the body burden (0.01%–0.02%) is excreted each day.1 In nonsmokers, diet is the major source of cadmium exposure; in smokers, tobacco is the major source because tobacco plants, like other plants, take up cadmium.1 Animal studies,12 occupational studies,13 and general population studies in adults46141516 have reported associations between hypertension and blood cadmium (CdB) level. However, no previous studies have reported the relationship of CdB level with BP in adolescents and children.
The present study evaluated the association of BP with blood levels of cadmium, lead, and cadmium and lead together (lead + cadmium) in a representative sample of adolescents (age 10–18 years) from Korea by use of 2010–2016 data from the Korean National Health and Nutrition Examination Survey (KNHANES).
METHODS
Design and data collection
This study used data from the KNHANES of 2010–2016, which included KNHANES V (2010–2012), KNHANES VI (2013), and KNHANES VII (2016). These surveys were conducted annually by use of a rolling sample design that employs a complex, stratified, multistage probability cluster analysis of a representative sample of the non-institutionalized civilian population in Korea. Thus, the KNHANES is a large representative population study with rigorous quality controls. These surveys are performed by the Korea Centers for Disease Control and Prevention (KCDC), and the Korea Ministry of Health and Welfare, and have three components: a health interview, a health examination, and a nutrition survey.
The present cross-sectional analysis examined subjects aged 10–18 years-old who completed the health examination survey, which included measurement of blood metals, and the nutrition survey.17 The final analytical sample consisted of 1,776 adolescents (age 10–18 years, 917 males and 859 females). Kim et al.18 provided details on the design of the survey. Briefly, information on age, education, smoking history, and alcohol intake was collected during the health interview. Height and weight were recorded with the participants wearing light clothing and no shoes. Body mass index (BMI) was calculated as body weight (kg) divided by the square of height (m2). Based on BMI, subjects were classified as lean (BMI < 18.5 kg/m2), normal (18.5 ≤ BMI < 25 kg/m2), or obese (BMI ≥ 25 kg/m2). Age at the time of the interview was determined for categorization into three age groups (10–12 years-old, 13–15 years-old, and 16–18 years-old). Area of residence was categorized as urban (within an administrative division of a city) or rural (outside the administrative division of a city). Nonsmokers were those who said they had never smoked tobacco, and all others as smokers. Nondrinkers were those who said they never drank alcohol, and all others as drinkers. Data on alcohol and tobacco consumption were collected confidentially, so that parents did not know the answers. Regular walking was defined as indoor or outdoor walking for at least 30 minutes at a time, at least 3 times per week. Regular exercise was defined as exercising at least 5 times per week (≥ 30 minutes per session) in moderate activities (swimming slowly, playing doubles tennis or volleyball, or performing occupational or recreational activities while carrying light objects), or exercising at least 3 times per week (≥ 20 minutes per session) in vigorous activities (running, climbing, cycling fast, swimming fast, football, basketball, squash or singles tennis, jumping rope, or performing occupational or recreational activities while carrying heavy objects).
Measurement of BP
BP was measured while subjects were seated following a 5 minutes rest period, and the reported value is the average of 3 measurements with a mercury sphygmomanometer on the right arm.19 Hypertension was defined by a DBP of at least 90 mmHg or a SBP of at least 140 mmHg. None of the adolescent subjects reported current use of an antihypertensive medication. Prehypertension was defined by a DBP of at least 80 mmHg (but below 90 mmHg), or a SBP of at least 120 mmHg (but below 140 mmHg). Prehypertension was treated as a dichotomous variable, and DBP and SBP as continuous variables.
Measurement of creatinine and hemoglobin
Serum creatinine was measured by the kinetic Jaffe method using an autoanalyzer (model 7600; Hitachi, Tokyo, Japan). Blood hemoglobin was measured with an XE-2100D Hematology Analyzer (Sysmex, Tokyo, Japan).
Measurement of lead and cadmium in whole blood
To measure PbB and CdB levels, 3 mL samples were drawn into BD vacutainer tubes containing EDTA for trace-element determination (K2 EDTA tube, Vacutainers®; Becton Dickinson, Franklin Lakes, NJ, USA). PbB and CdB were measured by graphite furnace atomic absorption spectrometry with Zeeman background correction (Perkin Elmer AAnalyst 600; Perkin Elmer, Turku, Finland).
Analysis of all blood metals was performed by the Neodin Medical Institute, a laboratory certified by the Korea Ministry of Health and Welfare. For internal quality assurance and control, commercial reference materials were used (Lyphochek® Whole Blood Metals Control; Bio-Rad, Hercules, CA, USA); the coefficients of variation were 2.65% to 6.50% (lead) and 0.95% to 4.82% (cadmium). As part of external quality assurance and control, this institute passed the German External Quality Assessment Scheme (operated by Friedrich-Alexander University) and the Quality Assurance Program (operated by the Korea Occupational Safety and Health Agency). The institute was also certified by the Ministry of Labor as one of the designated laboratories for analysis of specific chemicals, including heavy metals and certain organic chemicals. The method detection limits were 0.207 µg/dL for lead and 0.081 µg/L for cadmium. All samples were above these detection limits.
Statistical analysis
Statistical analyses were performed using SAS (Version 9.4; SAS Institute, Cary, NC, USA) and SUDAAN (Release 11.0; Research Triangle Institute, Research Triangle Park, NC, USA), a software package that incorporates sample weights and adjusts analyses for complex sample design. Survey sample weights were used in all analyses to produce estimates that were representative of the non-institutionalized civilian population of Korea.
The levels of PbB and CdB were log2-transformed because their distributions were positively skewed. Adjusted geometric means (GMs) and 95% confidence intervals (CIs) are reported according to sex, age group, residence area, smoking status, drinking status, hypertensive status, and year of examination by using the Proc Regress function in SUDAAN (Research Triangle Institute).
To estimate the adjusted mean differences in DBP and SBP associated with doubling of PbB and CdB levels, the BP was regressed against log2-transformed blood metal concentration, with adjustment of covariates. Quartiles of PbB and CdB levels were also used as independent variables to examine their association with BP in multiple regression analysis (with covariate adjustment). The covariates were sex, age, residence area, smoking status, drinking status, BMI, year of measurement, physical activities, hemoglobin, and serum creatinine. Next, odds ratios (ORs) and 95% CIs for prehypertension (90 > DBP ≥ 80 mmHg or 140 > SBP ≥ 120 mmHg) were calculated for log2-transformed PbB and CdB levels and for quartiles of the two metals after adjustment of the same covariates as in the logistic regression analyses. The association of the combined level of PbB and CdB (lead + cadmium) with BP was assessed by creating 2 categorical variables: lowest quartile of lead + cadmium and highest quartile of lead + cadmium. Then, multiple logistic regression analysis was performed to investigate the association of the lead + cadmium level with the risk of prehypertension.
RESULTS
Table 1 shows the adjusted GMs and 95% CIs of PbB and CdB levels of subjects in different categories. The overall GM of PbB was 1.192 μg/dL and that of CdB was 0.317 μg/L. Males had a higher PbB level (1.308 μg/dL vs. 1.073 μg/dL), but there was no sex difference in CdB level (0.322 μg/L vs. 0.311 μg/L). There was a trend of decreasing PbB level during the study period, and CdB level in 2010 was higher than in all other years. PbB level declined with increasing age, whereas CdB level increased with increasing age. There was no significant difference in the blood metal level of adolescents living in rural and urban areas. The PbB and CdB levels were unrelated to performance of regular exercise or regular walking. The PbB and CdB levels were greater in smokers than non-smokers, but alcohol consumption had no effect. The prehypertensive and normotensive groups had similar mean levels of PbB and CdB.
Table 1
Means and 95% CI of PbB and CdB of adolescent by classification variables according to KNHANES 2010–2016
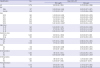
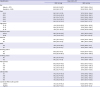
Table 2 shows the relationships of different variables with BP in the adolescent study subjects. Males, older individuals, and those in the highest quartile of lead + cadmium were more likely to have high SBP. Subjects in the third quartile of lead or cadmium were more likely to have low DBP.
Table 2
Means and 95% CIs of DBP and SBP of adolescent by classification variables according to KNHANES 2010–2016
We regressed DBP and SBP against log2-transformed PbB concentration (a continuous independent variable), with adjustment for covariates, to estimate adjusted mean differences in DBP and SBP associated with a doubling of PbB (Table 3). We also performed multiple regression analysis, with adjustment for covariates, to assess the association of PbB quartiles and CdB quartiles with BP. The results indicate no significant association of PbB level or CdB level with SBP or DBP.
Table 3
Differences (95% CIs) in diastolic and SBP by PbB and CdB level (continuous and quartile values) after covariate adjustmenta
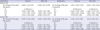
PbB quartile are presented as < 1.07, 1.07–1.341, 1.342–1.655, > 1.655 µg/dL for male; < 0.839, 0.839–1.076, 1.077–1.371, > 1.371 µg/dL for female. CdB quartile are presented as < 0.223, 0.223–0.319, 0.320–0.451, > 0.451 µg/L for male; < 0.225, 0.225–0.310, 0.311–0.440, > 0.441 µg/L for female.
CI = confidence interval, SBP = systolic blood pressure, PbB = blood lead, CdB = blood cadmium, DPB = diastolic blood pressure, BMI = body mass index.
aAdjusted for sex, year, age, residence area, smoking and drinking status, physical activities, serum creatinine, BMI, and hemoglobin; bMean differences in systolic and diastolic pressure with doubling of the PbB levels.
We also calculated the ORs and 95% CIs for prehypertension for PbB and CdB levels and their quartiles (Table 4). As above, the results indicate no association of PbB level or CdB level with the risk of prehypertension. A logistic regression analysis that used quartiles of blood metals as an independent variable indicated no association with the risk of prehypertension. There were no associations of metal levels with the risk for prehypertension after adjustment for PbB or CdB.
Table 4
OR (95% CI) for having prehypertension by PbB and CdB level (continuous and quartile values) after covariate adjustmenta

PbB quartile are presented as < 1.07, 1.07–1.341, 1.342–1.655, > 1.655 µg/dL for male; < 0.839, 0.839–1.076, 1.077–1.371, > 1.371 µg/dL for female. CdB quartile are presented as < 0.223, 0.223–0.319, 0.320–0.451, > 0.451 µg/L for male; < 0.225, 0.225–0.310, 0.311–0.440, > 0.441 µg/L for female.
OR = odds ratio, CI = confidence interval, PbB = blood lead, CdB = blood cadmium, BMI = body mass index.
aAdjusted for sex, year, age, residence area, smoking and drinking status, physical activities, serum creatinine, BMI, and hemoglobin; bOR (95% CI) for having hypertension with doubling of the CdB levels.
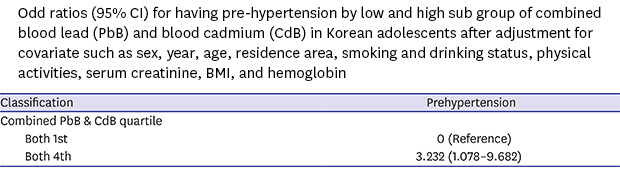
Logistic regression analysis comparing subjects in the highest and lowest quartiles of PbB + CdB, with covariate adjustment, indicated a significant risk for prehypertension for those in the highest quartile (OR, 3.232; 95% CI, 1.078–9.682) (Table 5).

DISCUSSION
The overall GM PbB level was 1.192 μg/dL in our adolescent subjects. This is higher than reported in the recent U.S. National Health and Nutrition Examination Survey (NHANES) for those aged 12–19 years-old (0.680 µg/dL in 2009–2010 and 0.554 µg/dL in 2011–2012).20 The different environments of Korea and the U.S. may explain these differences. Previous studies have also reported higher PbB levels in males than females.2021 In recent years, exposure to lead has decreased substantially in Korea, mostly due to public health measures to eliminate environmental sources including phasing out of leaded gasoline in 1986, and PbB levels have declined steadily since then,22 with a more rapid decline in the early 2000s.23 The present study also indicated that PbB levels declined in Korean adolescents from 2010 to 2016. In the present study, PbB level declined with increasing age among adolescents, in agreement with previous studies.182024 Increased biological need for iron among children, which also increase lead absorption and then PbB level, return to normal level in adolescents, and thus showing decreasing tendency of PbB concentration in adolescents. However, PbB concentration increases with age since late adolescents.182024
In general, urban environments are more polluted than rural areas, and industrialization increases exposures directly through emissions and indirectly through its products.25 However, there is a recent trend in Korea of building factories in rural areas rather than urban areas. In addition, urban areas tend to have higher socioeconomic status than rural areas, and thus, the PbB levels of adolescents living in rural tend to be higher than those in urban areas.
The overall GM CdB level was 0.317 μg/L in our adolescent subjects. The CdB level was not reported for those aged 12–19 years in the U.S. NHANES study, because many of the results were below the limit of detection; however, it is likely that our subjects had higher CdB levels that U.S. adolescents because Korean adults have higher CdB levels than U.S. adults.20 Previous studies have reported higher CdB levels in female adults than male adults,2124 but we found no sex differences in Korean adolescents. Our findings that older adolescents and smokers had higher CdB levels are consistent with previous reports.18212426 Moon et al.27 studied the general population of Korea and found that diet was the main source of cadmium exposure, but cigarette smoking is also a well-known source of cadmium exposure.26 Several previous studies of Asian populations found that CdB levels were higher in subjects from northeastern Asia (Korea, Japan, and China) than in Western countries, possibly because of the lower consumption of rice in the West.2728 Thus, additional environmental protection measures and education on maintaining a healthy lifestyle are needed so the Korean general population is protected from further exposure to this heavy metal.
A high PbB level is well known to be associated with hypertension in adults,329 but few studies have evaluated its effects on BP in adolescents. One study reported that young adults with high childhood PbB levels had higher bone lead and 3–4 mmHg higher SBP and DBP.7 The Oswego Children's Study reported that umbilical cord PbB level was positively associated with higher BP at age 9.5 years, and that early-childhood PbB (mean age, 2.6 years) was associated with increased BP in response to acute stress tasks at 9.5 years of age, particularly in children with low socioeconomic status.8 Other studies of PbB in children found it had no effect on BP.1011 The onset of a cardiovascular or other disease in adulthood due to lead exposure in childhood has not been sufficiently studied.29 National Toxicology Program recently conclude that there is inadequate evidence for lead effects on BP or hypertension in children.29
Previous studies demonstrated that elevated CdB level is associated with hypertension in adults,46141516 but there have been no such clinical or epidemiological studies of children or adolescents.30
To our best knowledge, the present study is the first to identify an association of prehypertension with the combined level of PbB and CdB in adolescents. However, our analysis showed that an elevated level of lead or cadmium was not significantly associated with increased BP or prehypertension in Korean adolescents. An elevated level of CdB tended to be associated with increased BP or prehypertension although it is not statistically significant. An elevated level of cadmium + lead was significantly associated with prehypertension in these study subjects. These results are in line with our previous study of Korean adults showing that CdB + PbB levels had a stronger association with elevated BP and risk of hypertension than each individual metal level, and that CdB levels had a stronger association than PbB levels in adults.6 Our finding suggests that the association of blood metal levels with BP is weaker in adolescents compared to those in adults. Although mechanisms for the association of combined level of PbB and CdB with increased risk of prehypertension are poorly understood, we suggest two reasons for this difference between adults and adolescents. First, adolescents have lower blood levels of these heavy metals because they do not work in environments where they are common contaminants. Second, hypertension is much rarer in adolescents than adults. Thus, the association of cadmium alone and lead alone with BP were not significant, but an elevated combined level of cadmium and lead was associated with prehypertension.
Previous in vivo and in vitro studies have shown that chronic exposure to lead causes hypertension and cardiovascular disease by promoting oxidative stress and limiting nitric oxide availability.31 General population studies have reported inverse associations between estimated glomerular filtration rate and PbB levels below 5 μg/dL,32 and this impaired renal function could lead to hypertension.
The biological mechanisms responsible for the association of CdB level with increased BP and hypertension are uncertain. It is possible that the well-established nephrotoxic effects of cadmium explain this effect.114 In particular, the glomerular membrane filters the cadmium-metallothionein complex, which is then transported from the blood to the renal tubular cells.33 In renal cells, the cadmium-metallothionein complex enters the lysosomes, which release cadmium into the cytosol and degrade metallothionein. Cadmium that is not bound to metallothionein can injure the renal tubules,1 and lead to salt retention, volume overload, and eventually hypertension.1 This cadmium-induced kidney toxicity can proceed concurrently with renal tubular and glomerular damage, even at low cadmium concentrations.34 However, our data indicated no association of CdB level with nephrotoxicity. Cadmium can also cause inflammation and facilitate atherosclerosis, also have vascular effects.35
The present findings, which indicate that the combined level of PbB and CdB is associated with the risk of prehypertension of Korean adolescents, have important public health implications. Prehypertension among adolescents presents a clear risk for future persistent hypertension and cardiovascular disease in adults. Prehypertension may also be associated with ongoing cardiovascular changes in adolescents.36 Small increases in BP levels at the population level can have a substantial public health impact by increasing the risk of hypertension and incident cardiovascular disease.37 Our results suggest that public health policies should also consider the effect of combined exposures, which may be frequently observed in living and working environment.38
This study also had some limitations. First, our results are based on cross-sectional analysis, similar to many previous reports. Therefore, we did not identify temporal relationships and cannot establish causality of the reported associations because there may be unidentified intermediary factors. Second, the KNHANES does not consider urinary cadmium (half-life of 15–30 years) as a biomarker of lifetime exposure to cadmium139; instead, it considers CdB (half-life of 3–4 months) as the most valid biomarker for recent cadmium exposure.140 Third, the PbB concentrations reported here indicate recent exposure, and do not reflect the total body burden over the subjects' lifetimes. Further studies of bone lead with X-ray fluorescence, which indicates long-term cumulative exposures, are needed.2 Finally, mechanisms for the association of combined level of PbB and CdB with increased risk of prehypertension are poorly understood.
The strengths of this study are that we used a representative sample of the general adolescent population of Korea, we applied rigorous quality controls to the procedures used in the KNHANES, and we adjusted for most potential confounders and effect modifiers (sex, age, residence area, smoking and drinking status, BMI, physical activity, hemoglobin, serum creatinine, and concurrent exposure to other heavy metals).
In conclusion, our study of adolescents in Korea showed that the combined level of PbB and CdB is associated with increased risk of prehypertension.
 XML Download