

 PDF
PDF Citation
 Print
Print


INTRODUCTION
Cancer remains one of the leading causes of death in children and adolescents, although childhood cancer accounts for only a small part of the global cancer burden. Thanks to remarkable progress in the diagnosis and treatment of childhood cancer, the overall survival (OS) of childhood cancer has improved dramatically in recent decades. According to the statistics from the American Cancer Society in 2014, the 5-year survival rates for pediatric cancer exceeded 80% in developed countries.1 A multidisciplinary team approach, together with sophisticated risk stratification, has achieved notable advances in this field.
Behind these success stories, relapse or progression still occurs in a significant proportion of cases. Among the children that enrolled in the US Childhood Cancer Survivor Study, relapse or progression of the original cancer was the leading cause of late mortality, accounting for 58% of deaths.1 The prognosis of relapsed/progressed childhood cancer remains unfavorable, particularly for cases with certain solid tumors, such as neuroblastoma and bone and soft tissue sarcomas.2 Numerous attempts have been made to improve the prognosis, and high-dose chemotherapy and autologous stem cell transplantation (HDCT/auto-SCT) has played an important role in some tumors.34 However, the survival rates for most relapsed/progressed solid tumors have been generally stagnant for almost 30 years.5
Despite the poor prognosis, published studies addressing the outcome of relapsed/progressed pediatric solid tumors in large patient cohorts are scarce. An Italian study published in 2006 provides the latest comprehensive data regarding the survival of children with relapsed/progressed solid tumors.5 For this reason, in the present study, we aimed to estimate the OS and progression-free survival (PFS) of relapsed/progressed cases of entire solid tumors, to explore prognostic factors, and to help identify potential candidates for future studies.
METHODS
Patients
We reviewed the medical records of all patients with solid tumors who experienced relapse/progression during or after first-line treatment at Samsung Medical Center between 1996 and 2016. The subjects were retrospectively identified through a survey of our institutional database. Patients whose tumor relapsed after surgery alone (without previous history of chemotherapy), those with low-grade glial tumors, those who were transferred to our center during salvage treatment, and those who refused salvage treatment were excluded from the analysis. During the study period, patients except those with unilateral retinoblastoma or initially low-risk tumors and those with organ dysfunction were recommended to undergo HDCT/auto-SCT if they remained progression-free during salvage treatment. For patients who failed tandem HDCT/auto-SCT, allogeneic stem cell transplantation (allo-SCT) was recommended if they remained progression-free during salvage treatment. Conventional chemotherapy was administered in order to reduce the tumor burden as much as possible prior to SCT. Salvage chemotherapy regimens were selected, and changed if necessary, depending on the regimens used prior to relapse/progression, tolerability to first-line salvage chemotherapy, and response to first-line salvage chemotherapy. Surgery was conducted to reduce the tumor burden whenever possible. Radiotherapy (RT) was also administered to relapsed or metastatic sites whenever possible. RT dose and volume were determined according to previous RT prior to relapse/progression.67 A detailed review of the clinical data was performed to ascertain the presenting features, degree of surgical resection, pathology, chemotherapy regimen, RT, the response to salvage treatment, and any events (relapse/progression, second malignancy, treatment-related mortality, and death).
Response and toxicity criteria
We evaluated the treatment response using computed tomography, magnetic resonance imaging, various radioisotope scans, and bone marrow examination. We categorized the disease response as follows: 1) progressive disease (PD): greater than 25% increase in tumor size or the appearance of a new tumor; 2) stable disease (SD): less than 50% reduction in tumor size or less than 25% increase in tumor size; 3) partial response (PR): greater than 50% decrease in tumor size; and 4) complete response (CR): complete disappearance of all previously measurable tumors. For neuroblastomas, the international response criteria for neuroblastoma were used to evaluate the treatment response.8
Statistics
PFS was calculated from the date of first relapse/progression until the occurrence of second relapse/progression or last contact if the patient remained progression-free. OS was calculated from the date of initial relapse/progression until death from any cause or last contact if the patient remained alive. Survival rates and standard errors were estimated using the Kaplan-Meier method, and comparison of survival rates among groups were performed through the log-rank test. Multivariate analysis for survival was performed with Cox proportional hazards model. P values less than 0.05 were considered significant.
RESULTS
Patient characteristics
Table 1 lists the clinical characteristics of 258 patients (148 boys and 110 girls) who met the inclusion criteria. Sixty-one (23.6%) patients had brain tumors, 64 (24.8%) had neuroblastomas, 74 (28.7%) had bone and soft tissue sarcomas, 12 (4.7%) had Wilms tumor, 15 (5.8%) had retinoblastoma, and the remaining 32 (12.4%) had other tumors. The median age at the time of initial diagnosis and at the time of first relapse/progression was 5.6 years (range, 0.0−27.1) and 8.1 years (range, 0.7−27.7), respectively. The median interval between the initial diagnosis and first relapse/progression was 1.3 years (range, 0.1–7.8). Of the total 258 patients, 80 (31.0%) patients had a previous history of HDCT/auto-SCT during initial treatment course.
Table 1
Patient characteristics
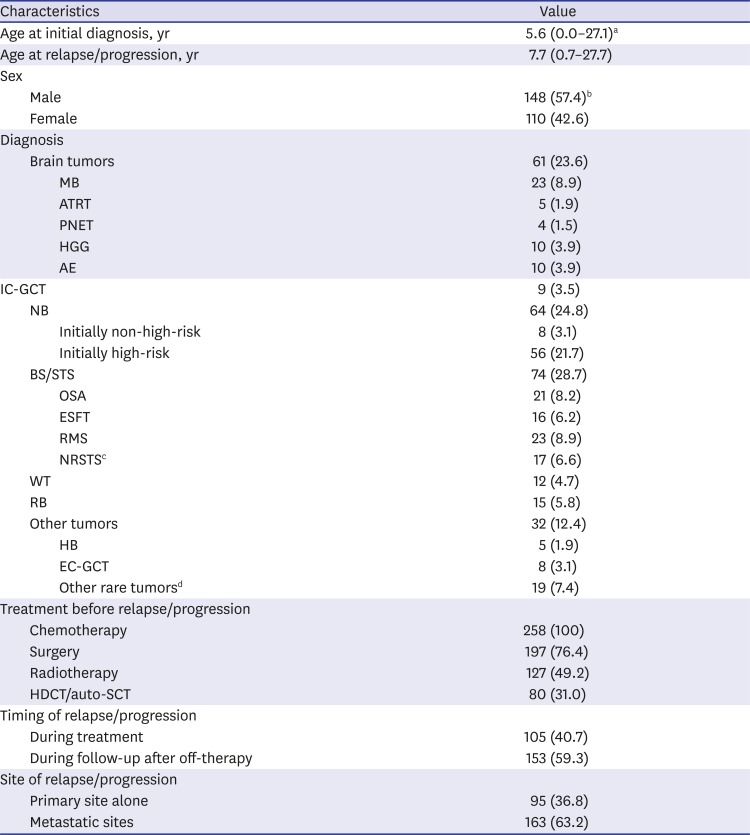
MB = medulloblastoma, ATRT = atypical teratoid/rhabdoid tumor, PNET = primitive neuroectodermal tumor, HGG = high-grade glioma, AE = anaplastic ependymoma, IC-GCT = intracranial germ cell tumor, NB = neuroblastoma, BS/STS = bone and soft tissue sarcoma, OSA = osteosarcoma, ESFT = Ewing sarcoma family of tumor, RMS = rhabdomyosarcoma, NRSTS = non-rhabdomyomatous soft tissue sarcoma, WT = Wilms tumor, RB = retinoblastoma, HB = hepatoblastoma, EC-GCT = extracranial germ cell tumor, HDCT/auto-SCT = high-dose chemotherapy and autologous stem cell transplantation.
aMedian (range); bNumber (%); cNRSTS includes synovial sarcoma in 3, desmoplastic small round cell tumor in 3, malignant peripheral nerve sheath tumor in 3, alveolar soft part sarcoma in 2, epitheloid sarcoma in 1, malignant fibrous histiocytoma in 1, and spindle cell sarcoma in 1; dOther rare tumors include malignant rhabdoid tumor in 3, renal cell carcinoma in 2, clear cell sarcoma in 2, hepatocellular carcinoma in 2, nasopharyngeal carcinoma in 2, adenoid cystic carcinoma in 1, adrenal cortical carcinoma in 1, congenital mesoblastic nephroma in 1, malignant triton tumor in 1, pancreatic carcinoma in 1, poorly differentiated carcinoma in 1, and rectal carcinoma in 1.
Salvage treatment and general outcome
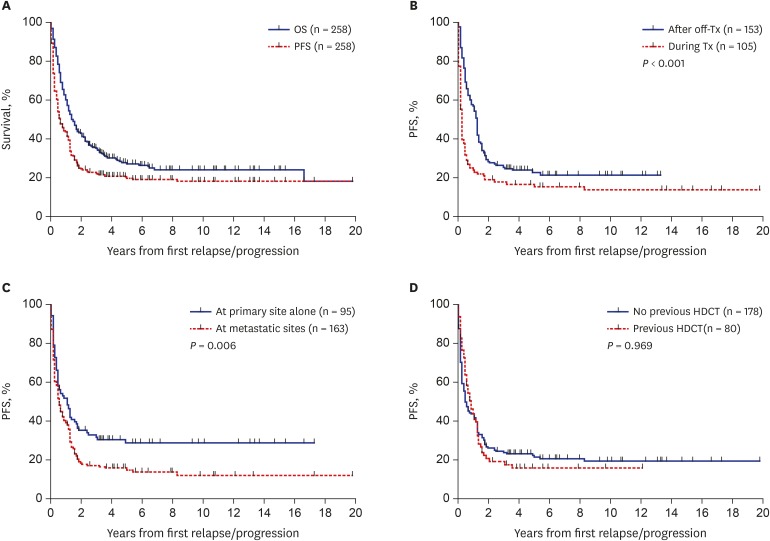
With regard to the type of salvage therapy, 227 (88.0%) of the 258 patients received salvage chemotherapy, 106 (41.1%) underwent surgery, and 100 (38.8%) received RT. A schematic flowchart of the total 258 patients is shown in Fig. 1. Of the 60 patients who remained progression-free during first-line salvage treatment, 26 went off therapy without HDCT/auto-SCT, 26 proceeded to HDCT/auto-SCT (1 of them underwent allo-SCT following HDCT/auto-SCT), and 8 proceeded to allo-SCT. Of the 198 patients who experienced relapse/progression again during first-line salvage treatment, 49 gave up further treatment and the remaining 149 received second-line salvage treatment. Of these 149 patients, 10 went off therapy without subsequent HDCT/auto-SCT, 58 experienced relapse/progression again and gave up further treatment, 50 proceeded to HDCT/auto-SCT (4 of them underwent allo-SCT following HDCT/auto-SCT), and 31 proceeded to allo-SCT, regardless of the response to second-line salvage treatment. Therefore, 76 (29.5%) of 258 patients underwent HDCT/auto-SCT and 44 (17.1%) underwent allo-SCT. As a result, 56 of the 258 patients remained progression-free and 71 patients survived during a median follow-up of 5.9 years (range, 1.7–19.8) from first relapse/progression. The 10-year OS and PFS for the total 258 patients were 24.5% ± 3.0% and 18.4% ± 2.7%, respectively (Fig. 2A).
Fig. 1
Flow of patients. A flow of 258 patients were illustrated.
Tx = treatment, PD = progressive disease, HDCT = high-dose chemotherapy, auto-SCT = autologous stem cell transplantation, allo-SCT = allogeneic stem cell transplantation.
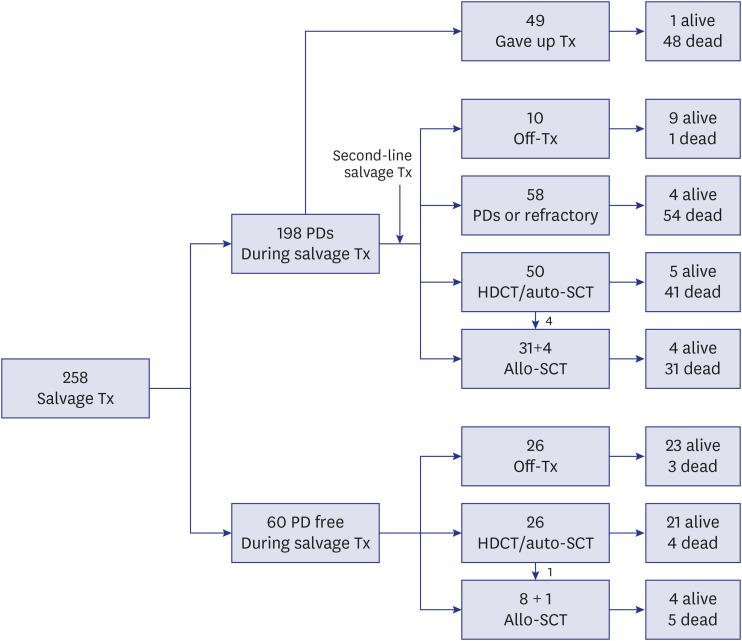
Fig. 2
Survival rates according to the findings at relapse/progression. (A) OS and PFS in all 258 patients. (B) PFS according to the timing of relapse/progression. (C) PFS according to the site of relapse/progression. (D) PFS according to the previous history of HDCT/auto-SCT.
OS = overall survival, PFS = progression-free survival, HDCT/auto-SCT = high-dose chemotherapy and autologous stem cell transplantation, Tx = treatment.
Outcomes according to the findings at first relapse/progression
We analyzed the outcomes according to the findings at first relapse/progression: timing of relapse/progression, patterns of relapse/progression, and previous history of HDCT/auto-SCT. Patients who experienced relapse/progression during follow-up after off-therapy showed significantly higher PFS and OS than those who experienced relapse/progression during initial treatment (10-year PFS: 21.8% ± 3.6% vs. 14.0% ± 3.7%, P < 0.001, Fig. 2B; 10-year OS: 28.4% ± 4.2% vs. 19.0% ± 4.0%, P < 0.001). Patients with local relapse/progression alone showed significantly higher PFS and OS than those with metastatic relapse/progression (10-year PFS: 28.8% ± 4.9% vs. 12.1% ± 3.0%, P = 0.006, Fig. 2C; 10-year OS: 37.2% ± 5.5% vs. 17.0% ± 3.3%, P < 0.001). However, no significant difference in the PFS and OS was noted between patients who had a previous history of HDCT/auto-SCT and those who did not (10-year PFS: 19.6% ± 3.2% vs. 16.1% ± 4.4%, P = 0.969, Fig. 2D; 10-year OS: 26.6% ± 3.6% vs. 21.2% ± 5.0%, P = 0.199).
Outcomes according to histologic type
PFS and OS rates according to the histologic diagnosis were summarized in Tables 2 and 3, respectively. We classified the 258 patients into six tumor groups according to histologic diagnosis: brain tumors, neuroblastoma, bone and soft tissue sarcomas, Wilms tumor, retinoblastoma and other tumors. Fig. 3 shows survival rates in each histologic group and subgroup. When brain tumors were further classified into six subgroups according to the histologic diagnosis, survival rates were relatively higher in patients with anaplastic ependymoma (10-year PFS: 50.0% ± 15.8%, Fig. 3B; 10-year OS: 28.0% ± 21.6%). No patients with primitive neuroectodermal tumors (PNETs) or high-grade gliomas remained progression-free. When neuroblastomas were classified into two subgroups, i.e., initially non-high-risk and initially high-risk tumors, patients with initially non-high-risk neuroblastomas showed higher PFS and OS than those with initially high-risk neuroblastomas (10-year PFS: 62.5% ± 21.4% vs. 9.7% ± 4.3%, P < 0.001, Fig. 3D; 10-year OS: 45.0% ± 18.8% vs. 14.5% ± 4.9%, P = 0.009). When bone and soft tissue sarcomas were divided into four subgroups — osteosarcoma, Ewing sarcoma family of tumors (ESFTs), rhabdomyosarcoma, and non-rhabdomyosarcoma soft tissue sarcomas (NRSTSs) — PFS and OS were highest among patients with osteosarcomas (10-year PFS: 25.0% ± 10.6% Fig. 3F; 10-year OS: 29.0% ± 10.9%). No patients with ESFTs remained progression-free after first relapse/progression. Survival rates in patients with Wilms tumor were encouraging (10-year PFS: 58.3% ± 14.2% Fig. 3G; 10-year OS: 65.6% ± 14.0%). PFS in patients with retinoblastoma was not satisfactory; however, many patients remain alive after enucleation of involved eye (10-year PFS: 22.2% ± 12.2% and 10-year OS: 78.3% ± 11.2%, Fig. 3H). When the ‘other tumors’ were classified into three subgroups — hepatoblastoma, extracranial germ cell tumors, and the remaining rare tumors — there was no significant difference in survival rates (Fig. 3I and J).
Table 2
10-year PFS according to patient characteristics
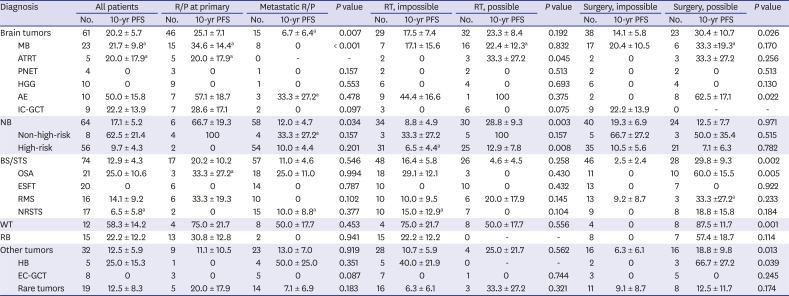
PFS = progression-free survival, R/P = relapse/progression, MB = medulloblastoma, ATRT = atypical teratoid/rhabdoid tumor, PNET = primitive neuroectodermal tumor, HGG = high-grade glioma, AE = anaplastic ependymoma, IC-GCT = intracranial germ cell tumor, NB = neuroblastoma, BS/STS = bone and soft tissue sarcoma, OSA = osteosarcoma, ESFT = Ewing sarcoma family of tumors, RMS = rhabdomyosarcoma, NRSTS = non-rhabdomyomatous soft tissue sarcoma, WT = Wilms tumor, RB = retinoblastoma, HB = hepatoblastoma, EC-GCT = extracranial germ cell tumor.
aThe longest follow-up duration of survivors was less than 10 years.
Table 3
10-year OS according to patient characteristics
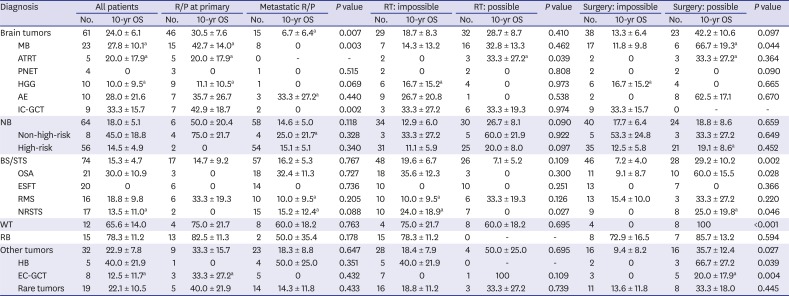
OS = overall survival, R/P = relapse/progression, MB = medulloblastoma, ATRT = atypical teratoid/rhabdoid tumor, PNET = primitive neuroectodermal tumor, HGG = high-grade glioma, AE = anaplastic ependymoma, IC-GCT = intracranial germ cell tumor, NB = neuroblastoma, BS/STS = bone and soft tissue sarcoma, OSA = osteosarcoma, ESFT = Ewing sarcoma family of tumors, RMS = rhabdomyosarcoma, NRSTS = non-rhabdomyomatous soft tissue sarcoma, WT = Wilms tumor, RB = retinoblastoma, HB = hepatoblastoma, EC-GCT = extracranial germ cell tumor.
aThe longest follow-up duration of survivors was less than 10 years.
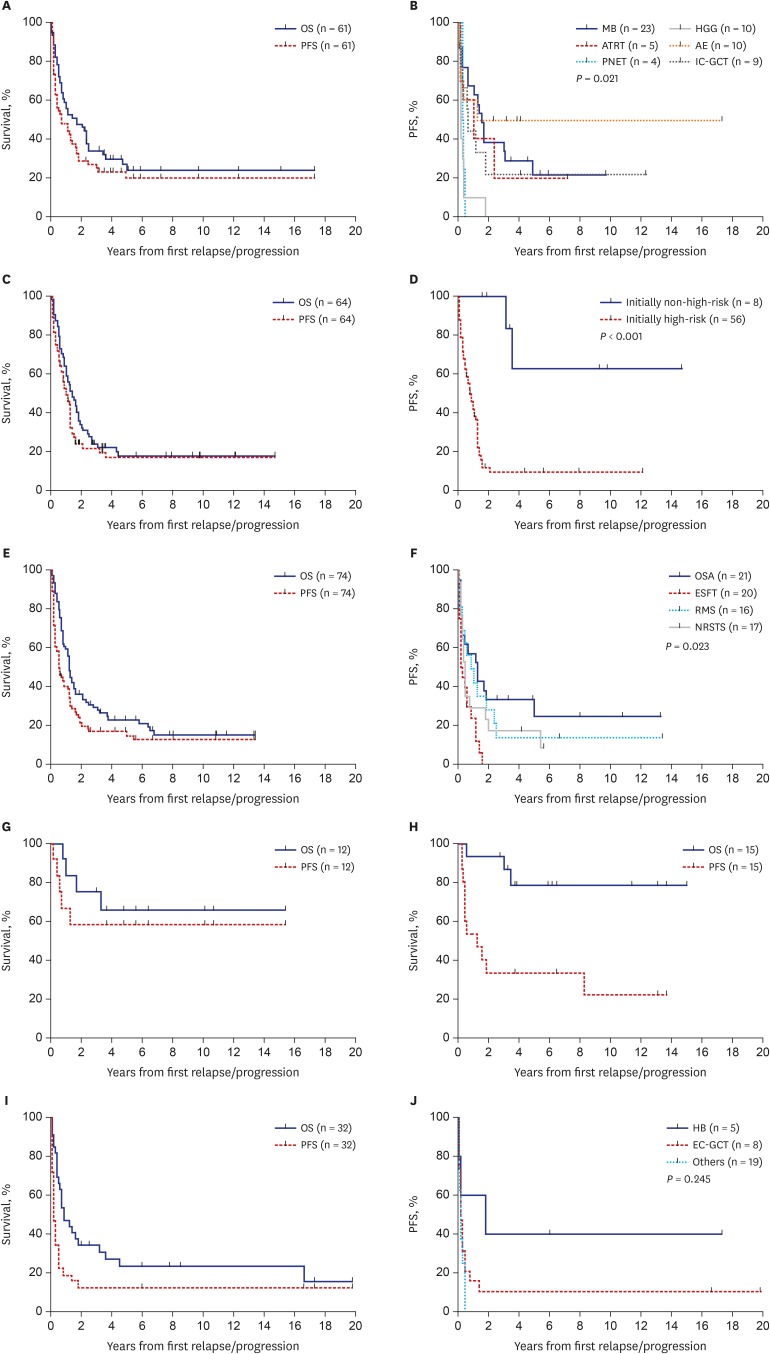
Fig. 3
Survival rates according to histologic diagnosis. (A) OS and PFS in patients with brain tumors. (B) PFS according to the histologic diagnosis in patients with brain tumors. (C) OS and PFS in patients with neuroblastomas. (D) PFS according to the initial risk in patients with neuroblastomas. (E) OS and PFS in patients with bone and soft tissue sarcomas. (F) PFS according to the histologic diagnosis in patients with bone and soft tissue sarcomas. (G) OS and PFS in patients with Wilms tumor. (H) OS and PFS in patients with retinoblastoma. (I) OS and PFS in patients with other tumors. (J) PFS according to the histologic diagnosis in patients with other tumors.
OS = overall survival, PFS = progression-free survival, MB = medulloblastoma, HGG = high-grade glioma, ATRT = atypical teratoid/rhabdoid tumor, AE = anaplastic ependymoma, PNET = primitive neuroectodermal tumor, IC-GCT = intracranial germ cell tumor, OSA = osteosarcoma, ESFT = Ewing sarcoma family of tumor, RMS = rhabdomyosarcoma, NRSTS = non-rhabdomyomatous soft tissue sarcoma, HB = hepatoblastoma, EC-GCT = extracranial germ cell tumor.
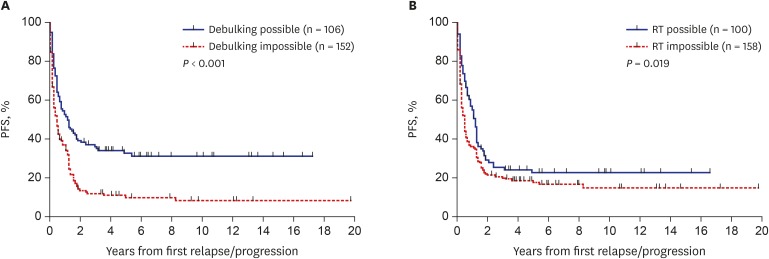
Outcomes according to treatment after relapse/progression
Outcomes according to the type of salvage treatment provided after relapse/progression were analyzed. The PFS and OS of the 106 patients who underwent debulking surgeries were higher than those who did not (10-year PFS: 31.6% ± 4.7% vs. 8.8% ± 2.7%, P < 0.001, Fig. 4A; 10-year OS: 38.7% ± 5.3% vs. 14.5% ± 3.2%, P < 0.001). Surgery was a significant prognostic factor for PFS in patients with anaplastic ependymoma, osteosarcoma, Wilms tumor, or hepatoblastoma (Table 2). Surgery was also a significant prognostic factor for OS in patients with medulloblastoma, osteosarcoma, NRSTS, Wilms tumor, hepatoblastoma, or extracranial germ cell tumors (Table 3). The PFS of the 100 patients who received RT after the first relapse/progression was higher than that of patients who did not (10-year PFS: 23.0% ± 4.5% vs. 15.3% ± 3.2%, P = 0.019, Fig. 4B). However, there was no difference in OS between groups (10-year OS: 24.8% ± 4.7% vs. 24.3% ± 3.8%, P = 0.942). RT was a significant prognostic factor for PFS in patients with atypical teratoid/rhabdoid tumor or high-risk neuroblastoma (Table 2). RT was also a significant prognostic factor for OS in patients with atypical teratoid/rhabdoid tumor or NRSTS (Table 3).
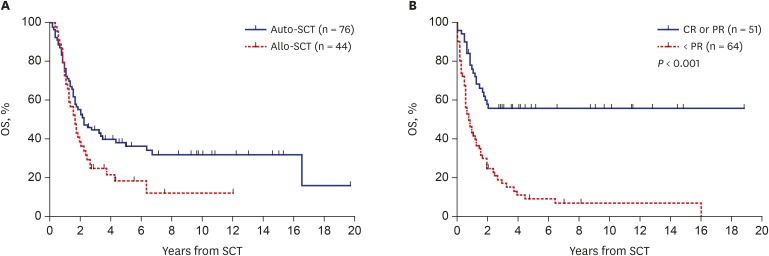
Outcomes after HDCT/auto-SCT and allo-SCT
The 10-year PFS and OS from SCT in 115 patients who underwent SCT were 20.2% ± 5.7% and 24.3% ± 6.1%, respectively. The 10-year PFS from HDCT/auto-SCT (n = 76) and allo-SCT (n = 44) were 30.9% ± 5.8% and 16.1% ± 6.8%, respectively. The 10-year OS from HDCT/auto-SCT and allo-SCT were 34.8% ± 5.8% and 14.4% ± 5.8%, respectively (Fig. 5A). Patients who were in CR/PR before SCT showed higher survival than those who were in SD/PD (10-year PFS: 52.1% ± 7.6% vs. 6.7% ± 3.7%, P < 0.001; 10-year OS: 54.8% ± 7.0% vs. 7.0% ± 3.5%, P < 0.001, Fig. 5B). When the data were analyzed separately according to the type of SCT, tumor status before SCT was important for both types of SCT. Patients in CR/PR before HDCT/auto-SCT showed higher survival than those in SD/PD (10-year PFS: 62.7% ± 9.2% vs. 8.5% ± 4.6%, P < 0.001; 10-year OS: 66.5% ± 8.2% vs. 7.3% ± 4.5%, P < 0.001). Patients in CR/PR before allo-SCT also showed higher survival than those in SD/PD (10-year PFS: 31.3% ± 11.6% vs. 0.0%, P = 0.256; 10-year OS: 31.6% ± 10.7% vs. 4.4% ± 4.3%, P = 0.024).
Fig. 5
Survival rates in patients who underwent SCT. (A) OS according to the type of SCT. (B) OS to the tumor status before SCT.
SCT = stem cell transplantation, OS = overall survival, auto-SCT = autologous stem cell transplantation, allo-SCT = allogeneic stem cell transplantation, CR = complete response, PR = partial response.
Multivariate analysis for PFS and OS
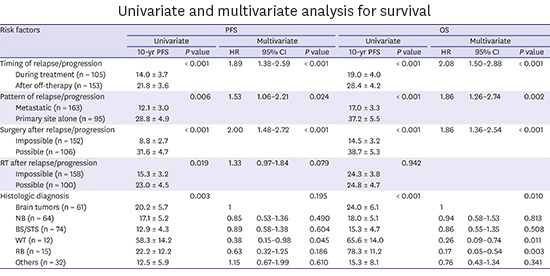
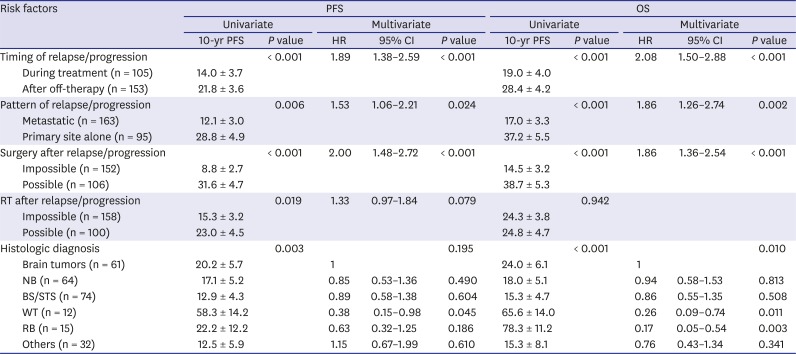
The multivariate analysis for PFS showed that relapse/progression during treatment, metastatic relapse/progression, impossible debulking surgery, and impossible RT were independent risk factors for poor prognosis. In multivariate analysis for OS, all factors mentioned above except impossible RT after relapse/progression retained poor prognostic significance (Table 4). In addition, histologic diagnosis was also an independent factor for OS and Wilms tumor and retinoblastoma showed favorable outcome as compared to brain tumors.
Table 4
Univariate and multivariate analysis for survival
DISCUSSION
The poor prognosis of relapsed/progressed solid tumors poses a major challenge in pediatric oncology. Compared with the fair survival rate observed in relapsed acute lymphoblastic leukemia or lymphoma in children and adolescents,9 only limited improvements have been made in the outcome of relapsed/progressed solid tumors. Nevertheless, few studies have actually conducted comprehensive analysis on a large group of pediatric patients with relapsed/progressed solid tumors. There lies the significance of our study — a 20-year, single-center study of relapsed/progressed solid tumors in children and adolescents.
In this study, outcomes of relapsed/progressed pediatric solid tumors still remain unfavorable and the 10-year OS and PFS of our cohort were 24.5% and 18.4%, respectively. Ceschel et al.,5 in a large multicenter cohort study published in 2006, reported the 10-year OS and event-free survival of children with relapsed solid tumors as 33% and 27%, respectively. Despite a lapse of over 10 years, survival rates observed in our study are lower than those reported by Ceschel et al.5 Three main explanations are conceivable. First, the study by Ceschel et al.5 set the inclusion criteria to only patients who experienced relapse during follow-up after off-therapy, while those who experienced relapse/progression during first-line treatment were not included. This could have contributed to a difference between the 2 studies, because relapse/progression during treatment is associated with worse survival.1011 Second, they also included patients with Hodgkin lymphoma, which accounted for 19% of their cohort. Hodgkin lymphoma has a relatively favorable prognosis even after relapse/progression, and their 10- and 15-year OS were 67% and 64%, respectively, significantly higher than the other types of solid tumors.5 Third, patients who experienced relapse during follow-up after surgery alone without chemotherapy were not included in our cohort; they are expected to show more favorable outcomes.
When outcomes according to the clinical findings at first relapse/progression were analyzed, metastatic relapse/progression and relapse/progression during treatment were independent poor prognostic factors. Patients who experienced relapse/progression during initial treatment exhibited significantly worse outcomes compared to those who experienced relapse/progression during follow-up after off-therapy. In fact, this was predictable, as relapse/progression during treatment implies aggressive tumor behavior and therapeutic refractoriness. The length of time from diagnosis to first relapse/progression has been demonstrated to be of prognostic value in multiple types of pediatric tumors as well.101213
When outcomes according to the treatment provided after first relapse/progression were analyzed, debulking surgery and RT after relapse/progression were independent prognostic factors in the multivariate analysis including histologic type as a variable, further highlighting the importance of local control in relapsed/progressed solid tumors. The significance of local control via surgery or RT has been previously suggested in several types of solid tumors.101114 A well-known example is the role of surgery in recurrent pulmonary metastases of osteosarcoma.1516 Although the prognostic significance of surgery and RT according to histologic subtype was different, surgery (repeated if necessary) and/or RT are generally recommended whenever feasible to reduce the tumor burden as much as possible.
In terms of tumor types, there were some noticeable findings on subgroup analysis. In brain tumors, no patients with PNET or high-grade gliomas remained progression-free while the outcome in patients with anaplastic ependymoma was encouraging. In neuroblastomas, outcome in initially non-high-risk tumors was very encouraging while the outcome in initially high-risk tumors was poor. Garaventa et al.,13 in a series of relapsed/progressed neuroblastomas, also mentioned the association between stage at diagnosis and survival after relapse/progression. In bone and soft tissue sarcomas, patients with osteosarcoma showed better survival than those with other sarcomas. In particular, all patients with ESFT experienced relapse/progression again. Wilms tumors and retinoblastomas showed a marked higher overall survival, consistent with the study by Ceschel et al.5 However, survival rates in patients with ‘other tumors’ were disappointing. Collectively, new, effective treatment strategies are needed to improve the outcome in tumors with dismal outcomes after relapse/progression.
In most patients, HDCT/auto-SCT or allo-SCT were recommended if the tumor remained progression-free after salvage treatment. Many patients with tumors under insufficient control also underwent SCT because no further effective treatment modality was available. However, our study showed that the tumor status before SCT had a crucial impact on the survival after SCT. Patients who reached CR or PR showed significantly higher survival than those in SD or PD. These results will provide additional evidence for a rational selection of patients for SCT after relapse/progression, considering significant risk and cost accompanying SCT. Allo-SCT was performed in cases with relapse/progression after tandem HDCT/auto-SCT, with an expectation of clinical response via graft-versus-tumor effect. As a result, a significant proportion of patients who failed tandem HDCT/auto-SCT survived after allo-SCT if the patients reached CR or PR before allo-SCT. These findings suggest that allo-SCT can be an effective treatment option in patients who failed HDCT/auto-SCT if they could achieve a good response to salvage treatment after relapse/progression.
In conclusion, the outcomes of relapsed/progressed pediatric solid tumors remain unsatisfactory, with limited improvements in recent decades. New, effective treatment strategies are needed to overcome limitations of current approaches. Targeted agents and cancer immunotherapies may become the mainstay of future therapies. Hopefully, the background data generated herein will be used in future clinical trials involving patients with relapsed/progressed solid tumors.
 XML Download