

 PDF
PDF Citation
 Print
Print


INTRODUCTION
Many of the patients admitted to the emergency department (ED) present with toxic exposure. According to domestic studies, patients visiting the emergency medical center with toxic exposure comprised 0.68%–5.5% of all visiting patients, and various causative substances and motives have also been reported.1 It is considered that these patients might be exposed arbitrarily or by others and the sources and underlying motives will also vary according to societal influence and times.234
In Korea, excluding patients with chronic toxic exposure, most patients with symptomatic acute toxic exposure requiring treatment are treated through the ED. Therefore, research on the characteristics of patients with acute toxic exposure visiting the ED is expected to be an important basis for the treatment of such patients.567 Several countries have already reported the characteristics of toxic exposure through the analysis of national databases.89 Korea has no national data because nationwide poisoning data are not collected yet and the majority of published data were single-center reports. In addition, the epidemiological characteristics of toxic exposure are expected to vary with the times, but the published studies are mostly analyses spanning single years.101112
Thus, the authors carried out this study to find out the epidemiological changes over time by extracting information related to poisoning through ED and insurance related databases already available nationwide. The aim of this study was to investigate and analyze the epidemiological characteristics of toxic exposure among patients who visited the ED during a period of 5 years based on nationwide data to serve as a basis for recommendations regarding treatment.
METHODS
Study design and database
This study was carried out by secondary data analysis using the database of the Korea Health Insurance Review and Assessment Service (HIRA) and the existing database of the National Emergency Department Information System (NEDIS). Korea is a country that implements a mandatory National Health Insurance that covers about 98% of the population. The HIRA is a claims-based database of the National Health Insurance. In this study we extracted the following data for each patient: the diagnosis, age, gender, antidote, lavage status, treatment period, route of visit, types of insurance in HIRA.1314 NEDIS is an emergency information network operated by the government (Ministry of Health and Welfare) that includes clinical and administrative data for all patients who have visited ED nationwide.15 In this study, we checked the total number of patients who visited ED by age and month in the NEDIS.
Data collection
The study period was five years from January 1, 2009 to December 31, 2013. The number of patients visiting EDs nationwide, the age groups, and the months of visit were extracted from the NEDIS database. In the HIRA database, we targeted EDs in public hospitals, and the data (inclusion criteria) of patients with toxic exposure were extracted based on the International Statistical Classification of Diseases and Related Health Problems 10th Revision (ICD-10) diagnoses (2015 version). The list of diagnoses is attached as an appendix (Appendix 1). In addition to poisoning by medication, all toxic substances causing toxic damage were studied, such as ingested caustic and irritating agents, natural poisons including plants or animals, and chemical agents. We identified and analyzed the patients' age, sex, month of visit, type of insurance, type of hospital visited, location of the hospital, route of visit, antidote used, and the treatment period according to the diagnoses.
Outcome measures
The general characteristics of the patients and the nature of the toxic exposure were identified. All statistical analyses were performed using SAS version 9.3 (SAS Institute, Cary, NC, USA), SPSS version 20.0 (IBM Corp., Armonk, NY, USA) and Excel (Microsoft Corporation, Redmond, WA, USA). One-way analysis of variance (ANOVA) was used for the frequency analysis, and the null hypotheses of no difference were rejected if P values were less than 0.05. The data were expressed as No. (%) or mean (standard deviation [SD]). Each group was compared by year.
RESULTS
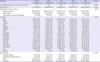
Based on the data extracted from the HIRA, during the study period (2009–2013); 310,159 (2009), 289,829 (2010), 288,906 (2011), 285,514 (2012), and 279,575 (2013) patients, respectively, visited EDs with diagnoses related to exposure to toxic substances. Similarly, during the study period (2009–2013), a total of 3,991,212; 4,184,174; 4,513,047; 5,733,827; and 6,783,619 visits to ED, respectively were identified in the NEDIS database. The epidemiologic characteristics of the patients were evaluated for patients identified through the HIRA database, and the total number of patients who visited EDs was examined using the NEDIS data in order to compare the characteristics among all patients who visited the EDs.
The number of patients who presented with acute toxic exposure compared to all ED visits significantly decreased consistently (7.8%, 6.9%, 6.0%, 5.0%, 4.1%) over 5 years. According to gender, both men and women showed similar rates. Regarding the type of insurance, the National Health Insurance accounted for the highest percentage each year. By region, Seoul and Gyeonggi Province showed the highest number of visits in order, and visits through emergency rescue teams accounted for about 0.4% (Table 1).
Table 1
General characteristics
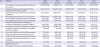
Regarding the cause of toxic exposure, substances other than drugs accounted for the largest percentage, which increased annually. Also, there was a high frequency of visits due to the aftermath of toxic damage, but this decreased rapidly every year. Toxic exposure caused by drugs, alcohol and food was next in rank. Among the drugs, antiepileptic medications accounted for a large proportion, enough to be in the 6th place alone, and sedatives and hypnotics ranked 8th.
Exposure to Clostridium spp. also occurred highly frequently, and ranked 7th and 9th. Poisoning due to other fish and shellfish was also confirmed to be highly frequent (Table 2).
Table 2
The fifteen most common diagnoses at the ED
The most commonly prescribed antidote was acetylcysteine, followed by naloxone. The prescribed amounts of acetylcysteine, charcoal and flumazenil increased steadily, while the prescribed amounts of pralidoxime decreased steadily. Gastric lavage was performed in about 0.1% of patients. The average treatment period decreased rapidly in 2012 and 2013, compared to 2009, 2010 and 2011 (Table 3). Patients aged 9 years or younger visited the ED most frequently (Fig. 1A), while patients who most frequently visited owing to toxic exposure were in their 40s and 50s (Fig. 1B).
Table 3
Comparison of treatments
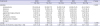
Fig. 1
Rates of Korean ED visits for poisoning by year and age group, between 2009 and 2013. (A) All ED visits. (B) Visits among patients with toxic exposure.
ED = emergency department
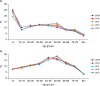
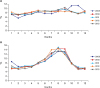
According to the months of visit, the number of patients who visited EDs was lowest in February, highest in September, and increased rapidly in October and November 2009 (Fig. 2A). On the other hand, the number of patients with toxic exposure was highest in July–September and higher in January than the other months (Fig. 2B).
DISCUSSION
The percentage of patients with toxic exposure may vary depending on the extent of exposure to the toxic substances, and how the toxic substances are categorized. The extent of the poisoning may vary from a broad sense to a narrow sense, and will vary based on the influence of the country, society, and age. This can be interpreted in a variety of ways, so a standardized interpretation is needed, but there are no standardized national guidelines in Korea yet.16 The collection and analysis of poison data at the national level will play an important role in the determination of toxicological policies and in the treatment of patients, including the production and sale of toxic substances, placement of poison centers, and the availability of rare antidotes, etc. Therefore, these characteristics should be confirmed periodically by country.10 In the United States, vast data are collected and analyzed through the Toxic Exposure Surveillance System (TESS), which is a poisons database operated by the American Association of Poison Control Centers (AAPCC). Poison centers nationwide participate in the TESS and it is used as important basic data for poison-related policies, treatment and education; a report has been published annually since 1983.816
This study assessed the characteristics related to patients with toxic exposure who visited EDs from 2009 to 2013 using two national databases that survey patient data in Korea. As mentioned in the methods, about 98% of Koreans are covered by the National Health Insurance, and Korea is a nation that implements a mandatory National Health Insurance. The HIRA is a claims-based database for the National Health Insurance and includes information on the diagnosis, treatment, technique, surgery, and prescription drugs for each patient.1314 The NEDIS is an emergency information network operated by the government (Ministry of Health and Welfare) and includes clinical and administrative data for all patients who have visited EDs nationwide. It includes a record of the age, sex, type of medical insurance, initial vital signs, route of visit, and the time of arrival to and discharge from the ED.15 This study was based on the analysis of information of patients with toxic exposure in the HIRA database, and only the total number of patients who visited the ED was confirmed in the NEDIS database. The NEDIS database is not currently available to general researchers and is scheduled to be released shortly, so we hope that more detailed studies on the characteristics of patients will be carried out actively.
The proportion of patients with toxic exposure among all patients who visited the ED significantly decreased consistently over the 5-year period from 2009 to 2013 (7.8%, 6.9%, 6.0%, 5.0%, and 4.1%, respectively). In some hospital-based studies, such as that by Jang et al.5 in Korea, this rate was found to be 0.39% in both 2000 and 2010. Burillo-Putze et al.17 reported that patients with toxic exposure accounted for 0.66% of all ED patients, while according to the domestic figures reported by Song et al.1 in 1992, the rate was about 0.68%, and was as high as 3.2% and 5.5% in the domestic data of the 1980s. The differences seem to be because each study used different definitions of toxic substances, and the toxic substances were comprehensively included in this study (Table1).
Men accounted for about 50% of the patients, so there seems to be no difference gender-wise. In other related studies,5 the male to female ratio was 1:1.57 in 2000, and 1:1.86 in 2010, and So et al.10 reported that women comprised 52.1%, while Song et al.1 reported that women comprised 68.4%. Park et al.16 reported that women are generally more exposed to toxic substances at a high rate of 1:1.14 and considering that the main motive for toxic substance exposure is suicide, this is considered to be related to the rate of attempted suicide among women, and is comparable to this study for all toxic substances including drugs. Xiang et al.18 also reported a similar pattern to the domestic data (women, 56.7%) and that women were more likely to be suicidal than men. However, Burillo-Putze et al.17 reported that the proportion of men was more (56%).
In the diagnosis of toxic exposure, non-drug substances accounted for the largest proportion, and increased annually. Also, there was a high frequency of visits due to the aftermath of toxic damage, but this decreased rapidly every year. Toxic exposure caused by drugs, alcohol and food was next in rank. Among the drugs, antiepileptic medications accounted for a large proportion, enough to be in the 6th place alone, and sedatives and hypnotics ranked 8th. Exposure to Clostridium spp. also occurred highly frequently, and ranked 7th and 9th. Poisoning due to other fish and shellfish was also confirmed to be highly frequent (Table 2). In this study, alcohol was the most diagnosed as a single substance of toxic exposure and other studies5 also reported that the incidence of poisoning with alcohol was 25.7% in the 2000s and 26.7% in the 2010s and many poisonings seem to be happening following alcohol consumption. Burillo-Putze et al.17 reported that the proportion of patients with alcohol poisoning was 26.3%. Alcohol-related emergency room visits are common.19
The treatment of patients with acute toxic exposure includes decontamination, the use of antidotes, and subsequent conservative treatment, depending on the existing symptoms. Of the available modes of treatment for patients with acute toxic exposure, the most effective must be the use of antidotes. However, antidotes are limited to certain toxic substances, and can only be used if the toxic substance is identified. Therefore, the confirmation of the required antidote, in addition to the toxic substance is very important for doctors who treat patients with toxic exposure. According to this study, acetylcysteine was the most commonly prescribed antidote in Korea, followed by naloxone. The prescribed amounts of acetylcysteine, charcoal and flumazenil increased steadily, while the prescribed amounts of pralidoxime decreased steadily. This may suggest that poisoning by medicines was more prevalent than poisoning by domestic pesticides. These toxic substances will be socially affected depending on the ease of purchase and acquisition, and will also show differences in the times. In other studies,5 poisonous substances were ranked in the order of non-prescription drugs, home supplies, and pesticides in the 2000s, and non-prescription drugs, psychiatric drugs, prescription drugs in the 2010s, showing that there is an increase in the incidence of drug-related poisoning rather than pesticide poisoning, similar to this study. In Korea, there was a tendency to consider psychiatric treatment as a taboo, so people did not receive treatment. However, in recent years, the number of patients receiving treatment has increased, and it seems that drugs (especially antipsychotics) have become easier to obtain and use. Also, less exposure to pesticides can be said to be a social feature. This may be due to the increased awareness regarding accidental exposure to pesticides among residents due to carelessness.202122 It is considered that it will be preventively important to regulate possible toxic substances steadily and be aware of drug abuse.
Gastric lavage was performed in about 0.1% of patients. In terms of the method of treatment, it appears that ipecac for emesis is not used in Korea, similar to Spain,17 and can be interpreted as a domestic feature. Given the report that 44.6% of such patients had lavage in 2003,5 lavage was performed somewhat indiscriminately for gastrointestinal decontamination after acute poisoning in the past. Recently, however, if the advantage of lavage is judged to be less than the risk of complications such as aspiration, the indication is considered to be strictly applied. Also, it is interpreted that the administration of charcoal increased as a substitute (Table 3).
The average duration of treatment decreased rapidly in 2012 and 2013, compared with 2009, 2010, and 2011. This is thought to be the result of generally strengthening the evaluation of the stay time of patients in the ED and the Ministry of Health and Welfare, which actually collects NEDIS data, evaluates all EDs every year and an evaluation item for the duration of ED stay was added from 2012 in this Emergency Center Assessment (Table 3).
Patients aged 9 years or younger visited the ED most frequently (Fig. 1A), while patients who most frequently visited owing to toxic exposure were in their 40s and 50s (Fig. 1B). In Korean studies, the age range of patients with toxic exposure increased from an average of 37.03 years in the 2000s to an average of 41.65 years in the 2010s,5 and according to the data published by Song et al.1 in 1992, the 20s were the most common (35.7%), and, 20s were the most, 46.8% in the data of Lee et al.23 in 1996. Also in the 1998 data released by Kang et al.,24 20s were the most common (23.7%). According to Park et al.16 in 2004, the mean age was 47.8 years, while the study by So et al.10 in 2008 reported that the mean age was 46.02 ± 20.12 years and patients aged 40 were the most (20.4%). According to the study conducted in 2003 by Burillo-Putze et al.17 (Spain), the average age of Spanish patients with toxic exposure was 33 years, while the study by Xiang et al.18 reported that 35 to 44-year-olds were the most common among patients with toxic exposure in EDs in the US. The total number of ED visits was higher among young children, but most patients are exposed to toxic substances in their 30s and 40s, when they are socially active, and the proportion of this age group is also expected increase a little.
The monthly distribution of all ED visits was lowest in February, highest in September, and increased rapidly in October and November 2009 (Fig. 2A). On the other hand, the number of patients exposed to toxic substances was highest in July-September, and higher in January than the other months (Fig. 2B). Considering that there was a high incidence of fish and shellfish poisoning, the number of patients with toxic exposure may have increased due to the effect of food poisoning in July and August which are part of the hot summer, and October and November 2009 with a temporary event in which the number of ED visits increased sharply due to the H1N1 influenza pandemic which affected Korea.
This study has limitations. The HIRA database is claims-based, and the insurance does not cover self-afflicted injuries and motor accidents. A suicidal attempt by a patient with toxic exposure is registered under the psychiatric history. However, in a few cases where the toxic exposure is thought to be due to a suicide attempt, self-injury without a history of mental illness may not be included. This has a very low probability of occurring, and may not have had a significant effect on the results of the study. Unfortunately, this study is based on insurance-related data, which makes it impossible to check the specific treatment progress of patients for each substance. Although the number of deaths due to poisoning is decreasing in Korea, data on toxic substances related to death are important, and can be identified using the NEDIS data. This data is scheduled to be released to individual researchers after October 2017, and active research by individual researchers is expected. Furthermore, it will be necessary to establish a nationwide data registry that is announced every year in Korea like the TESS.
In conclusion, this study identified the characteristics of patients exposed to toxic substances based on a Korean national database and found that the percentage of patients visiting the ED is decreasing, the exposure to quasi-drugs was the most common, and the exposure to antipsychotic drugs was the most frequent. Acetylcysteine was the most commonly used antidote, patients in their 40s and 50s were the most common, and July to September were the months in which most visits occurred. We expect that identifying the characteristics of patients exposed to toxic substances is fundamental to treating poisoned patients. It is, therefore, necessary for relevant agencies to continuously collect basic data on poisoning among patients visiting domestic emergency medical centers.
 XML Download