Journal List > J Korean Med Sci > v.33(29) > 1107862

Moon, Park, Jang, Park, Yu, Park, Ahn, Choi, and Yoo: The Cut-off Values of Surrogate Measures for Insulin Sensitivity in a Healthy Population in Korea according to the Korean National Health and Nutrition Examination Survey (KNHANES) 2007–2010

Abstract

Background

This study aimed to identify the gender-specific characteristics of the surrogate measures of insulin resistance and to establish valid cut-off values for metabolic abnormalities in a representative sample in Korea.

Methods

Data were collected from the datasets of the Korean National Health and Nutrition Examination Survey between 2007 and 2010. The total number of eligible participants was 10,997. We used three measures of insulin resistance: the homeostasis model assessment-insulin resistance (HOMA-IR), McAuley index, and triglyceride and glucose (TyG) index. The estimated cut-off values were determined using the highest score of the Youden index.

Results

The area under the curve (AUC) of the HOMA-IR, McAuley index, and TyG index were 0.737 (95% confidence interval [CI], 0.725–0.750), 0.861 (95% CI, 0.853–0.870), and 0.877 (95% CI, 0.868–0.885), respectively. The cut-off values of the HOMA-IR were 2.20 in men, 2.55 in premenopausal women, and 2.03 in postmenopausal women, and those of the McAuley index were 6.4 in men and 6.6 in premenopausal and postmenopausal women. For the TyG index, the cut-off values were 4.76 in men and 4.71 in premenopausal and postmenopausal women.

Conclusion

In conclusion, the present study provides the valid cut-off values of the indirect surrogate measures of insulin sensitivity. These values may be used as reference for insulin sensitivity in a clinical setting and may provide a simple and supplementary method for identifying populations at risk of insulin resistance.

Graphical Abstract

jkms-33-e197-abf001.jpg

INTRODUCTION

Insulin resistance is a pathological condition that is characterized by a reduced physiological response of the peripheral tissues to normal insulin levels.12 It is considered as an independent risk factor for cardiovascular and cerebrovascular diseases and can result in metabolic syndrome.345678
Insulin resistance can be measured using the pancreatic suppression test, hyperinsulinemic-euglycemic clamp technique (HIEG clamp), or minimal model approximation of the metabolism of glucose (MMAMG).91011 However, these tests are complicated, invasive, and costly, and they are only suitable for small-scale studies. For epidemiological and clinical studies, simple indirect methods have been proposed. Such methods include the homeostasis model assessment-insulin resistance (HOMA-IR) and McAuley index that use fasting insulin level.121314 However, because the measurement of fasting insulin level is cumbersome with no standard assay available, an insulin-free equation for estimating insulin resistance was investigated and developed. In 2010, the product of fasting triglyceride and glucose (TyG) levels, which is referred to as the TyG index, was proposed as a useful surrogate measure of insulin resistance in healthy adults.15 However, the sex-specific cut-off values of these measures have not been established.
Thus, this study aimed to evaluate the sex-specific characteristics of the surrogate measures of insulin resistance in a representative sample in Korea. Moreover, the valid cut-off values for metabolic abnormalities were identified.

METHODS

Study population

Data were collected from the Korean National Health and Nutrition Examination Survey (KNHANES) between 2007 and 2010. KNHANES was a cross-sectional and nationally representative survey with a multistage and stratified sample design. The total number of participants from each source was 33,552. The following participants were excluded from this study: those with missing data (anthropometric or laboratory data), those below 20 years of age, those with a past history of cardiovascular diseases, stroke, liver cirrhosis, and hepatitis B and C infections, as well as individuals with diabetes, rheumatic arthritis, asthma, chronic obstructive pulmonary disease, or chronic kidney disease with an estimated glomerular filtration rate lower than 60 or those who were receiving medications for dyslipidemia. The total number of eligible participants was 10,997.

Clinical and laboratory measurements

Blood pressure (BP) was measured three times in sitting position after at least 5 minutes of rest. The average of three recorded systolic and diastolic BP values was used in the present study. Waist circumference (WC) was measured using a flexible tape at the narrowest point between the uppermost lateral border of the iliac crest and the lowest border of the rib cage at the end of normal expiration. Venous blood sampling was performed, and the samples were transported daily to the central laboratory (Seoul Medical Science Institute, Seoul, Korea, in 2007; Neodin Medical Institute, Seoul, Korea between 2008 and 2010). After 8 hours of overnight fasting, the fasting plasma concentrations of glucose, triglycerides, and high-density lipoprotein (HDL) cholesterol were determined according to standard procedures using the Advia 1650 (Siemens, Washington, DC, USA) in 2007 and the Hitachi Automatic Analyzer 7600 (Hitachi, Tokyo, Japan) between 2008 and 2010. For the accuracy and consistency of each survey, we used the revised HDL cholesterol values between 2007 and 2010 based on the Korea Centers for Disease Control and Prevention guidelines.1617 Insulin concentrations were measured with an immunoradiometric assay (INS-IRMA; BioSource, Nivelles, Belgium) using the 1470 WIZARD automatic gamma counter (PerkinElmer, Turku, Finland).

Definition

Based on the revised National Cholesterol Education Program criteria, metabolic syndrome is defined as the presence of three or more of the following18: 1) BP ≥ 130/85 mmHg or use of antihypertensive medications, 2) WC > 90 cm and > 80 cm using the International Obesity Task Force criteria for an Asian Pacific population for WC,19 3) fasting glucose ≥ 100 mg/dL or use of anti-diabetic medications, 4) HDL cholesterol level < 40 mg/dL in men and < 50 mg/dL in women or use of cholesterol-lowering medications, and 5) triglyceride level ≥ 150 mg/dL or use of triglyceride-lowering medications.
Insulin sensitivity was evaluated using the HOMA-IR, McAuley index, and TyG index. The standard formulas were as follows:
HOMA-IR = fasting insulin (μIU/mL) × fasting glucose (mmol/L)/22.5
McAuley index = exp {2.63 − 0.28 Ln fasting insulin (μIU/mL) − 0.31 Ln triglycerides (mmol/L)}
TyG index = Ln {fasting glucose (mg/dL) × triglycerides (mg/dL)}/2

Statistical analysis

Data, including socio-demographic information, medical condition, anthropometric data, and laboratory measures, were presented as mean or percentage (%) with 95% confidence interval (CI). The prevalence rate of metabolic syndrome and its components was calculated, and Pearson's χ2 test was used to compare the proportions of individuals according to sex and menstrual status. The values of each surrogate measure of insulin sensitivity were presented as the 10th, 25th, 50th, 75th, and 90th percentiles in terms of age and sex. Data were analyzed with sampling weights for multistage and stratified sampling.
In the present study, we analyzed the surrogate measures of insulin sensitivity using the receiver operating characteristic (ROC) curve for metabolic syndrome to estimate the valid cut-off values. Because several studies have reported that several surrogate measures differed according to sex,20 in the present study, analyses were performed independently in men and women. In addition, we also divided the female participants into two subgroups according to menstrual status. The estimated cut-off values were determined using the highest score of the Youden index (YI). Analyses were performed using the SPSS software version 21.0 (IBM, Armonk, NY, USA).

RESULTS

Baseline characteristics of the participants

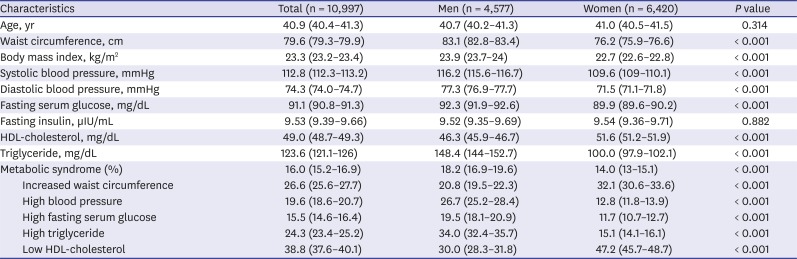
Overall, data from 10,997 participants were assessed (4,577 men and 6,420 women). The anthropometric, clinical, and biochemical characteristics of the participants are summarized in Table 1. The prevalence of metabolic syndrome was significantly higher in men than in women. Low HDL cholesterol level was one of the predominant metabolic syndrome components in both men and women. Hypertriglyceridemia was one of the main components in men, whereas central obesity was frequently reported in women.
Table 1

Weighted clinical characteristics of the participants in KNHANES

jkms-33-e197-i001
Characteristics Total (n = 10,997) Men (n = 4,577) Women (n = 6,420) P value
Age, yr 40.9 (40.4–41.3) 40.7 (40.2–41.3) 41.0 (40.5–41.5) 0.314
Waist circumference, cm 79.6 (79.3–79.9) 83.1 (82.8–83.4) 76.2 (75.9–76.6) < 0.001
Body mass index, kg/m2 23.3 (23.2–23.4) 23.9 (23.7–24) 22.7 (22.6–22.8) < 0.001
Systolic blood pressure, mmHg 112.8 (112.3–113.2) 116.2 (115.6–116.7) 109.6 (109–110.1) < 0.001
Diastolic blood pressure, mmHg 74.3 (74.0–74.7) 77.3 (76.9–77.7) 71.5 (71.1–71.8) < 0.001
Fasting serum glucose, mg/dL 91.1 (90.8–91.3) 92.3 (91.9–92.6) 89.9 (89.6–90.2) < 0.001
Fasting insulin, µIU/mL 9.53 (9.39–9.66) 9.52 (9.35–9.69) 9.54 (9.36–9.71) 0.882
HDL-cholesterol, mg/dL 49.0 (48.7–49.3) 46.3 (45.9–46.7) 51.6 (51.2–51.9) < 0.001
Triglyceride, mg/dL 123.6 (121.1–126) 148.4 (144–152.7) 100.0 (97.9–102.1) < 0.001
Metabolic syndrome (%) 16.0 (15.2–16.9) 18.2 (16.9–19.6) 14.0 (13–15.1) < 0.001
Increased waist circumference 26.6 (25.6–27.7) 20.8 (19.5–22.3) 32.1 (30.6–33.6) < 0.001
High blood pressure 19.6 (18.6–20.7) 26.7 (25.2–28.4) 12.8 (11.8–13.9) < 0.001
High fasting serum glucose 15.5 (14.6–16.4) 19.5 (18.1–20.9) 11.7 (10.7–12.7) < 0.001
High triglyceride 24.3 (23.4–25.2) 34.0 (32.4–35.7) 15.1 (14.1–16.1) < 0.001
Low HDL-cholesterol 38.8 (37.6–40.1) 30.0 (28.3–31.8) 47.2 (45.7–48.7) < 0.001
Data are expressed as means (95% CI) or percentage (95% CI).
KNHANES = Korean National Health and Nutrition Examination Survey, CI = confidence interval.

Distribution of the surrogate measures of insulin sensitivity

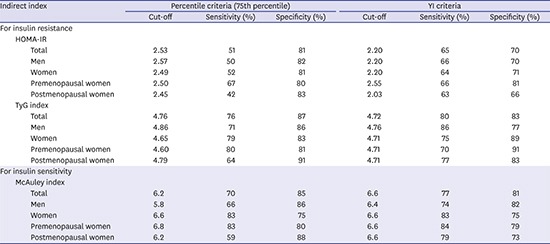
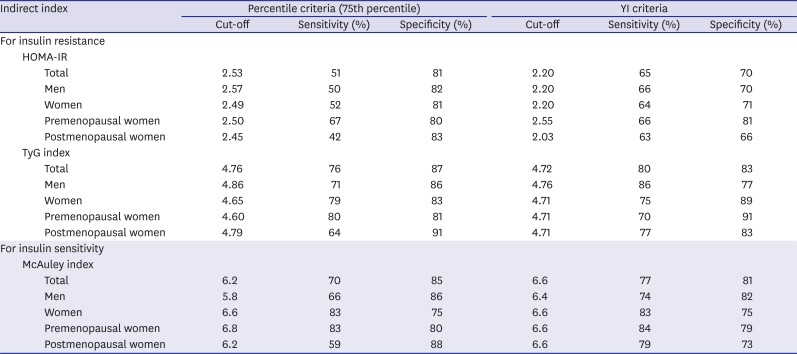
The distributions of surrogate measures according to sex and menstrual status are summarized in Table 2. We selected the 75th percentile values of the HOMA-IR and TyG index and the 25th percentile values of the McAuley index as the cut-off values for insulin resistance. This point corresponded to the HOMA-IR value of 2.53, McAuley index score of 6.2, and TyG index score of 4.76. Table 3 depicts the sensitivity and specificity of the metabolic syndrome of each point according to sex and menstrual status.
Table 2

Distribution of surrogate measures for insulin sensitivity
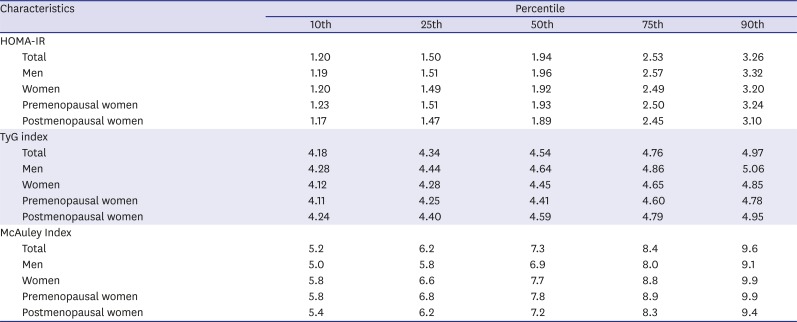
jkms-33-e197-i002
Characteristics Percentile
10th 25th 50th 75th 90th
HOMA-IR
Total 1.20 1.50 1.94 2.53 3.26
Men 1.19 1.51 1.96 2.57 3.32
Women 1.20 1.49 1.92 2.49 3.20
Premenopausal women 1.23 1.51 1.93 2.50 3.24
Postmenopausal women 1.17 1.47 1.89 2.45 3.10
TyG index
Total 4.18 4.34 4.54 4.76 4.97
Men 4.28 4.44 4.64 4.86 5.06
Women 4.12 4.28 4.45 4.65 4.85
Premenopausal women 4.11 4.25 4.41 4.60 4.78
Postmenopausal women 4.24 4.40 4.59 4.79 4.95
McAuley Index
Total 5.2 6.2 7.3 8.4 9.6
Men 5.0 5.8 6.9 8.0 9.1
Women 5.8 6.6 7.7 8.8 9.9
Premenopausal women 5.8 6.8 7.8 8.9 9.9
Postmenopausal women 5.4 6.2 7.2 8.3 9.4
HOMA-IR = homeostasis model assessment-insulin resistance, TyG = triglyceride and glucose.
Table 3

The cut-off values of each surrogate measures by percentile criteria and modified YI criteria

jkms-33-e197-i003
Indirect index Percentile criteria (75th percentile) YI criteria
Cut-off Sensitivity (%) Specificity (%) Cut-off Sensitivity (%) Specificity (%)
For insulin resistance
HOMA-IR
Total 2.53 51 81 2.20 65 70
Men 2.57 50 82 2.20 66 70
Women 2.49 52 81 2.20 64 71
Premenopausal women 2.50 67 80 2.55 66 81
Postmenopausal women 2.45 42 83 2.03 63 66
TyG index
Total 4.76 76 87 4.72 80 83
Men 4.86 71 86 4.76 86 77
Women 4.65 79 83 4.71 75 89
Premenopausal women 4.60 80 81 4.71 70 91
Postmenopausal women 4.79 64 91 4.71 77 83
For insulin sensitivity
McAuley index
Total 6.2 70 85 6.6 77 81
Men 5.8 66 86 6.4 74 82
Women 6.6 83 75 6.6 83 75
Premenopausal women 6.8 83 80 6.6 84 79
Postmenopausal women 6.2 59 88 6.6 79 73
YI = Youden index, HOMA-IR = homeostasis model assessment-insulin resistance, TyG = triglyceride and glucose.

ROC curves of the surrogate measures for insulin sensitivity

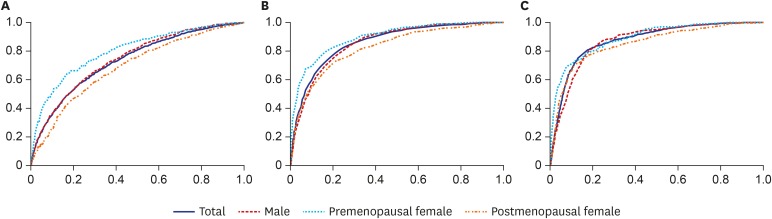
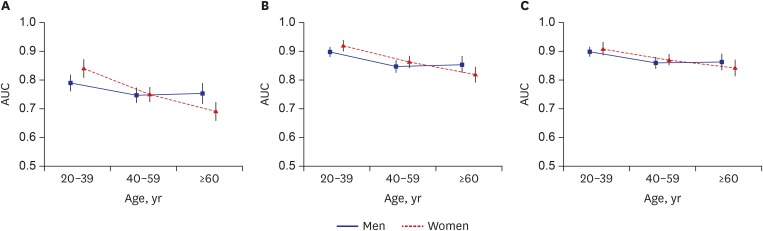
The ROC curve of each marker according to sex and menstrual status is shown in Fig. 1. The area under the curves (AUCs) of the HOMA-IR were 0.747 (95% CI, 0.730–0.765) in men and 0.804 (95% CI, 0.779–0.828) and 0.692 (95% CI, 0.665–0.718) in premenopausal and postmenopausal women, respectively. The AUCs of the McAuley index were 0.856 (95% CI, 0.844–0.869) in men and 0.894 (95% CI, 0.877–0.911) and 0.823 (95% CI, 0.802–0.845) in premenopausal and postmenopausal women, respectively, and the cut-off values of the TyG index were 0.872 (95% CI, 0.860–0.884) in men, 0.893 (95% CI, 0.875–0.91) in premenopausal women, and 0.853 (95% CI, 0.833–0.874) in postmenopausal women. The AUC of each marker according to sex and age is shown in Fig. 2. The cut-off values of the HOMA-IR were 2.20 in men, 2.55 in premenopausal women, and 2.03 in postmenopausal women, and those of the McAuley index were 6.4 in men and 6.6 in premenopausal and postmenopausal women. For the TyG index, the cut-off values were 4.76 in men and 4.71 in premenopausal and postmenopausal women. The cut-off values with their corresponding sensitivity and specificity for each subgroup are summarized in Table 3.
Fig. 1

The ROC curve of each surrogate measure by sex and menstrual status. (A) HOMA-IR. (B) McAuley index. (C) TyG index.

ROC = receiver operating characteristic, HOMA-IR = homeostasis model assessment-insulin resistance, TyG = triglyceride and glucose.
jkms-33-e197-g001
Fig. 2

AUC of each surrogate measure by sex and age. (A) AUC of HOMA-IR. (B) AUC of McAuley index. (C) AUC of TyG index.

AUC = area under the curve, HOMA-IR = homeostasis model assessment-insulin resistance, TyG = triglyceride and glucose.
jkms-33-e197-g002

DISCUSSION

The present study aimed to evaluate the sex-specific characteristics of the surrogate measures of insulin sensitivity. Moreover, their valid cut-off values were established to identify individuals at risk of insulin resistance.
Several previous studies have determined the cut-off values of the surrogate measures as the value with a specific percentile criterion, such as the 75th, 80th, or 90th percentile.2122232425 However, how the proposed cut-off values could identify the risk of clinically relevant outcomes was not fully elucidated. Therefore, to determine a valid cut-off value, we used the ROC curve of each surrogate measure of metabolic syndrome that could accurately reflect pathologic conditions due to insulin reaction. In the present study, the McAuley and TyG indexes had a higher sensitivity and specificity for metabolic syndrome than the HOMA-IR. These results were due to the McAuley and TyG indexes that included triglyceride in their equations, which was the main component of metabolic syndrome. In addition, the AUC of the surrogate measures differed according to sex and menstrual status. Insulin resistance is often associated with alterations in sex hormone.26 Ovarian estrogens promote peripheral fat storage, whereas androgens promote the accumulation of visceral abdominal fat. Significant decrease in estrogen concentrations and relative hyperandrogenism are considered as the important factors associated with weight gain and hyperinsulinemia in postmenopausal women.2627 In addition, a decreased level of sex hormone-binding globulin (SHBG) is considered as a strong indicator of insulin resistance in postmenopausal women.2829 Interestingly, SHBG was more significantly associated with the indices of insulin resistance in postmenopausal women than in premenopausal women.262829 Therefore, alterations in sex hormone in menopausal women had a confounding effect on the surrogate measures of insulin resistance. Gayoso-Diz et al.20 have revealed a significant decline in the AUC of the HOMA-IR in women older than 50 years. These results might reflect the effect of alterations in sex hormones. As shown in Fig. 2, the present study also revealed similar results.
Interestingly, the AUC of the HOMA-IR decreased more significantly than those of the McAuley and TyG indexes. Considering the significant decline in the AUC of the HOMA-IR in postmenopausal women, the McAuley and TyG indexes may be used as supplementary methods.
HOMA-IR is a robust tool for the surrogate assessment of insulin resistance. The current study showed that the optimal cut-off value was 2.20 (sensitivity: 65% and specificity: 70%). This result was slightly lower than those previously reported in other studies in Korea. Ryu et al.30 have suggested that the cut-off value of the HOMA-IR was 2.43 (sensitivity: 73.7% and specificity: 73.7%), and Lee et al.31 have reported that the cut-off value of the HOMA-IR was 2.34 (sensitivity: 62.8% and specificity: 66.8%).
Moreover, several studies have suggested that the McAuley index was a good surrogate measure of insulin sensitivity, which had a significantly higher sensitivity than the HOMA-IR compared to the HIEG clamp and MMAMG method in the group without diabetes.114 However, these studies were performed using a small number of participants. Thus, this study showed the clinical relevance of the McAuley index. Moreover, the cut-off values in a population-based study were proposed.
The TyG index has been proposed as a good surrogate measure of insulin sensitivity. The TyG index is a more simple and inexpensive method than the surrogate measures that use insulin, considering the absence of a standard assay for insulin measurement and the cumbersome nature of the direct estimation of insulin level. In addition, the TyG index value was associated with the gold standard methods for insulin resistance. Guerrero-Romero et al.15 have reported a correlation between the TyG index and the HIEG clamp results in a study on a Mexican population. Vasques et al.32 have also found this correlation in a Brazilian population. Bastard et al.33 have reported that the TyG index had a relatively modest correlation to the HIEG clamp results. Abbasi and Reaven34 have also reported a modest correlation between the TyG index and insulin-stimulated glucose uptake during insulin suppression testing. Several population-based studies have demonstrated the clinical usefulness of the TyG index as a surrogate measure.3536 The present study supports the clinical relevance of the TyG index in a large Korean population as well. In addition, it is important to propose the valid cut-off value of the TyG index that can be used as a reference in clinical settings for identifying groups at risk for insulin resistance.
The present study has key strengths. This was a large population-based study, and different surrogate measures of insulin resistance were included in the analysis. To the best of our knowledge, this is the first study that evaluated the sex- and age-specific characteristics of the McAuley and TyG indexes. However, the present study has several potential limitations. First, this is a cross-sectional study. To validate the relationship between each surrogate measure and cardiovascular risk factors, further prospective studies must be conducted. Second, because the present study involved a population of healthy Korean adults, these results are applicable only in Korea. Third, we cannot compare the surrogate measures with the gold standard methods for insulin resistance.
In conclusion, the present study presented the valid cut-off values of the indirect surrogate measures of metabolic syndrome. These values may serve as the reference for insulin sensitivity in a clinical setting and may provide a simple and supplementary method for identifying individuals at risk of insulin resistance. However, to establish more valid cut-off values, further studies, including correlational studies on these surrogate measures and the gold standard methods for insulin resistance, must be conducted.

Notes

Disclosure: The authors have no potential conflicts of interest to disclose.

Author Contributions: Conceptualization: Moon S, Choi S, Yoo HJ. Data curation: Moon S, Park JH, Jang EJ, Park YK, Yu JM, Park JS. Formal analysis: Moon S, Park JH, Jang EJ, Park YK, Yu JM, Park JS, Ahn Y, Choi SH, Yoo HJ. Methodology: Moon S, Park JH, Jang EJ, Park YK, Yu JM, Park JS, Ahn Y, Yoo HJ. Writing - original draft: Moon S, Park JH.

References

1. Ascaso JF, Pardo S, Real JT, Lorente RI, Priego A, Carmena R. Diagnosing insulin resistance by simple quantitative methods in subjects with normal glucose metabolism. Diabetes Care. 2003; 26(12):3320–3325. PMID: 14633821.
2. Hanefeld M. The metabolic syndrome: roots, myths, and facts. In : Hanefeld M, Leonhardt W, editors. The Metabolic Syndrome. Jena: Gustav Fischer;1997. p. 13–24.
3. Després JP, Lamarche B, Mauriège P, Cantin B, Dagenais GR, Moorjani S, et al. Hyperinsulinemia as an independent risk factor for ischemic heart disease. N Engl J Med. 1996; 334(15):952–957. PMID: 8596596.
4. Folsom AR, Rasmussen ML, Chambless LE, Howard G, Cooper LS, Schmidt MI, et al. Prospective associations of fasting insulin, body fat distribution, and diabetes with risk of ischemic stroke. Diabetes Care. 1999; 22(7):1077–1083. PMID: 10388971.
5. Kuusisto J, Mykkänen L, Pyörälä K, Laakso M. Hyperinsulinemic microalbuminuria. A new risk indicator for coronary heart disease. Circulation. 1995; 91(3):831–837. PMID: 7828312.
6. Shinozaki K, Naritomi H, Shimizu T, Suzuki M, Ikebuchi M, Sawada T, et al. Role of insulin resistance associated with compensatory hyperinsulinemia in ischemic stroke. Stroke. 1996; 27(1):37–43. PMID: 8553400.
7. Pollare T, Lithell H, Berne C. Insulin resistance is a characteristic feature of primary hypertension independent of obesity. Metabolism. 1990; 39(2):167–174. PMID: 2405235.
8. Goodarzi MO, Erickson S, Port SC, Jennrich RI, Korenman SG. Relative impact of insulin resistance and obesity on cardiovascular risk factors in polycystic ovary syndrome. Metabolism. 2003; 52(6):713–719. PMID: 12800096.
9. DeFronzo RA, Tobin JD, Andres R. Glucose clamp technique: a method for quantifying insulin secretion and resistance. Am J Physiol. 1979; 237(3):E214–E223. PMID: 382871.
10. Bergman RN, Prager R, Volund A, Olefsky JM. Equivalence of the insulin sensitivity index in man derived by the minimal model method and the euglycemic glucose clamp. J Clin Invest. 1987; 79(3):790–800. PMID: 3546379.
11. Greenfield MS, Doberne L, Kraemer F, Tobey T, Reaven G. Assessment of insulin resistance with the insulin suppression test and the euglycemic clamp. Diabetes. 1981; 30(5):387–392. PMID: 7014307.
12. Matthews DR, Hosker JP, Rudenski AS, Naylor BA, Treacher DF, Turner RC. Homeostasis model assessment: insulin resistance and beta-cell function from fasting plasma glucose and insulin concentrations in man. Diabetologia. 1985; 28(7):412–419. PMID: 3899825.
13. Katz A, Nambi SS, Mather K, Baron AD, Follmann DA, Sullivan G, et al. Quantitative insulin sensitivity check index: a simple, accurate method for assessing insulin sensitivity in humans. J Clin Endocrinol Metab. 2000; 85(7):2402–2410. PMID: 10902785.
14. McAuley KA, Williams SM, Mann JI, Walker RJ, Lewis-Barned NJ, Temple LA, et al. Diagnosing insulin resistance in the general population. Diabetes Care. 2001; 24(3):460–464. PMID: 11289468.
15. Guerrero-Romero F, Simental-Mendía LE, González-Ortiz M, Martínez-Abundis E, Ramos-Zavala MG, Hernández-González SO, et al. The product of triglycerides and glucose, a simple measure of insulin sensitivity. Comparison with the euglycemic-hyperinsulinemic clamp. J Clin Endocrinol Metab. 2010; 95(7):3347–3351. PMID: 20484475.
16. Korea Centers for Disease Control and Prevention. The Guideline of the Forth Korea National Health and Nutrition Examination Survey (KNHANES-IV). Cheongwon: Centers for Disease Control and Prevention;2009.
17. Korea Centers for Disease Control and Prevention. The Guideline of the Fifth Korea National Health and Nutrition Examination Survey (KNHANES-V-1). Cheongwon: Centers for Disease Control and Prevention;2010.
18. Grundy SM, Cleeman JI, Daniels SR, Donato KA, Eckel RH, Franklin BA, et al. Diagnosis and management of the metabolic syndrome: an American Heart Association/National Heart, Lung, and Blood Institute Scientific Statement. Circulation. 2005; 112(17):2735–2752. PMID: 16157765.
19. World Health Organization, International Association for the Study of Obesity, International Obesity Task Force. The Asia-Pacific Perspective: Redefining Obesity and Its Treatment. Sydney. Health Commun. 2000; 15–21.
20. Gayoso-Diz P, Otero-González A, Rodriguez-Alvarez MX, Gude F, García F, De Francisco A, et al. Insulin resistance (HOMA-IR) cut-off values and the metabolic syndrome in a general adult population: effect of gender and age: EPIRCE cross-sectional study. BMC Endocr Disord. 2013; 13(1):47. PMID: 24131857.
21. Hedblad B, Nilsson P, Janzon L, Berglund G. Relation between insulin resistance and carotid intima-media thickness and stenosis in non-diabetic subjects. Results from a cross-sectional study in Malmö, Sweden. Diabet Med. 2000; 17(4):299–307. PMID: 10821297.
22. Geloneze B, Repetto EM, Geloneze SR, Tambascia MA, Ermetice MN. The threshold value for insulin resistance (HOMA-IR) in an admixtured population IR in the Brazilian Metabolic Syndrome Study. Diabetes Res Clin Pract. 2006; 72(2):219–220. PMID: 16310881.
23. Marques-Vidal P, Mazoyer E, Bongard V, Gourdy P, Ruidavets JB, Drouet L, et al. Prevalence of insulin resistance syndrome in southwestern France and its relationship with inflammatory and hemostatic markers. Diabetes Care. 2002; 25(8):1371–1377. PMID: 12145237.
24. Do HD, Lohsoonthorn V, Jiamjarasrangsi W, Lertmaharit S, Williams MA. Prevalence of insulin resistance and its relationship with cardiovascular disease risk factors among Thai adults over 35 years old. Diabetes Res Clin Pract. 2010; 89(3):303–308. PMID: 20466446.
25. Nakai Y, Nakaishi S, Kishimoto H, Seino Y, Nagasaka S, Sakai M, et al. The threshold value for insulin resistance on homeostasis model assessment of insulin sensitivity. Diabet Med. 2002; 19(4):346–347. PMID: 11943012.
26. Stefanska A, Bergmann K, Sypniewska G. Metabolic syndrome and menopause: pathophysiology, clinical and diagnostic significance. Adv Clin Chem. 2015; 72:1–75. PMID: 26471080.
27. Golden SH, Ding J, Szklo M, Schmidt MI, Duncan BB, Dobs A. Glucose and insulin components of the metabolic syndrome are associated with hyperandrogenism in postmenopausal women: the atherosclerosis risk in communities study. Am J Epidemiol. 2004; 160(6):540–548. PMID: 15353414.
28. Akin F, Bastemir M, Alkiş E, Kaptanoglu B. SHBG levels correlate with insulin resistance in postmenopausal women. Eur J Intern Med. 2009; 20(2):162–167. PMID: 19327605.
29. Davis SR, Robinson PJ, Moufarege A, Bell RJ. The contribution of SHBG to the variation in HOMA-IR is not dependent on endogenous oestrogen or androgen levels in postmenopausal women. Clin Endocrinol (Oxf). 2012; 77(4):541–547. PMID: 22106826.
30. Ryu S, Sung KC, Chang Y, Lee WY, Rhee EJ. Spectrum of insulin sensitivity in the Korean population. Metabolism. 2005; 54(12):1644–1651. PMID: 16311099.
31. Lee S, Choi S, Kim HJ, Chung YS, Lee KW, Lee HC, et al. Cutoff values of surrogate measures of insulin resistance for metabolic syndrome in Korean non-diabetic adults. J Korean Med Sci. 2006; 21(4):695–700. PMID: 16891815.
32. Vasques AC, Novaes FS, de Oliveira MS, Souza JR, Yamanaka A, Pareja JC, et al. TyG index performs better than HOMA in a Brazilian population: a hyperglycemic clamp validated study. Diabetes Res Clin Pract. 2011; 93(3):e98–e100. PMID: 21665314.
33. Bastard JP, Lavoie ME, Messier V, Prud’homme D, Rabasa-Lhoret R. Evaluation of two new surrogate indices including parameters not using insulin to assess insulin sensitivity/resistance in non-diabetic postmenopausal women: a MONET group study. Diabetes Metab. 2012; 38(3):258–263. PMID: 22405724.
34. Abbasi F, Reaven GM. Comparison of two methods using plasma triglyceride concentration as a surrogate estimate of insulin action in nondiabetic subjects: triglycerides × glucose versus triglyceride/high-density lipoprotein cholesterol. Metabolism. 2011; 60(12):1673–1676. PMID: 21632070.
35. Simental-Mendía LE, Rodríguez-Morán M, Guerrero-Romero F. The product of fasting glucose and triglycerides as surrogate for identifying insulin resistance in apparently healthy subjects. Metab Syndr Relat Disord. 2008; 6(4):299–304. PMID: 19067533.
36. Lee SH, Kwon HS, Park YM, Ha HS, Jeong SH, Yang HK, et al. Predicting the development of diabetes using the product of triglycerides and glucose: the Chungju Metabolic Disease Cohort (CMC) study. PLoS One. 2014; 9(2):e90430. PMID: 24587359.
TOOLS
ORCID iDs

Shinje Moon
https://orcid.org/0000-0003-3298-3630

Jung Hwan Park
https://orcid.org/0000-0003-3941-4836

Eun-Jung Jang
https://orcid.org/0000-0001-8381-3901

Yoo-Kyung Park
https://orcid.org/0000-0003-0545-3562

Jae Myung Yu
https://orcid.org/0000-0001-9179-1554

Joon-Sung Park
https://orcid.org/0000-0003-4740-3061

Youhern Ahn
https://orcid.org/0000-0002-4357-1730

Sung-Hee Choi
https://orcid.org/0000-0003-0740-8116

Hyung Joon Yoo
https://orcid.org/0000-0002-7755-9246

Similar articles