

 PDF
PDF Citation
 Print
Print


INTRODUCTION
Injury is a major public health problem and accounts for 10% of the Global Burden of Disease (GBD).1 In recent decades, the total global disability-adjusted life years (DALYs) of injury have continued to show a reducing trend.1 However, injury exhibits different patterns according to the mechanism. In the 2015 GBD study, the age-standardized DALY rate of road injuries decreased by 18% compared to the rate in 2005. Among unintentional injuries, drowning had the largest reduction in age-standardized DALY rates (32%). The age-standardized DALY rates due to self-harm and interpersonal violence both fell by more than 16% since 2005.23 Road injuries (9th), falls (26th) and interpersonal violence (30th) each rose in the reflective ranks in the leading 30 causes of global DALYs. Self-harm injuries fell slightly in the ranking but remained a major leading cause of death and burden of disease in 2015.23
The GBD changes over time and is influenced by factors such as health care systems, culture, and socio-economic status.45 Because public health is affected by those factors, elucidating the injury burden of disease and its trends will allow public health managers to prevent mortality and morbidity due to injuries and to develop an emergency care system.6 In Korea, whether the injury burden has changed and which mechanism is the leading causes of the disease burden of injury by year are uncertain.
The purpose of this study was to present the temporal trend in the injury burden in Korea and to compare the relative burden size by injury mechanism and age group.
METHODS
Study design and setting
This study was a nationwide, population-based, observational study. Our study population was composed of all fatal injuries, and non-fatal injuries requiring hospitalization. We used nationwide, population-based, annual injury datasets spanning from 2004 to 2012. The study population was all citizens of Korea. People who suffered from an injury were enrolled, and we analyzed the death statistics and the Korean National Hospital Discharge Survey.
We used two sets of annual data spanning from January 1, 2004, to December 31, 2012. The first set is the death certificate statistics from the Statistics Korea, and the second set is the Korean National Hospital Discharge Survey from the Korea Centers for Disease Control and Prevention (KCDC).
Mortality data were obtained from the mortality records of the Korean National Statistical Office. Life expectancies were calculated using mortality data for 2010, and years of life lost (YLL) were evaluated using age of injury-related death and the life expectancy data from the mortality data.
Morbidity data were collected from the Korean National Hospital Discharge Survey (KNHDS) conducted by the KCDC. The KNHDS is a continuing nationwide sample survey of acute general hospitals from 2004 in Korea. A two-stage stratified sample design was used, and hospitals were stratified according to bed size and geographic region. Hospitals with less than 100 beds and long-term care/rehabilitation hospitals were excluded. A total of 170 acute-care hospitals were sampled. In the second step, approximately 9% of discharged patients were randomly sampled in hospitals with an electronic medical record system, whereas 300–450 cases were retrieved according to bed numbers in hospitals with manual systems. Moreover, the extraction rates depended on sex and age group. These representative data contained de-identified clinical information accessible by the public. The survey items are 19 general questions on patient characteristics and 8 injury related items. The detailed sampling design used for the survey was previously described.67 Weighting for the complex sample survey was considered when the incidence of injury was estimated for the years lived with disability (YLD) calculations.
Data variables
The main exposure was the time trend of DALYs for each injury mechanism. During the designated timeframe, we collected the data by year. From the death statistics, we gathered the death population from all injury mechanisms. From the national hospital discharge survey, we obtained the discharge dates of all patients admitted due to injuries. We collected information on demographic factors (age and sex), injury-related factors (diagnostic code and location), and definite time (death date and discharge date). Age was grouped into life cycle stages (0–14, 15–49, 50–79, and ≥ 80 years).289 The injury mechanisms were recategorized into 10 mechanisms from the GBD's 15 external cause of injury categories (road injury, poisonings, falls, fire, heat and hot substances, drownings, exposure to force of nature, other unintentional injuries, self-harm, interpersonal violence, collective violence, and legal intervention).10111213 The underlying causes of injury are coded in the data according to the International Classification of Diseases and Related Health Problems, 10th revision (ICD-10). Road injury was defined as injuries featuring the codes V01–V04, V06, V09–V80, V87, V89, and V90. Falls were defined by the codes W00–W19. Self-harm was defined as the codes X60 – X84 and Y870. Poisonings were defined as the codes X40, X43–X44, and X46–X49. Fire, heat and hot substances were defined as the codes X00–X19. Drowning was defined as the codes W65–W74. Exposure to forces of nature was defined as the codes X30–X39. Other unintentional injuries were defined as the codes W20–W64, W75–W99, X20–X29, X50–X59, Y40–Y86, Y88, and Y89. Interpersonal violence was defined as the codes X85–Y09 and Y871. Collective violence and legal intervention were defined as the codes Y35–Y36. The nature of the injury was categorized into 23 categories as described in the GBD 2010 study.11121314
Outcomes
DALYs are a sum of YLLs due to premature death and YLD due to disability resulting from injuries. The burden of fatal injury was estimated using YLLs, which were calculated by multiplying deaths by the remaining life expectancy at the age of death from a standard life table chosen as the norm for estimations of premature mortality in the GBD. The study largely employed the methodology recommended by the 2010 GBD study.1 Life expectancy data used from the life table for Korea were reported annually. All death reports were grouped by underlying cause of death as defined in the GBD study and coded using the ICD-10, coding system.
The burden of non-fatal injury was estimated in YLDs as described in the 2010 GBD study without age weighting or time discounting.1 YLDs were calculated by multiplying the number of prevalent cases with a certain health outcome by the disability weight assigned to this health outcome. The disability weight reflects the magnitude of the health loss associated with the outcome and has a value anchored between 0 (equivalent to full health) and 1 (equivalent to death). Classically, YLD calculations require estimates of the injury incidence and the frequency of associated disabilities. We measured YLDs that required hospital admission from the Korean National Hospital Discharge Survey to estimate the prevalence of admission cases from a specific injury. We used disability weights derived from the GBD 2010 and New Zealand Burden of Disease (NZBD) studies.101112131415 For YLD measurements, some modified definitions were used with reference to existing research methods.7 We distinguished long-term disability and short-term disability by 4 weeks, using the standard treatment period according to the diagnosis (ICD-10 code) based on the instructions for the medical certificate of injury recommended in this country. The duration of short-term disability was used exactly as described in the standard treatment periods. The probability of disability was measured by replacing the number of injuries newly occurring every year across the country with the number of hospitalized patients using the incidence-based approach according to the characteristics of the data sources.
Statistical analysis
After calculation of the DALYs, the annual unadjusted DALYs per 100,000 were calculated for the overall population, for each sex and for the age groups. The annual age-standardized DALYs per 100,000 were also calculated, and the rates were direct-adjusted to the 2010 age structure of the Korean population to allow comparisons over time. We used linear regression analyses to identify trends for each injury mechanism by year. The statistical analysis was performed using SAS 9.4 (SAS Institute Inc., Cary, NC, USA).
RESULTS
Table 1 shows the demographic characteristics of injuries according to Korean mortality data. Approximately 30,000 deaths occur per year, of which two-thirds are males. The 15–49 and 50–79-year-old age groups accounted for more than 80% of the total deaths. Suicide is a major cause of death from injuries, and since 2009, approximately half of all deaths have been caused by self-harm. The second most common cause of death is road traffic injuries, which account for approximately 20% of all deaths.
Table 1
Characteristics of the death certificates by year
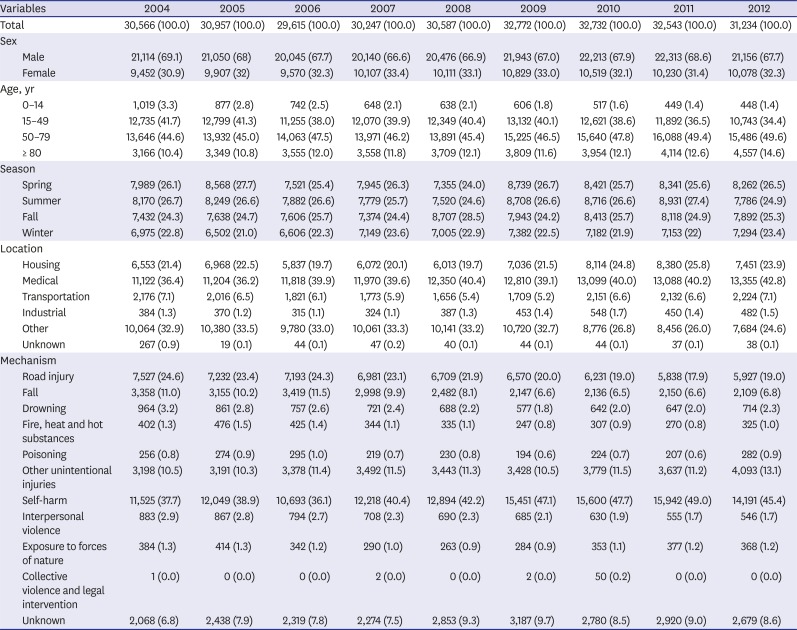
Table 2 shows the demographic characteristics of people with morbidities requiring hospitalization. The number of injured patients was calculated given the weight, because the sample was obtained by extraction due to the nature of the resource. Hospitalization due to injuries increased from 771,509 cases in 2004 to 1,049,636 cases in 2012. The proportion of female morbidity increased from 37.8% in 2004 to 41.5% in 2012, although the number of males was higher than the number of females in all years. By age group, individuals 0–14 years of age and 15–49 years of age showed a decreasing tendency, and the ratio increased for individuals over 50 years old. The location with the highest rate of injury was transportation with approximately 40%, followed by home. By injury mechanism, road injuries and falls were the first and second leading causes of disability by injury.
Table 2
Characteristics of the Korean National Hospital Discharge Survey by year
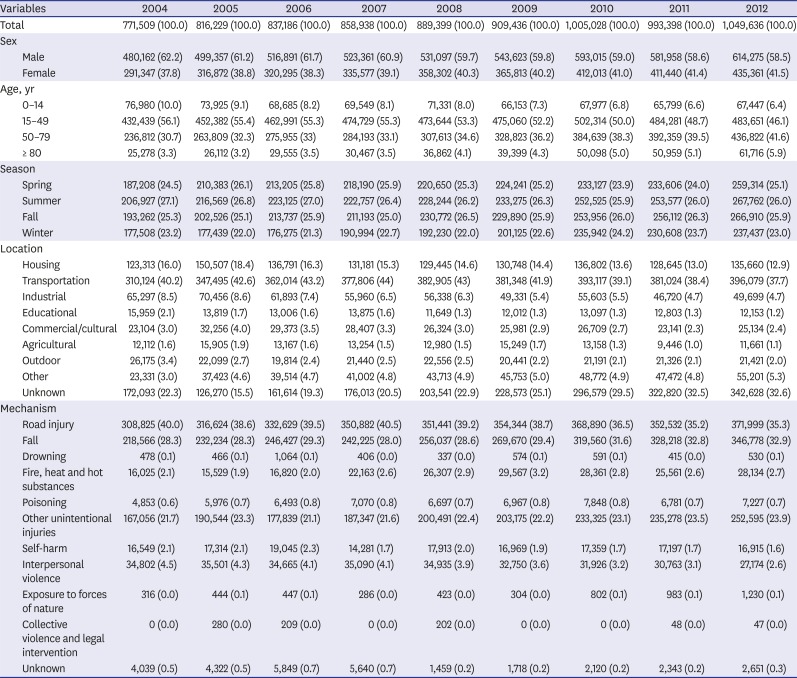
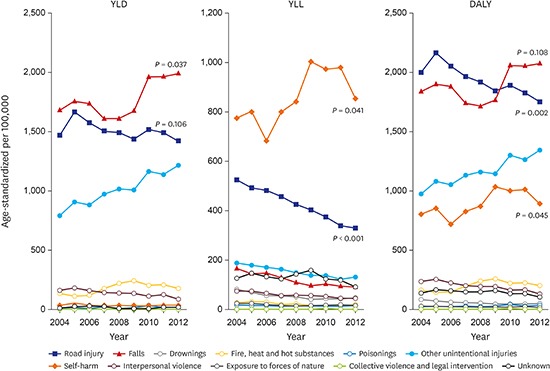
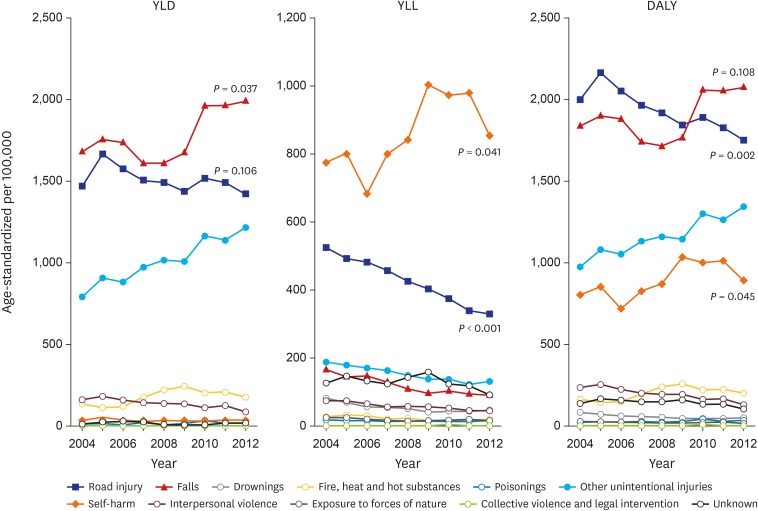
Fig. 1 shows the DALY trends by year. The leading causes of YLDs were falls, road injuries and other unintentional injuries. The category of other unintentional injury covers the remaining various unintentional injuries that were not specified into a single unintentional injury category. The leading causes of YLLs were self-harm and road injuries. From these categories, the major injury mechanism of DALYs were falls, road injuries, and self-harm. The YLDs of falls increased (P = 0.037). The YLLs of road injuries decreased annually (P < 0.001), whereas self-harm exhibited a slightly increasing trend (P = 0.041). The DALYs of road injury decreased (P = 0.002), falls did not exhibit a definite trend (P = 0.108), and self-harm increased overall (P = 0.045).
Fig. 1
Trends in standardized DALY rate by injury mechanism.
YLD = years lived with disability, YLL = years of life lost, DALY = disability-adjusted life year.
The YLLs, YLDs, and DALYs by age group for the major injury mechanism categories are presented in Figs. 2-4. In the road injury category, the YLLs decreased across all age groups, and the YLDs decreased in the 0–14-year-old age group. In total, the DALYs of road injuries decreased in the 0–14-year-old age group (Fig. 2).
Fig. 2
Injury burden from road injuries.
YLL = years of life lost, YLD = years lived with disability, DALY = disability-adjusted life year.
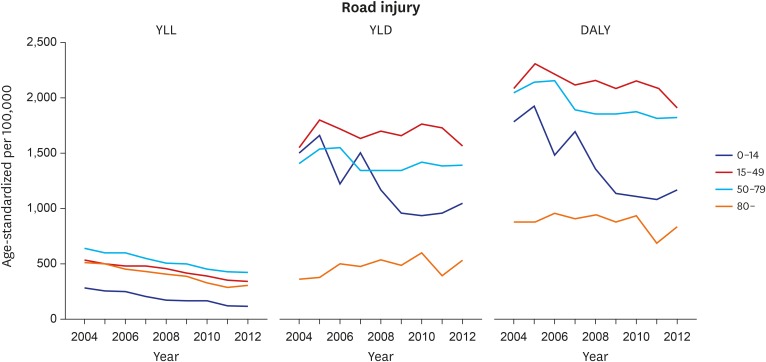
Fig. 3
Injury burden from falls.
YLL = years of life lost, YLD = years lived with disability, DALY = disability-adjusted life year.
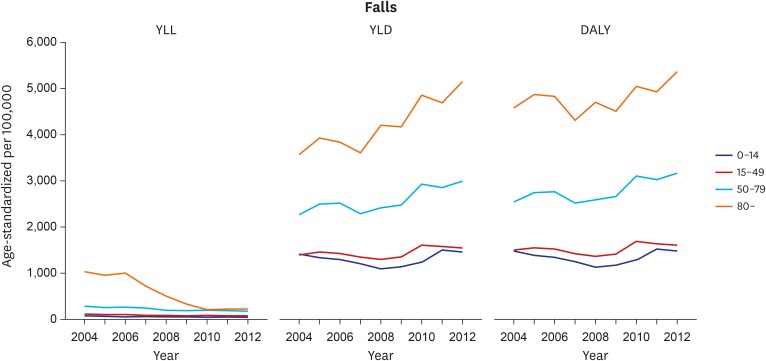
Fig. 4
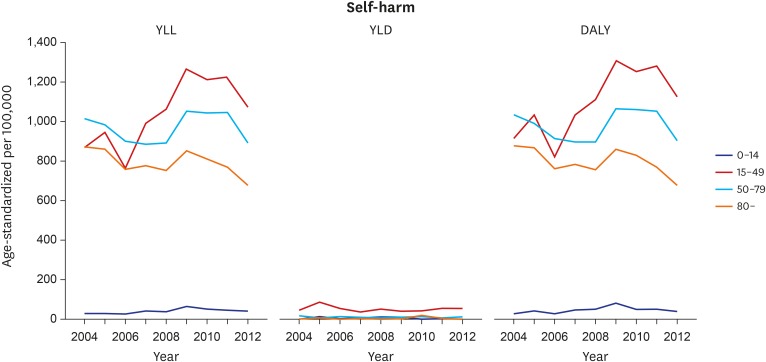
Injury burden from self-harm.
YLL = years of life lost, YLD = years lived with disability, DALY = disability-adjusted life year.
In the fall injury category, a large portion of the disease burden occurred in the older group. Although the YLLs dramatically decreased in the age group over 80 years, the YLDs increased consistently in the 50–79-year-old age group and the over 80-year-old age group. Therefore, the total injury burden of falls showed an increasing pattern in both groups (Fig. 3).
In the self-harm injury category, overall, the range of the YLL distribution was more than 10 times the range of the YLD scale. Thus, the DALYs presented similarities with the YLL distribution. Overall, the burden of self-harm injury was high in the age group 15 years and over, especially in the 15–49-year-old age group (Fig. 4).
DISCUSSION
In this study, we analyzed the temporal transition of the injury burden in Korea. Our study population were composed of fatal injuries, and non-fatal injuries that required hospital admission based on nationwide, population-based, annual injury datasets (death statistics and the Korean National Hospital Discharge Survey).
To understand the burden of disease related to medical utilization, it is necessary to examine the current state of medical use in the country. The Korean Health Insurance Service (NHIS), is in charge of operating and managing national health insurance. NHIS scheme officially started with employees at the workplace and gradually expanded. All people in Korea are eligible for coverage under the NHIS Program since 1989. In 2016, the total number of covered people was greater than 50.7 million, which accounted for more than 97.1% of the total population. The remaining 2.9% were supported by the Medical Aid Program. NHIS premiums are lower than other Organisation for Economic Co-operation and Development (OECD) countries, and the ratio of self-pay is relatively high. However, medical access is easy and utilization rate is high. As of 2015, the hospital average length per patient was 16.1 days, twice the OECD average of 8.2 days, and the number of doctor's consultation per patient was 16 times higher than the OECD average of 6.9 times.16 Especially in the case of road traffic accidents, the payment system is divided into automobile insurance and national health insurance. In addition, the patient freely chooses a doctor and a hospital, and the payment method is applied to the fee-for-service (FFS) payment system. The medical use rate is high due to the wide protection of NHIS, medical delivery system, and payment system. Therefore, the YLD measurements based on medical use data may be overestimated in terms of direct medical costs.
The authors used the classification of injury causes (mechanism), the injury nature, and the weight of disability, the GBD study was used as it was. Additionally, similar to the 2010 GBD study, age weighting and time discount were excluded from the YLD measurements. The injury DALY rates from 2004 to 2012 were similar and accounted for approximately 6,500 per 100,000 population. The percentage of YLLs in the DALYs was 31.7% in 2004 and gradually decreased to 24.7% in 2012. The YLDs relatively increased from 68.3% to 75.3%, and the YLL:YLD ratio was 1:3 in 2012 (Supplementary Table 1).
According to the GBD analysis, the burden of injury in Korea in 2010 was 695.28 (479.65–971.51) YLDs per 100,000 and 2,990.08 (2,770.03–3,269.27) DALYs per 100,000. YLDs accounted for approximately 25% of the DALYs in the 2010 GBD.17 However, this ratio in the present study differed from the ratio reported in the GBD study. In this article, YLLs (1,850 per 100,000) and YLDs (5,007 per 100,000) in 2010 accounted for approximately 27% and 73% of the DALYs (6,856 per 100,000), respectively.
Similarly, in a series of studies conducted in the Netherlands, the YLDs due to unintentional injury accounted for approximately two-thirds of the DALYs.818 The authors of these previous studies presumed that these differences occurred because the YLDs of non-hospitalized injuries were underestimated in the existing GBD studies.192021 Although the YLDs were estimated based on discharge (hospitalized) patient survey data in this study, the YLDs were much higher than the YLLs, as was reported in previous studies. This ratio made us to consider some assumptions of the analysis process. We defined the duration and probability of disability differently in the YLD calculation process. In this study, to define long-term disability and short-term disability, we referred to the standard treatment period according to the diagnosis (ICD-10) based on the instructions for the medical certificate of injury recommended in this country. In other words, a diagnosis with a standard treatment period of 4 weeks or more due to injury was defined as long-term disability (in this case assuming a remission rate of 0), whereas a diagnosis with a standard treatment period of less than 4 weeks was defined as short-term disability. The duration of short-term disability was used exactly as described in the standard treatment periods. The probability of disability was measured by replacing the number of injuries newly occurring every year across the country with the number of hospitalized patients using the incidence-based approach according to the characteristics of the data sources. The GBD study estimated the probability and prevalence of short term/long term disability using several follow-up surveys and the DISMOD program. However, in this study, short term disability and long-term disability were defined according to ICD-10 S/T code, and the YLD was measured using the disability weight and duration of the matched nature-of-injury for each code.7 Therefore, we assume that all injury where treatment duration of more than 4 weeks is expected, is life-long sequalae. For these reasons, overestimation may be possible, which is in contrast to the YLDs estimated in the GBD.
The leading causes of injury burden in Korea were single-injury causes, including traffic accidents, falls, and self-harm, which was similar to global trends. Globally, the leading causes of DALYs from 2005–2015 were traffic accidents (10th → 9th) and falls (30th → 26th), whereas self-harm increased to 19th from 21th.1 In 2004, the DALYs of traffic accidents were ranked first and falls were ranked second in Korea; however, traffic accidents have declined since that time, and falls have shown an increasing trend since 2010. Thus, the ranks have reversed since 2010. Subsequently, self-harm ranked third and showed an upward trend from 2004 to 2012 (Fig. 1). In the case of traffic accidents, both the YLLs and YLDs decreased continuously, the YLDs of falls increased more than the decreased width of the YLLs, and finally the DALYs of falls increased. The DALYs caused by self-harm were mostly caused by YLLs, increased overall for nine years and then showed a decreasing trend over the last four years.
In the age group analysis, YLLs of road injuries decreased in all age groups, and YLDs of road injuries decreased especially in the age group under 15 years of age, which characteristically showed a decreasing trend. However, these changes are not limited to Korea but are global trends. Rather, there are 8.4 deaths from traffic accidents per 100,000 people in Korea, far exceeding the OECD average, and deaths among pedestrians are close to three times the OECD average.16
Therefore, it is difficult to identify causal relationship between the traffic safety policy and the influence of laws and regulations on the reduction of disease burden caused by traffic accidents. However, multiphase traffic safety measures have been carried out during the study period. Every city has intensified their efforts for traffic safety education, traffic safety facility establishment, and traffic accident reduction campaigns.2223 However, the YLDs of elderly people showed an increasing pattern. Elderly pedestrians were at a higher risk, and a number of socio-economic and transport-related variables were clear determinants of elderly pedestrian injuries at the municipal level. Thus, policy makers need to concentrate on the elderly.2425 The government is making efforts through specific campaigns such as “Campaign to Reduce Road Accidents by Half” (2012) and “Traffic Accident Zero Resolution” (2013), as well as targeted campaigns for seniors and pedestrians. The disease burden is expected to continue to decline due to traffic accidents.
The DALYs of fall injuries were largest in the age group over 80 years, followed by the 50– 70-year-old age group. Fall injury DALYs in the 15–49 and 0–14-year-old age groups showed the same level. The YLLs of fall injuries has been steadily declining at the age of 80 years and over. Although there are limitations in analyzing the cause of YLL decline in this study, several possible factors can be considered. In the elderly, death due to falls are often caused by delayed complications rather than acute injury itself, and if the cause of death is misclassified as an infection or other complication, it is likely that the mortality related fall injuries is underestimated.2627 Possible factors include the prevention of fatal injury due to the extension of osteoporosis treatment and community exercise therapy as preventive measures for the elderly.2829 However, due to the global population aging, the incidence of fall injuries is continuously increasing. In August 2017, Korea has entered an aged society with over 14% of its population aged 65 and over and, has the fastest pace of aging in the world. During the nine-year period analyzed in this study, there was no significant trend for DALY of falls, but it has been increasing since 2008. In the future, it is estimated that the burden of the fall injuries caused by the explosion of the elderly population will increase rapidly.
Regarding self-harm, most of the DALYs are caused by YLLs in all age groups. Self-harm is highest in the 15–49-year-old age group, followed by the 50–79-year-old and 80-year-old and over age groups. In this study, DALY due to self-harm is taking the highest point in 2009. The DALYs in the 15–49-year-old age group increased overwhelmingly from 2006 to 2009 compared to the other age groups. The DALYs of self-harm showed an increasing trend, of which the YLLs and middle-aged group were the main proportions. The death rate due to self-harm was highest among the OECD nations. The Korean government has tried to reduce the number of suicides in recent years by instituting five-year plans for suicide prevention in 2004 and 2009 that expired in 2013.30 The Korean government also adopted the Act for the Prevention of Suicide and the Creation of Culture of Respect for Life in 2011.3132
After 2009, the DALYs of self-harm has been slowing down and has been declining since 2011, as shown in Fig. 1. Several studies have described this phenomenon as the suicide rates among working-age adults in Korea increased in the aftermath of the global financial crisis (2009).3334 These increasing patterns before and after the economic crisis were due to changes in macroeconomic conditions. However, these associations vary depending on sex, employment status and occupational roles. The causes of self-harm have various factors, and the efforts to reduce suicide have to proceed in many aspects based on age, sex, socio-economic status, employment and occupation.
From the 2013 GBD study, injuries continue to be an important cause of morbidity and mortality in the developed and developing world. The decline in rates for almost all injuries is so prominent that it warrants a general statement that the world is becoming a safer place in which to live. However, the patterns vary widely by cause, age, sex, region and time, and large improvements still need to be made.
To date, several studies have investigated the injury burden. However, no study has evaluated the time trend. In this study, we showed the burden of injury by mechanism and concentrated on self-harm, falls, and road injuries. Because medical resources are not infinite, the distribution is an important factor when making policies to reduce mortality and morbidity. In this study, various trends were observed for each mechanism. The self-harm injury mechanism showed an increasing trend. In Korea, self-harm is a major problem in society, and policy makers have been trying to reduce the rate of self-harm. However, self-harm maintains high mortality, and relatively young people are affected. Therefore, decision making about resource distributions should more concentrated on self-harm in Korea.
This study has several limitations. Although medical aid in Korea has easy accessibility and extensiveness, not all injuries are covered. Patients who visited emergency rooms or general clinics but did not require hospitalization were not included in these data. Further study should consider the outpatient injury burden and patients who only visit an emergency department.
Finally, the disability weight in this study used the disability weight of the GBD study. The medical environment in Korea is different from other countries, which will cause an increase or decrease in the disease burden by each mechanism.
The leading causes of the injury burden in Korea were road injuries, falls, and self-harm. The overall DALYs of road injury tended to decrease. This trend is particularly noticeable in the YLLs and age groups under 15 years of age. Fall injuries do not tend to be consistent but are continually high in the age group over 50 years of age. Finally, the total DALYs of self-harm have recently shown a gradual decreasing tendency in all groups over the age of 15 years.
 XML Download