

 PDF
PDF Citation
 Print
Print


INTRODUCTION
Particulate matter 2.5 µm or less in diameter (PM2.5) is becoming a global health threat. Previous systematic reviews of epidemiologic studies revealed causal relationships between PM2.5 exposure and mortality outcomes such as ischemic heart disease, chronic obstructive pulmonary disease, lung cancer, and cerebrovascular disease.1 According to a recent report from the World Health Organization (WHO), a global estimation of about 3 million deaths and 84 million disability-adjusted life years (DALYs) were attributable to the ambient PM2.5 exposure in 2012.2 The Global Burden of Disease (GBD) group reported that ambient PM2.5 is the fifth ranking mortality risk factor, which accounts for the 4.2 million deaths and 103 million DALYs in 2015.3 Due to increasing number of studies reporting possible associations between ambient particulate matter exposure and diverse health outcomes, total disease burden from particulate matter exposure might be higher than the current estimation indicate.4
There is a growing public interest regarding PM2.5 in the Republic of Korea. Among the Organization for Economic Co-operation and Development (OECD) countries, Korea has the second highest population weighted annual PM2.5 exposure levels with 29 μg/m3 in 2015.5 Decreasing trends of the annual particulate matter concentrations has been flattened in recent years, and days with high concentrations of particulate matter has been increased in Korea.67 To meet the increasing public demands, the government of Korea commenced a sub-national level forecasting system on particulate matter 10 µm or less in diameter (PM10) and PM2.5 from February 2014 and January 2015, respectively. The government unveiled special management measures to deal with PM2.5 in June 2016 and, as part of the process, eight old coal-fired power plants (30 years or older) were shut down for 1 month in June 2017.
Recent health impact assessment of air pollution from the global levels of estimation indicates that 11,523 and 18,148 deaths were attributable to ambient PM2.5 exposure in Korea for 2012 and 2015, respectively.28 However, no study has been conducted at the sub-national levels to evaluate the spatial distribution and the temporal trends of the health burden across Korea.
Therefore, in this study, we conducted a sub-national level analysis to estimate the health burden attributable to PM2.5 exposure and evaluated the temporal trends of the health burden in Korea. We used the latest publicly available population structure and mortality data with modeled PM2.5 concentration covering all the sub-national regions of the country from 2006 to 2015.
METHODS
Study design
Korea is composed of eight metropolitan cities and nine provinces. Each metropolitan city is composed of ‘gu’ while provinces are composed of ‘si’ and ‘gun,’ which are the basic administration units of Korea. To calculate the number of deaths attributable to PM2.5 in the sub-national level, we need following three information: 1) annual PM2.5 concentrations, 2) the population structure, 3) age and disease specific mortality rates. For this study, annual PM2.5 concentration and the population structure data were collected in basic administration unit levels, while the mortality data were collected in metropolitan cities or the province level.
PM2.5 exposure data
We used a Weather Research and Forecast (WRF, version 3.3.1) - Sparse Matrix Operator Kernel Emission (SMOKE, version 3.1) - Community Multiscale Air Quality (CMAQ, version 4.7.1) system to prepare daily PM2.5 concentration from 2006 to 2015 in the basic administrative unit levels. Details of the modeling methodologies and validation results are presented in a previous research articles.910 In brief, we utilized the modeling system to estimate formation, transport, and removal of PM2.5. We used the CMAQ with the AERO5 aerosol module and the Statewide Air Pollution Research Center version 99 to simulate air quality in Korea. We conducted meteorology simulation using WRF with the National Center for Environmental Protection FNL (Final) data as the initial field. The CMAQ-ready meteorological inputs were prepared using the Meteorology Chemistry Interface Processor version 3.6. For anthropogenic emissions, the Korean National Emissions Inventory named Clean Air Policy Support System 2010 was processed with SMOKE. Biogenic emissions were estimated with the Model of Emissions of Gases and Aerosols from Nature (MEGAN). We adopted two modeling domains with horizontal resolutions of 27-km and 9-km. The coarse modeling domain covers the Northeast Asia including China, Japan, and Korea. Simulation results from the coarse modeling domain was used to derive the boundary conditions for the 9-km modeling domain. Gridded hourly PM2.5 concentrations from CMAQ simulations for the fine model domain were then resampled for each administration in Korea based on a GIS shape file. During the process, hourly PM2.5 observation data were nudged on the modeling field to minimize model uncertainties.
Population structure and the mortality rate data
To calculate the health burden attributable to PM2.5, we used the 2015 population census data, which are the results of the complete enumeration survey. Owing to the enumeration surveys being conducted every five years, we used the mid-year population of the resident registration data from 2006 to 2015 to estimate the temporal trends of the health burden. The number of the population for different age groups (25–29, 30–34, 35–39, 40–44, 45–49, 50–54, 55–59, 60–64, 65–69, 70–74, 75–79, and 80–) in each administrative unit (‘si,’ ‘gun,’ and ‘gu’) were collected from the Korean Statistical Information Service website.11
Mortality data of each city and province were collected from the Korean Statistical Information Service MicroData Integrated Service homepage.12 We selected the following four disease endpoints (corresponding International Classification of Disease, 10th revision code): ischemic heart disease (IHD, I20–I25), chronic obstructive pulmonary disease (COPD, J40–J44), lung cancer (LC, C33–C34), and cerebrovascular disease (stroke, I60–I69) to calculate the health burden attributable to PM2.5 exposure. Disease outcomes were selected based on the epidemiological studies indicating their robust causal relationship with PM2.5 exposure.113 Age-specific mortality rate (/100,000 persons) was calculated for the city or province levels by dividing the number of yearly age groups, and cause-specific mortality rate with the corresponding mid-year population. We calculated the city or province level mortality rates because public deaths registration data were unavailable in basic administration unit levels.
Statistical analysis
We applied cause-specific integrated exposure-response (IER) functions developed for the Global Burden of Disease 2010 and 2013 to estimate the premature mortality attributable to ambient PM2.5.13 In previous health impact assessment studies, researchers used diverse concentration-mortality functions based on epidemiological cohort studies to estimate the health burden attributable to PM2.5. However, most of the previous studies were conducted in Western regions where PM2.5 concentrations were relatively low, resulting in uncertainties regarding concentration-mortality functions at higher PM2.5 concentration. Therefore, researchers integrated the relative risk (RR) values of diverse sources of PM2.5 such as the second-hand tobacco smoking, active tobacco smoking, and the household air pollution from burning solid fuels to estimate the concentration-mortality functions in higher PM2.5 concentration. The IER functions have been widely used by the WHO, GBD groups, and other researchers for estimating the health burden attributable to PM2.5.2314
Based on previous research article which provided parameters for the calculated IER functions, we calculated the mean values of RR and their 95% confidence intervals for PM2.5 concentrations ranging from 0–150 μg/m3 in 0.1 μg/m3 steps.13 The lower and upper bounds of counterfactual concentration with theoretical minimum risk, which indicates no health benefits for reducing PM2.5 concentration below certain concentration, were defined as 5.8 and 8.8 μg/m3, respectively.
In previous global PM2.5 health impact assessment studies, the basic unit for the calculation of the health burden attributable to PM2.5 was 10 km × 10 km grid cell. They used the global spatially resolved estimates of annual average ambient PM2.5 concentrations in 10 km × 10 km resolutions, the global gridded population data within the same resolution, the regional level mortality, and demographic data to calculate the mortality impacts of PM2.5. Detailed calculation equations were as follows:


Where Mi,j is premature mortality for grid cell i (for disease j) located in region k (consisting of N sub-grid cells), Pi is the population in grid cell i, Ij,k is the average mortality rate for disease j in region k, RRj(Ci) is the IER RR value for the disease j at PM2.5 concentration of C (for grid cell i).14 To estimate the health benefits (△Mi,j, change in mortality) of achieving the WHO PM2.5 air quality guideline values of 10 μg/m3, the following equation was used:

This approach could be very useful for calculating and comparing country level PM2.5 health burden by using the global level estimates (population, PM2.5 concentration, mortality) in the same unit resolution (10 km × 10 km grid and regional level). However, up to date demographic and mortality data of each country are often not used for the analysis and sub-national level estimates for most of the countries were not available. In addition, 10 km × 10 km grid cell may not clearly reflect the regional differences in the age structure and the mortality rates in various metropolitan cities and provinces of a single country. Besides, the demographic and mortality data are organized in administrative units in most of the countries and thus have to be converted into 10 km × 10 km grid cell levels.
Therefore, we used the same equations but applied minor changes regarding the basic calculation units. Our basic analysis units were ‘si,’ ‘gun,’ and ‘gu,’ the basic administrative units for the metropolitan cities and provinces of Korea. For example, for the calculation of premature mortality in metropolitan cities, the above equation was modified as follows: where Mi,j is premature mortality for ‘gu’ i (for disease j) located in metropolitan city k (consisting of N number of ‘gu’), Pi is the population in ‘gu’ i, Ik is the average mortality rate in metropolitan city k. We applied the same concept for calculating the premature mortality in major provinces by using the population and PM2.5 concentration data in ‘si’ and ‘gun’ levels. The 95% confidence intervals for the attributable mortality and the changes in mortality was estimated by applying 2.5% and 97.5% RR values of IER model for certain PM2.5 exposure values.
To account for the lag effect of PM2.5 exposure, we used annual levels of PM2.5 concentration for 2006 (the earliest year with modelled PM2.5 data) to calculate number of deaths attributable to ambient PM2.5 for 2015 as suggested in the previous article.15 In addition, we averaged PM2.5 concentration from year 2006 to 2015 and estimated the number of deaths attributable to ambient PM2.5 for 2015 as a sensitivity analysis. We additionally evaluated the annual temporal trends of the health burden from 2006 to 2015 in metropolitan cities and provinces of Korea by using yearly PM2.5 concentration, mortality, and population structure data. SAS version 9.4 (SAS Institute Inc., Cary, NC, USA) and R statistical software (version 3.1.3; R Foundation for Statistical Computing, Vienna, Austria) were used in our analysis.
RESULTS
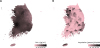
The annual average PM2.5 concentration and the population weighted PM2.5 concentration for 2015 in Korea were 24.4 μg/m3 and 25.1 μg/m3, respectively. Fig. 1 shows the spatial variation in annual PM2.5 concentrations across major metropolitan cities and provinces of Korea. The sub-national regions with the highest PM2.5 concentrations (over 30 μg/m3) are located in Incheon metropolitan city (Dong-, Nam-, Namdong-, and Bupyeong-gu) and Gyeonggi (Bucheon-si), Chungcheongnam (Nonsan-si), and Jeollabuk (Jeonju-, Iksan-, Gimje- and Wanju-si) provinces (Supplementary Table 1).
Fig. 1
Mean concentration of PM2.5 and population density by basic administrative unit of the Korea in year 2015. (A) PM2.5 concentration and (B) population density.
PM2.5 = particulate matter less than 2.5 µm in diameter.
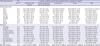
The total 11,924 deaths were attributable to PM2.5 exposure in 2015 in Korea. Specifically, 3,303 deaths due to IHD, 637 deaths due to COPD, 2,338 deaths due to LC, and 5,646 deaths due to stroke were attributable to PM2.5 exposure in 2015 (Table 1). Fig. 2 and Table 1 shows the spatial variation of PM2.5 health burden across the sub-national regions. Particularly, deaths attributable to PM2.5 exposure were concentrated around Seoul (1,763 deaths), Busan (947 deaths), and Gyeonggi province (2,352 deaths). The number of attributable deaths due to PM2.5 according to basic administration level of metropolitan cities and province are summarized at Supplementary Table 1.
Table 1
Health burden attributable to ambient PM2.5 exposure in major cities and provinces of the Republic of Korea
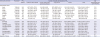
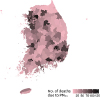
Fig. 2
Spatial distribution of the health burden attributable to ambient PM2.5 exposure in basic administrative units of the Korea.
PM2.5 = particulate matter less than 2.5 µm in diameter.
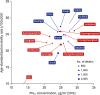
General association between annual mean PM2.5 concentration and age-standardized mortality rate due to PM2.5 exposure in Korea for year 2015 are described in Fig. 3. There was positive correlation between age-standardized mortality rate and annual mean PM2.5 concentration. After age-standardization (per 100,000 population), mortality rate attributable to PM2.5 exposure was high in Sejong, Daegu, and Incheon metropolitan cities and Jeollabuk and Chungcheongbuk provinces.
Fig. 3
Association between annual mean PM2.5 concentration and age-standardized mortality rate due to PM2.5 exposure in Korea for year 2015.
PM2.5 = particulate matter less than 2.5 µm in diameter.
By simulating the reduction in the annual mean values of PM2.5 according to the WHO guideline value (10 µg/m3), about 8,539 deaths could be averted in Korea (Table 2). By conducting a 9-year time lag analysis with the annual PM2.5 concentration of 2006, the total of 13,856 deaths were attributable to PM2.5 exposure in 2015 (Supplementary Table 2). In the sensitivity analysis, with an average annual PM2.5 concentration from 2006 to 2015, the total 12,808 deaths were attributable to PM2.5 exposure in 2015 (Supplementary Table 3).
Table 2
Health benefits for meeting WHO PM2.5 air quality guideline in major cities and provinces of the Republic of Korea
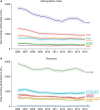
Most of the metropolitan cities and provinces in Korea showed decreasing or stable temporal trends of the mortality burden attributable to PM2.5 from 2006 to 2015 (Fig. 4, Supplementary Tables 4 and 5). Compared to 2006, Seoul, Busan, and Incheon metropolitan cities and Gyeonggi province showed marked decrease in number of attributable deaths due to PM2.5 in 2015. However, compared to 2014, Jeollanam and Jeollabuk provinces and Gwangju metropolitan city showed increase in number of attributable deaths due to PM2.5 in 2015.
DISCUSSION
By using PM2.5 modeling data, IER functions, and up to date publicly available population and mortality data, we evaluated the health burden attributable to PM2.5 in the metropolitan cities and provinces of Korea. The total 11,924 deaths were attributable to PM2.5 in Korea in 2015. There was also decreasing trends of the health burden in most of the cities and provinces when compared to 2006. As expected, deaths burden attributable to PM2.5 was elevated in the basic administrative units where PM2.5 concentration and population density are high.
After age-standardization (per 100,000 population), mortality rate attributable to PM2.5 was high in Sejong, Daegu, and Incheon metropolitan cities and Jeollabuk and Chungcheongbuk provinces. Although number of deaths attributable to PM2.5 was highest in Seoul metropolitan city and Gyeonggi province, age-standardized rate become relatively low in these two sub-regions. We believe this results comes from high population density of Seoul and Gyeonggi, but relatively low age and disease specific mortality rates compared to other sub-regions of Korea.
According to 2016 WHO report, a total of 11,523 deaths and 253,512 DALYs were attributable to PM2.5 exposure in Korea for 2012.2 These results are comparable to our estimation of 11,872 deaths for 2012. In the recent GBD 2015 study, premature deaths attributable to PM2.5 exposure in Korea in 2005, 2010, and 2015, were 13,094, 13,777, and 18,148 deaths, showing increasing trends in the three most recent five-yearly estimates.8 However, in our study, the number of deaths attributable to PM2.5 generally decreased since 2006 in Korea, even though there were increasing patterns in 2013 and 2014. This discrepancy might have resulted from the use of different PM2.5 exposure data, mortality data, and IER functions between this study and that used in the 2015 GBD study. For example, although we used publicly available IER functions of GBD 2010 and 2013 in our study, there was a recent update of the functions with changes in the theoretical minimum risk exposure levels (2.4–5.9 μg/m3) and the model fitting algorithm, which resulted in a higher estimation of RR values compared to the previous GBD studies.3 Therefore, there are possibilities of underestimation in our study compared to recent 2015 GBD study. However, our study aim was to assess the regional and temporal variations in mortality burden due to PM2.5 exposure in Korea and the above changes of RR values may not affect our trend analysis results seriously.
Therefore, we believe that the major discrepancy between our trend analysis and those of the GBD 2015 results may come from the use of different PM2.5 exposure data. In the GBD 2015 study, annual mean population weighted exposure levels of PM2.5 increased from 25.18 μg/m3 (2010) to 28.66 μg/m3 (2015) in Korea.8 In our modeling data, the annual mean concentration and the population weighted PM2.5 levels were 26.85 μg/m3 and 28.74 μg/m3 for 2010, and 24.47 μg/m3 and 25.13 μg/m3 for 2015, respectively. Because the annual PM2.5 exposure data of 2015 used in our study shows about 3 μg/m3 lower levels compared to PM2.5 exposure data used in GBD studies, this may results in lower values of number of attributable deaths for year 2015. However, recent country wide monitoring data shows similar results to our PM2.5 exposure modelling data. The annual report of air quality in Korea indicated decreasing trends of annual PM10 concentration from 2006 to 2015.67 In addition, the only available nation-wide PM2.5 ground monitoring data of 2015 (Seoul: 23, Busan: 26, Daegu: 26, Incheon: 29, Gwangju: 26, Daejeon: 28, Ulsan: 25, all measured in μg/m3) showed comparable results to that of the PM2.5 modeling data used in our study (Seoul: 24.2, Busan: 25.9, Daegu: 24.9, Incheon: 27.6, Gwangju: 24.1, Daejeon: 27.2, Ulsan: 24.6 all measured in μg/m3). Therefore, we believe our modeling data is reasonable for the health impact assessment study of PM2.5 in the sub-national levels and our study results may contribute additional spatial and temporal information to the global level estimations. However, long term (from 2004 to 2013) particulate matter measurement data from one monitoring site in Seoul showed complicated annual PM2.5 concentration patterns, despite their overall decreasing pattern.16 Therefore, we believe our PM2.5 modeling data should be further validated using satellite data and in the future, by a nation-wide ground monitoring data of PM2.5.
There are few studies which evaluated the health impacts of particulate matter in Korea. By using modelled PM2.5 data, a total number of 15,346 (4,498–26,242) deaths were estimated to be attributable to PM2.5 exposure in Seoul, Incheon and Gyeonggi provinces in 2010.17 Another city level health impact assessment study estimated that about 12,000 deaths can be averted by reducing PM2.5 concentrations in the seven metropolitan cities of Korea according to the WHO guideline values of 10 μg/m3.18 However, these previous results could be overestimated due to the use of the linear exposure mortality functions and by incorporating diverse disease outcomes rather than the four specific disease outcomes (IHD, LC, COPD, and stroke) analyzed in our study and in GBD studies. Another study estimated number of attributable deaths due to PM2.5 exposure by using exposure data of GBD 2013 and linear exposure mortality functions.19 They estimated that about 16,871 deaths were attributable to PM2.5 exposure in year 2013 by LC, IHD, and stroke.
In our study, deaths burden attributable to ambient PM2.5 exposure has generally decreased from 2006 to 2015. However, about 52% and 98% of the Korean population are still living in conditions with an annual concentration level of PM2.5 greater than the WHO interim Target 2 (25 μg/m3) and Target 3 (15 μg/m3) recommendations with our data. There were 43% and 79% of days in Korea, which exceeded WHO interim Target 2 and 3 recommendations in year 2015. Furthermore, nearly all of the total Korean population were living in conditions where annual concentration level of PM2.5 are above 10 μg/m3 and 92% of days were above 10 μg/m3 in 2015. By decreasing the annual PM2.5 concentrations to 10 μg/m3, about 8,500 deaths in 2015 can be averted. Therefore, despite the decreasing patterns of the PM2.5 attributable deaths in our analysis, there is great need for improvement regarding PM2.5 in Korea.
Significant decrease in the mortality burden in Seoul, Incheon, and Gyeonggi provinces, which are Seoul Metropolitan Areas (SMA), are worthy of note. In December 2003, the Special Act on the improvement of air quality in SMA was legislated.20 Based on the Special Act, the first phase of the air quality improvement plan for the SMA (2005–2014) aimed to reduce the annual PM10 and nitric oxide concentrations to 40 μg/m3 and 22 ppb respectively by regulating the total amount of the emissions in the workplace, supplying low-emission vehicles, and strengthening the gas emission management regulations. As a result, ground monitored annual PM10 concentration in SMA showed decreasing patterns from 2005 to 2015.67 Decreasing patterns of the annual PM2.5 modeling data and attributable deaths in our study in SMA also indicate the effects of the Special Act in some aspects.
In December 2013, the Ministry of Environment, the Republic of Korea announced the implement of policy guidelines named the Comprehensive countermeasures against particulate matter.2122 The main measures were, implementation of nationwide forecasting and warning system on particulate matter, enhancing international level cooperation with neighboring countries, and commencing the second phase (2015–2024) of the air quality improvement plan for the SMA. In June 2016, the government unveiled the emission reduction plan and Special Measures on Air Quality, to tackle particulate matter issues, with the intention to reduce the average annual concentration of PM2.5 to be comparable to that of European city in 2021 (20 μg/m3) and 2026 (18 μg/m3).23 However, current governmental measures have not considered regional disparities and temporal trends of the health burden attributable to PM2.5 exposure. Therefore, we believe our study findings can enable politicians and local government officers to recognize the current sub-national states of the health burden and to estimate potential health benefits by reducing particulate matter concentration in sub-national levels.
Several conventional limitations of PM2.5 health-impact assessment studies are known, and particularly, issues regarding the use of IER functions was related to our study. First, IER functions only provide cause specific RR values for IHD, LC, COPD, and stroke for adults.13 Due to the increasing number of studies reporting the possible association between air pollution exposure and diverse disease outcomes, our study may underestimate the true health burden attributable to PM2.5 exposure. Second, because IER functions do not provide the source-specific RR, health impact assessment studies using IER functions rely on the concentration of the particulate matter. Therefore, the different components and sources of the PM2.5 at the sub-national regions were not considered in our analysis. However, evidence of different toxicities from the sources and the components of particulate matters are still lacking.2425 Third, the RR estimates of large-scale cohort studies used to model IER functions were based on studies conducted in western countries where the annual PM2.5 values are relatively low, compared to Korea. Although IER functions are believed to provide reasonable estimates of RR values at higher PM2.5 concentrations,3 large scale cohort studies evaluating PM2.5 exposure and mortality outcomes in regions with high levels of PM2.5 concentrations are needed to generate more precise estimates for the calculation of the health burden in polluted countries. Therefore, cohort studies evaluating the association between chronic PM2.5 exposure and mortality outcomes in Korea are needed in the future. Finally, for trend analysis of HIA, we used yearly PM2.5 concentration, demographic, and mortality data. Therefore, results of the trend analysis should be interpreted with caution due to the lag effects of particulate exposure on several chronic disease outcomes evaluated in this study. In addition, number of attributable deaths due to PM2.5 exposure depends on not only annual PM2.5 concentration, but also population structure and age and disease specific mortality data. Therefore, improvements on medical quality and system of Korea during 2006–2015 can also affect the trend analysis results.
In conclusion, about 11,924 premature deaths were attributable to PM2.5 exposure in 2015 in the Republic of Korea. Our findings show that further actions to improve air quality in Korea would substantially improve health burden. Due to the spatial variations attributable to PM2.5, future particulate matter resolution policies should be reflective of the city and province level health-impact assessment results.
 XML Download