

 PDF
PDF Citation
 Print
Print


INTRODUCTION
According to a recent Korean study, the prevalence of obesity in school-age children aged 7 to 18 years dramatically increased from 8.4% in 2008 to 14.3% in 2016, and that in infants and preschool children also increased from 1.4% in 2008 to 2.8% in 2015.1 Obese children may develop serious health problems including metabolic syndrome (MS), non-alcoholic fatty liver disease (NAFLD), and insulin resistance; and the prevalence of MS and NAFLD is increasing in children with obesity, with the latter being a well-known complication of obesity. It has been established that chronic, untreated NAFLD can progress to non-alcoholic liver cirrhosis, even among pediatric patients.23 Although a number of studies have established NAFLD as a significant metabolic complication of obesity, the prevalence and risk factors of NAFLD in the children aged ≤ 10 years have not been clearly reported yet.45
The disease spectrum of NAFLD includes simple steatosis, NAFLD, non-alcoholic steatohepatitis (NASH), and liver cirrhosis.2 Since patients with NAFLD are often asymptomatic or present with nonspecific symptoms and signs, it is difficult to recognize NAFLD without diagnostic investigations. Liver biopsy is the gold standard investigation for the diagnosis of NAFLD36; however, its application is limited in children as parents are often reluctant to consent for invasive procedures. Therefore, the presence of fatty liver disease and its severity are often determined by imaging studies such as abdominal ultrasonography (USG) and magnetic resonance imaging (MRI), in both adults and children.25
Recently the European Society of Pediatric Gastroenterology, Hepatology, and Nutrition (ESPGHAN) have recommended these noninvasive imaging studies for the diagnosis of NAFLD in the pediatric population. Abdominal ultrasound is cost-effective and capable of contributing to the early detection of NAFLD. However, not all children with obesity undergo abdominal USG because NAFLD screening is not usually done in young children and parents may not consent to imaging studies for a clinically silent disease. Therefore, biochemical predictors of early onset NAFLD would help clinicians and parents in deciding whether abdominal USG should be performed in such children.
Regarding noninvasive predictors for NAFLD, adult studies have previously revealed the following risk factors of NASH: male sex, elevated levels of serum alanine aminotransferase (ALT), aspartate aminotransferase (AST), γ-glutamyltranspeptidase (γGT), alkaline phosphatase (ALP), uric acid, and triglycerides; type II diabetes, hypertension, and elevated serum acute-phase proteins such as C-reactive protein (CRP).78910 Predictors of NAFLD among obese children and adolescents, independent of age, were raised serum AST, ALT, uric acid, fasting glucose, and body mass index (BMI) z-score.101112 While some researchers have attempted to identify predictors of NAFLD,23 there are currently no studies on predictors of NAFLD among young children with obesity, when compared to adolescents with obesity.
The clinical course of untreated NAFLD, especially NASH, can be progressive and chronic if not detected and treated in the early stage of the disease. Therefore, in the present study, we investigated the prevalence of early onset NAFLD among young children aged 10 years or less compared to that of adolescents with obesity, and identified predictors of early onset NAFLD in children with obesity aged younger than 10 years.
METHODS
Study subjects
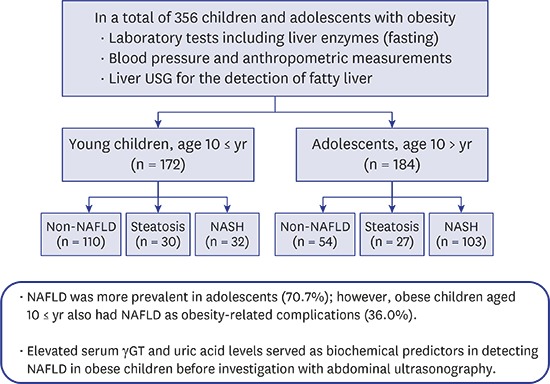
A total of 356 children with obesity aged 4.2–18 years (mean 10.6 ± 3.3 years; 233 boys, 123 girls) who underwent abdominal USG at the Seoul National University Bundang Hospital (SNUBH) between April 2004 and February 2016 were included. Abdominal ultrasound was performed by screening all patients who visited the obesity clinic. For this retrospective study, the electronic medical record database at the SNUBH was reviewed and overweight or obese children between 4 and 18 years of age and without any evidence of organic disease were selected. All subjects underwent relevant laboratory testing, and anthropometric and blood pressure (BP) measurements. The subjects were divided into two groups; young children aged 10 years or less (n = 172) and adolescents over 10 years old (n = 184). Our subjects were also divided into the three groups according to their NAFLD status: no NAFLD, simple steatosis, and NASH. Exclusion criteria were concomitant liver disease, hepatitis B virus or hepatitis c virus infection, inborn error of metabolism, Wilson's disease, medication use in the past 3 months, and alcohol consumption.
Anthropometric data
Anthropometric measurements were collected from the medical records. Body weight was measured in kilograms up to 1 decimal place using a digital weighing scale and height was measured up to 1 decimal place using a standard stadiometer. BMI was expressed in kg/m2 and BMI z-score was determined according to Korean national growth charts.13 Abdominal circumference (AC) was measured using a measuring tape at the child's maximum waist girth in standing position.
BP measurement
BP was measured at least twice in a resting state by using electromanometer. Hypertension was defined as repeated BP measurements greater than the 95th percentile for the child's age, height, and sex.
Laboratory tests
Blood was drawn after at least 12 hours fasting. Laboratory tests for obesity-related complications were: ALT, AST, γGT, uric acid, triglyceride, total cholesterol, high-density lipoprotein (HDL), and low-density lipoprotein (LDL). Fasting blood glucose and fasting insulin were used to calculate homeostatic model assessment of insulin resistance: HOMA-IR = fasting insulin (μIU/mL) × fasting glucose (mmol/L) × 0.55/22.5.14
Diagnosis of MS
Based on the modified National Cholesterol Education Program-Adult Treatment Panel III (NCEP-ATP III) criteria, MS was diagnosed if more than three of the following conditions were present: 1) AC exceeding the 90th percentile for the child's age and sex, 2) hypertension over the 90th percentile for the child's age, height and sex, 3) fasting plasma glucose ≥ 100 mg/dL or the presence of diabetes mellitus, 4) serum triglyceride ≥ 110 mg/dL, and 5) HDL cholesterol < 40 mg/dL.15
USG
Abdominal USG was performed by pediatric radiologists and fatty liver was determined according to the following radiologic parameters; parenchymal echogenicity of the liver, far gain attenuation in right intercostal view at posterior axilla line, gallbladder wall blurring in right sagittal subcostal view, portal vein blurring in right intercostal view at anterior axilla line, and hepatic vein blurring in right intercostal view at middle axilla line.1617 Based on the echogenicity of liver parenchyma, the degree of fatty liver was defined as mild, moderate, or severe.18
Diagnosis of NAFLD and the classification of its spectrum
NAFLD was defined as a spectrum of chronic liver disease with hepatic fat accumulation in liver parenchyma in the absence of alcohol consumption, genetic diseases, or medications that cause steatosis, ranging from simple fatty liver without inflammation to fatty liver with necroinflammation and fibrosis. As NAFLD is typically diagnosed when more than 5% of hepatic fat infiltration is proven by liver imaging or histologic estimation,10192021 the diagnosis of NAFLD basically included the presence of fatty liver on any of them.
NAFLD was divided into simple steatosis and NASH; simple steatosis was defined when hepatic fat accumulation was noted without specific changes suggesting steatohepatitis, with or without fibrosis.10192021 Even though liver biopsy is the current gold standard diagnostic method to diagnose the presence and severity of NAFLD, it is an invasive method in pediatric patients.10 Thus, the diagnosis of simple steatosis was based on liver USG, and NASH was defined in cases with elevated ALT and abnormal ultrasonographic findings as described in previous studies.2021222324 Serum ALT levels above 40 IU/L were regarded as abnormal.1025
Statistical analysis
SPSS 22.0 software (IBM Corp., Armonk, NY, USA) was used to perform statistical analyses. Data were expressed as mean ± standard deviations. Parametric analysis was performed using one-way analysis of variance (ANOVA) with Student's t-test. The chi-square test was applied to assess the difference between NAFLD and no NAFLD among young children and adolescents with obesity. Multiple regression analysis was used to evaluate risk factors of NAFLD in these subjects. P value less than 0.05 was regarded as statistically significant.
RESULTS
Patient characteristics
A total of 356 children with obesity (233 boys, 123 girls; 4.2–18 years of age, mean age 10.6 ± 3.3 years) who visited the obesity clinic at the SNUBH were recruited and were classified into the 2 groups according to age; group of young children — children aged ≤ 10 years (n = 172) and adolescents group — children aged > 10 years (n = 184). In each group, subjects were divided into 2 groups based on the presence of NAFLD: non-NAFLD vs. NAFLD; and into 3 groups based on the spectrum of NAFLD (non-NAFLD vs. simple steatosis vs. NASH).
The prevalence of MS was 40 of 172 (23.3%) in the group of young children and 65 of 184 (35.3%) in the adolescents group (P = 0.020). The prevalence of NAFLD was 62 of 172 (36.0%) in the young children and 130 of 184 (70.7%) in the adolescents.
Comparison of parameters of obesity and obesity-related complications
Clinical features and biochemical markers of obesity and obesity-related complications in each group are listed in Table 1 and compared between the 2 NAFLD groups (non-NAFLD vs. NAFLD) and among the 3 NAFLD groups (non-NAFLD vs. simple steatosis vs. NASH) (Table 1).
Table 1
Comparison of clinical features and biochemical markers for obesity and obesity-related complications in young children and adolescents
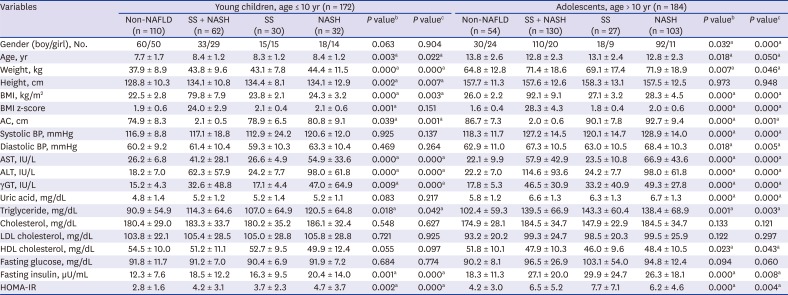
Analysis among three groups were used for statistical analysis of parametric continuous variables. Data presented as mean ± standard deviation.
NAFLD = non-alcoholic fatty liver disease, SS = simple steatosis, NASH = non-alcoholic steatohepatitis, BMI = body mass index, BMI z-score = age and sex adjusted body mass index z-score, AC = abdomen circumference, BP = blood pressure, AST = aspartate transaminase, ALT = alanine transaminase, γGT = γ-glutamyltranspeptidase, LDL = low-density lipoprotein; HDL = high-density lipoprotein, HOMA-IR = homeostatic model assessment of insulin resistance.
aP value less than 0.05 is regarded as statistically significant; bP value was the result of statistical analysis between non-NAFLD and NAFLD groups, and NAFLD included simple steatosis and NASH; cP value was the result of statistical analysis among the 3 NAFLD groups; non-NAFLD, simple steatosis, and NASH groups.
In young children with obesity, comparison of obesity-related factors between the non-NAFLD group and the NAFLD group revealed that there were significant differences in age, weight, height, BMI, BMI z-score, AST, ALT, γGT, triglyceride, fasting insulin, and HOMA-IR. In adolescents with obesity, there were significant differences in systolic BP in addition to sex, age, weight, BMI, BMI z-score, AC, AST, ALT, γGT, uric acid, triglyceride, fasting insulin, and HOMA-IR between the non-NAFLD group and the NAFLD group.
When it comes to comparison among the 3 NAFLD groups in young children with obesity, there were significant differences in age, weight, height, BMI, AC, AST, ALT, γGT, triglyceride, fasting insulin and HOMA-IR, as similar to the results of comparison between the 2 NAFLD groups (Table 1). In the adolescents group, there were significant differences in sex and diastolic BP as well as systolic BP, sex, age, weight, BMI, BMI z-score, AC, AST, ALT, γGT, uric acid, triglyceride, fasting insulin, and HOMA-IR among the 3 NAFLD groups (Table 1).
Factors predictive of NAFLD in each group
In young children, multiple regression analysis of NAFLD for AC, BMI z-score, γGT, uric acid, and triglycerides, and univariate analysis for HOMA-IR, between the non-NAFLD and NAFLD groups revealed that serum γGT (P < 0.001) and uric acid (P = 0.037) were significant indicators of developing NAFLD in these children (Table 2). The risk of developing NAFLD increased 1.4 times with an increase in serum uric acid levels, and the risk increased 1.2 times with an increase in serum γGT levels in the group of young children (Table 2).
Table 2
Factors predictive of NAFLD among young children and adolescents with obesity
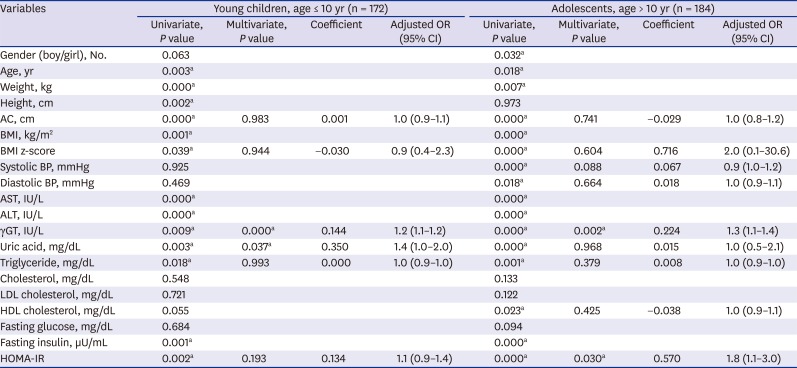
Analysis of covariance (Student's t-test and χ2 test) was used for statistical analysis and multiple regression analysis. Data presented as mean ± standard deviation.
OR = odds ratio; CI = confidence interval, NAFLD = non-alcoholic fatty liver disease, BMI = body mass index, BMI z-score = age and sex adjusted body mass index z-score, AC = abdomen circumference, BP = blood pressure, AST = aspartate transaminase, ALT = alanine transaminase, γGT = γ-glutamyltranspeptidase, LDL = low-density lipoprotein, HDL = high-density lipoprotein, HOMA-IR = homeostatic model assessment of insulin resistance.
aP value less than 0.05 is regarded as statistically significant.
Multiple regression analysis in the adolescents group for AC, BMI z-score, systolic BP, diastolic BP, γGT, uric acid, triglyceride, HDL cholesterol, and univariate analysis of HOMA-IR between non-NAFLD and NAFLD groups revealed that serum γGT (P = 0.002) and HOMA-IR (P = 0.030) were significant indicators of NAFLD, with an odds ratio of 1.3 for γGT and 1.8 for HOMA-IR (Table 2).
Factors reflecting of early onset NASH in obese children
Multiple regression analysis was performed for factors predictive of NASH in children with obesity of each group such as age, serum γGT, uric acid, and univariate analysis of HOMA-IR between the non-NAFLD and the NASH groups revealed only serum γGT (P < 0.001) was significantly indicative of NASH in young children with obesity (Table 3). Risk of NASH increased 1.3 times with an increase in serum γGT levels in the group of young children (Table 3).
Table 3
Factors predictive of NASH among young children and adolescents with obesity
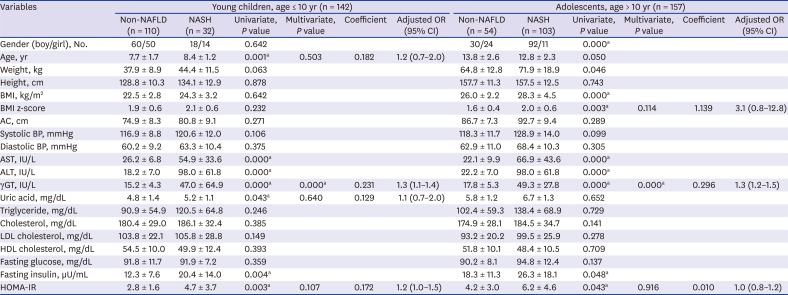
Analysis of covariance (Student's t-test) was used for statistical analysis and multiple regression analysis. Data presented as mean ± standard deviation.
OR = odds ratio, CI = confidence interval, NAFLD = non-alcoholic fatty liver disease, BMI = body mass index, BMI z-score = age and sex adjusted body mass index z-score, AC = abdomen circumference, BP = blood pressure, AST = aspartate transaminase, ALT = alanine transaminase, γGT = γ-glutamyltranspeptidase, LDL = low-density lipoprotein, HDL = high-density lipoprotein, HOMA-IR = homeostatic model assessment of insulin resistance.
aP value less than 0.05 is regarded as statistically significant.
In the adolescents group, serum γGT (P < 0.001) was a significant indicator of NASH according to multiple regression analysis performed for variables such as BMI z-score, serum γGT, and univariate analysis for HOMA-IR (Table 3).
DISCUSSION
Recent studies have shown that the prevalence of obesity and incidence of NAFLD have dramatically increased in children.23 NAFLD has become the most common form of chronic liver disease in children and a serious complication of obesity.3 In children, NAFLD is seen to be a relatively benign condition, but it may progress to fibrosis and cirrhosis, especially in cases of NASH and can cause a life-threatening long-term outcome. The disease is mostly silent and is accidentally found through elevated liver enzyme levels or abnormal findings on abdomen USG. The gold standard for the diagnosis of NAFLD is percutaneous liver biopsy,36 but this invasive procedure has some risks such as pain and bleeding and hence there is a need to identify noninvasive approaches to predict NAFLD not only in adults but also in children and adolescents.78910111226 Particularly in young children, there is a need to develop a noninvasive, reliable, and simple test that can replace the invasive liver biopsy to detect NAFLD at an early stage, and a new high-performance predictor for early detection of NAFLD. However, most of the studies on predictors of NAFLD were evaluated in older children (adolescents) and adults, and there were no studies on predictive markers for early onset NAFLD in children with obesity younger than 10 years of age. Early detection of obesity-related metabolic abnormalities including NAFLD in such children is important because early diagnosis and intervention can prevent disease progression and result in good prognosis.
Up to date, several studies have suggested potential predictors for NAFLD in the pediatric population. In a study that recruited 1,180 Chinese school children and adolescents in Shanghai, BMI and waist-hip ratio were suggested as effective indices to predict the presence of NAFLD; however, this study was designed targeting both children and adolescents aged from 6 to 14 years old.11 In another study in 268 Italian children and adolescents with obesity, aged between 6 and 20 years, standard investigations on obesity-related complications including abdominal US revealed that BMI z-score, serum ALT, uric acid, glucose, and insulin during oral glucose tolerance test are predictors of NAFLD.11
As our study focused on early onset NAFLD in young children with obesity, our design had two groups of children divided based on age: young children and the adolescents group. Since alcohol, contraceptive pills, or dramatic hormonal changes of puberty do not influence young children, NAFLD in this age group is the result of obesity if we exclude all metabolic disorders causing hepatic steatosis. Our results showed that increased serum γGT and uric acid levels are useful biochemical markers to predict early onset NAFLD in young children with obesity after excluding all possible underlying organic causes of hepatic fat accumulation, whereas only serum γGT levels were indicative of NAFLD in the adolescents group. Interestingly, although from univariable analysis, many factors were observed to predict NAFLD, multivariable analysis revealed only elevated serum γGT and uric acid levels as significant predictors in young children with obesity similar to the findings in previous studies.2728
Hepatic steatosis is a manifestation of excessive triglyceride accumulation in the liver. It can develop from excessive influx of free fatty acids (FFA) from adipose tissue and diminished hepatic efflux of FFA. FFAs are inducers of beta-oxidation and elicit mitochondrial oxidative stress, generating free radical formation.2029 Thereby FFAs create oxidative stress and destroy hepatocytes, which may influence hepatobiliary tract in obese patients, and thus it may elevate serum γGT levels in obese children and adolescents with NAFLD. Adult patients with NAFLD having elevated liver enzymes and serum γGT, compared to the controls, showed higher stages of fibrosis on liver biopsy, indicating that high serum γGT levels are a risk factor for advanced disease condition.28 The only predictor of early onset of NASH, a disease entity of progressive NAFLD with necrosis, inflammation, and fibrosis, was found to be serum γGT in young children as well as adolescents with obesity. Therefore, elevated serum γGT levels in children with obesity can be a key predictor for NASH in both younger children and adolescents.
Furthermore, according to a recent study, the synthesis of FFAs in the liver is associated with the de novo synthesis of purine, accelerating uric acid production. Uric acid is produced mainly in the liver and to a less extent in the small intestine, and the production of uric acid depends on the intake of purine-rich diet such as red meat and seafood.30 Increased serum uric acid level is associated with obesity itself or obesity-induced complications such as MS, cardiovascular disease, dyslipidemia, hypertension, and insulin resistance; thus, it is also an important laboratory finding of NAFLD in obese patients.2030
From the results of our study, it can be recommended that abdomen USG or abdominal MRI should be performed for early detection of NAFLD in cases of abnormally elevated serum γGT and uric acid levels in young children with obesity. Clinical application of these results will be helpful in the diagnostic course of suspected NAFLD in young children with obesity.
Our study has some limitations. First, this is a retrospective, single center study design without disease-free controls. Second, there can be a selection bias as our study recruited patients who visited a pediatric obese clinic at our tertiary medical center, even though it is a community-based hospital. Especially, in children over 10 years of age, laboratory anomalies may be detected through routine health check-up at school, and it may cause selection bias. Third, we diagnosed NAFLD based on abdomen ultrasound findings and liver enzyme levels although the gold standard of diagnosis is liver biopsy. Ultrasound can miss early stage of hepatic steatosis with fat contents < 20%, and this may lead to underestimation of NAFLD, especially in younger children aged 10 years or less. We defined NASH by ultrasound and elevated ALT because it is hard to perform liver biopsy in younger children. Some children but not all the subjects underwent liver biopsy as their parents refused it due to the possibility of procedure-related complications and invasiveness. Thus, there may be some limitations in detecting NASH in obese children having completely normal liver enzyme levels in the present study. Further studies with a prospective design and controls are needed to evaluate the predictors of NAFLD in this age group.
In conclusion, the prevalence of obesity-related complications was higher than expected in adolescents with obesity in our study. While MS and NAFLD were more prevalent in adolescents, younger children also demonstrated MS and NAFLD as obesity-related complications. There are limitations to performing an invasive diagnostic procedure in younger children compared to adolescents and adults, and hence clinical application of noninvasive predictive markers for early onset NAFLD such as increased serum γGT and uric acid levels may be useful in examining young children with obesity effectively during the early stages of disease progression. Therefore, these biomarkers may serve as effective biochemical predictors for early detection of NAFLD in young children with obesity and help prevent the disease progression with early interventions of lifestyle modification, thus favoring long-term outcomes.
 XML Download