

 PDF
PDF ePub
ePub Citation
 Print
Print


INTRODUCTION
Tremendous progresses have been made in surgical technique, perioperative treatment, and immunosuppressive therapy in liver transplantation (LT). The incidence of early complications such as infection, bleeding, rejection, wound healing, and others have decreased recently. However, late complication such as post-transplant de novo cancers has become one of the leading causes of late mortality after LT (1).
LT is associated with a 2- to 7-fold higher risk of de novo malignancy (2) after adjusting for age and gender. The incidence of LT has been reported to be ranging from 4% to 16% depending on various factors such as the length of follow-up, age distribution of recipients, types of immunosuppressive regimens, and geographic location (34). In western countries, the leading type of de novo malignancy has been reported to be post-transplant lymphoproliferative disorders (PTLD) and skin cancer (5). However, solid organ cancer is dominant in Asian countries (6). In Korea, de novo solid malignancy after LT including colorectal malignancy is common and its prevalence is gradually increasing (7). Furthermore, de novo malignancy shows more aggressive nature and growth compare to malignancy in non-transplant setting patients. Therefore, different screening and therapeutic strategy are needed for de novo malignancy.
The leading cause of higher incidence of death of patients with de novo malignancy is its aggressiveness. Life-long immunosuppressive therapy is needed for de novo malignancy (89). Death due to de novo malignancy accounts for more than 20% of deaths during long-term follow up (10). Therefore, optimal immunosuppression is needed to reduce the incidence or increase the survival after the development of de novo malignancy.
Metformin (M) is an oral biguanide agent widely used for treating type 2 diabetes mellitus (DM). Several studies have indicated that M can lower the risk of developing cancers including those of the breast, pancreas, colon, and the prostate both in vitro and in vivo (1112131415). The mechanisms underlying the anticancer effects of M can vary (16). Among these various mechanisms, activation of adenosine monophosphate-activated protein kinase (AMPK) is pivotal (1617). Thus, M may have some additional benefits in case of de novo cancer.
However, no optimal immunosuppressant (IS) strategy is available in the setting of de novo colon cancer after LT. The objective of this study was to provide theoretical background of optimal IS strategy for de novo colon cancer after LT.
MATERIALS AND METHODS
Cell lines
Three colon cancer cell lines (HT29, SW620, and HCT116) were used in in vitro studies, all colon cancer cell lines were purchased from Korean Cell Line Bank (KCLB). HT29 colon cancer cell line was also used in BALB/c-nude mice animal models.
Groups according to regimens
In in vitro and in vivo experiments according to IS and their combinations with M, the following 8 groups were used: negative control (C), sirolimus (S) alone, tacrolimus (T) alone, cyclosporin A (CsA) alone, M alone, metformin/sirolimus (Met/S), metformin/tacrolimus (Met/T), and metformin/cyclosporin A (Met/CsA).
3-(4,5-Dimethylthiazol-2-yl)-2,5-diphenyltetrazolium bromide (MTT) assay
Cell viability was determined colorimetrically using MTT-assay after 48 hours of incubation. HT29, SW620, and HCT116 cells (3 × 10³ cells) were seeded into 96-well plates and separated into groups based on investigated regimens. The concentrations of ISs were 5 ng/mL for S, T, and CsA, and 100 ng/mL for M. After different treatments, 20 µL of 5 mg/mL MTT was added to each well (0.1 mg/mL) and incubated for 4 hours. The supernatant was aspirated and the formazan crystals in each well was dissolved in 200 µL of dimethyl sulfoxide (Sigma-Aldrich, St. Louis, MO, USA) and incubated at 37°C for 30 minutes. The absorbance value of each well at wavelength of 570 nm was read on a microplate reader.
Western blot analysis
Western blot analysis was performed using published procedures (18). Briefly, after cells were incubated with ISs for 48 hours, their total protein was extracted. To isolate protein products from cell cultures and tumor tissues, RIPA buffer (Sigma-Aldrich) was used. Whole cell lysates were resolved by sodium dodecyl sulfate-polyacrylamide gel electrophoresis and transferred onto nitrocellulose membranes (Amersham Pharmacia Biotech, Piscataway, NJ, USA). After incubation in 5% bovine serum albumin (BSA) for 1 hour at room temperature (RT), blots were incubated with monoclonal antibody overnight at 4°C followed by incubation with a secondary antibody (1:2,000) for 1 hour at RT. Blots were developed using an enhanced chemiluminescence detection kit (ECL; Amersham Pharmacia Biotech). For protein loading analyses, a monoclonal glyceraldehyde 3-phosphate dehydrogenase (GAPDH; 1:5,000) was used. Primary antibodies used in western blot analysis included p-mTOR antibody (1:1,000), p-70S6K (1:1,000), p-4EBP1 (1:1,000), livin (1:1,000), survivin (1:1,000), E-cadherin (1:1,000), transforming growth factor (TGF)-β (1:1,000), and pSmad3 (1:1,000) antibody (Cell Signaling Technology, Beverly, MA, USA).
In vivo experiment
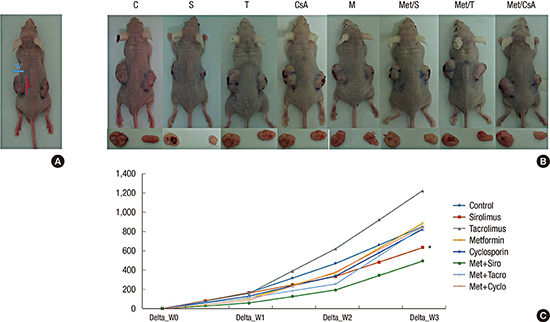
In order to create the mouse model of tumor growth, 48 BALB/c nude mice were inoculated subdermally with 4 × 10⁶ HT29 cells in both flanks and divided on 8 groups by 6 mice. These mice were raised for 1 week until the tumor became palpable and measurable. After measuring the weight and initial tumor size, these mice were randomly separated into 8 groups. They were administrated immunosuppressive and biguanide agents at the following doses: S (1 mg/kg), T (1 mg/kg), CsA (5 mg/kg), and M (250 mg/kg). These mice were fed per os daily for 4 weeks. The weight and tumor size were measured every 3 days. Approximate tumor size initially and during follow up were calculated using the following formula (Fig. 1A): length × width2 × 0.5. These animals were sacrificed after 3–4 weeks of treatment. Protein was obtained from tumor tissue and western blot was performed as described above.
Fig. 1
Measurement of tumor size. (A) Approximate tumor size in BALB/C nude animal models was calculated using the following formula: length (L) × width (W)2 × 0.5.
Changes of tumors volume in experimental models. Data are representatives of in vivo experiment. (B) BALB/c nude mice with dissected tumors. (C) The sizes of tumors during 3 weeks of growth; On week 1, week 2, and week 3, the tumor volume in group of M + S showed significant reduction compare to that in the control group. Among lonely used regimens, the most potent one was S.
CTL = control, S = sirolimus, T = tacrolimus, CsA = cyclosporin A, M = metformin, Met/S = metformin/sirolimus, Met/T = metformin/tacrolimus, Met/CsA = metformin/cyclosporine A.
*P < 0.05 compared to control.
RESULTS
In vitro experiment
M and S significantly inhibited HT29, SW620, and HCT116 cell viabilities
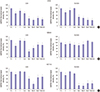
M and S alone exerted markedly (P < 0.05) antiproliferative effects on HT29, SW620, and HCT116 cell lines in MTT assay. Furthermore, a significant (P < 0.05) decrease in the proliferation of colorectal cancer cells was observed in the combined treatment group compared to that of the M or S alone treatment group (Fig. 2A-C). In contrast, treatment with T or CsA alone failed to significantly affect the proliferation of human colorectal cancer cells.
Fig. 2
Cell viabilities of HT29, SW620, and HCT116 cell lines after treatment. After 48 hours of incubation, cytotoxicity was analyzed by MTT assay. Percentages of cell viability were decreased in S and M treated groups in HT29 (A), SW620 (B), and HCT116 (C) cell lines. Of note, the combination of M and S appeared to have significant cell-suppressive effect, achieving significantly lower viability than S or M alone. No changes in cytotoxicity profile after treatment with T or CsA alone were observed in any of the 3 colon cancer cell lines. Data are expressed as mean ± SD. Data are representatives of 3 separate experiments.
MTT = 3-(4,5-dimethylthiazol-2-yl)-2,5-diphenyltetrazolium bromide, CTL = control, S = sirolimus, T = tacrolimus, CsA = cyclosporin A, M = metformin, Met/S = metformin/sirolimus, Met/T = metformin/tacrolimus; Met/CsA = metformin/cyclosporin A, SD = standard deviation.
*P < 0.05 compared to control group; †P < 0.05 compared to S, M.
M and S treatment altered the expression of mTOR pathway proteins, epithelial-mesenchymal-transition (EMT) related proteins, and apoptosis related proteins in HT29, SW620, and HCT116 cell lines
Western blot analysis showed that treatment with M or S was associated with inhibition of p-mTOR, p-70S6K, and p-4EBP1 proteins. In HT29, SW620, and HCT116 cells, M-induced downregulation of p-mTOR was reinforced by co-treatment with S. However, no significant changes in p-mTOR, p-70S6K, or p-4EBP1 proteins were identified in groups treated with T or CsA alone (Fig. 3A-C).
Fig. 3
Western blot analyses of proteins associated with mTOR signalling pathway. Representative Western blots and densitometric quantitative results of p-mTOR, p-70S6K, and p-4EBP1 protein expression in HT29 (A), SW620 (B), and HCT116 (C) cells after 48 hours of treatment. M and S treatment alone and the combination of Met/S significantly down-regulated p-mTOR, p-70S6K, and p-4EBP1 protein expression levels. T and CsA alone showed no such effect. GAPDH was used to show equal protein loading. Data are expressed as mean ± SD. Data are representatives of 3 separate experiments.
CTL = control, S = sirolimus, T = tacrolimus, CsA = cyclosporin A, M = metformin, Met/S = metformin/sirolimus, Met/T = metfosrmin/tacrolimus, Met/CsA = metformin/cyclosporin A, GAPDH = glyceraldehyde 3-phosphate dehydrogenase, SD = standard deviation.
*P < 0.05 compared to control group; †P < 0.05 compared to S, M.
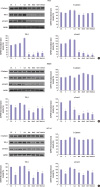
In HT29 colon cancer cell line, the combination of M and S showed significant and potent synergistic inhibition effect on apoptosis related proteins. Treatment with S or M alone also showed significant (P < 0.05) inhibition on apoptosis related proteins. Livin and Survivin were inhibited by 67.6% and 54.8%, respectively (Fig. 4A). However, in SW620 colon cancer cell line, M alone showed the most potent and significant inhibition on apoptosis related proteins. Livin and Survivin in SW620 colon cancer cell line were inhibited by 66.8% and 18.8%, respectively (Fig. 4B). In HT116 colon cancer cell line, apoptosis related proteins were also significantly (P < 0.05) inhibited by treatment with a combination of M and S. Livin and Survivin were inhibited by 70.4% and 80.4%, respectively.
Fig. 4
Changes in the expression of apoptosis-related proteins in HT29, SW620, and HCT116 cells lines. M and S synergistically downregulated livin and survivin expression levels in HT29 (A), SW620 (B), and HCT116 (C) cells after 48 hours of incubation. Unlike M or S, T and CsA failed to alter the expression level of livin or survivin in HCT116 cell lines. Data are expressed as mean ± SD. Data are representatives of 3 separate experiments.
CTL = control, S = sirolimus, T = tacrolimus, CsA = cyclosporin A, M = metformin, Met/S = metformin/sirolimus, Met/T = metformin/tacrolimus, Met/CsA = metformin/cyclosporin A, SD = standard deviation, GAPDH = glyceraldehyde 3-phosphate dehydrogenase.
*P < 0.05 compared to control group; †P < 0.05 compared to S, M.
All 3 colon cancer cell lines belong to tumors with aggressive growth nature. In that sense, the effect of treatment revealed some interesting findings in EMT-related proteins. All 3 cell lines well responded to M treatment with anti-metastasing effect. Regarding the expression levels of TGF-β and p-Smad3 in HT29 colon cancer cell line, the combination of M and all combinations of ISs significantly inhibited their expression (Fig. 5A). Of note, the combination of S and M had the best inhibition effect on the expression of TGF-β and p-Smad3 in SW620 colon cancer cell line (Fig. 5B). In HCT116 colon cancer cell line, calcineurin inhibitor (CNI) alone showed worse effect compare to mTOR inhibitor. M alone showed significantly good effect in inhibiting the expression of TGF-β and p-Smad3 (Fig. 5C). Investigation of EMT-related proteins revealed one interesting fact: in all 3 cell lines, E-cadherin was suppressed very slightly, or even overexpressed, especially when cells were treated by CNI alone (Fig. 5A-C).
Fig. 5
Changes in expression levels of EMT-related proteins based on Western blot. TGF-β and p-Smad3 were effectively inhibited by M alone or in combination with S, CsA, and T in HT29 (A), SW620 (B) and HCT116 (C) cells. E-cadherin expression was significantly reduced in HT29 cells after treatment with M alone or in combination with S. The level of E-cadherin expression did not change in SW620 or HCT116 cells after treatment. Data are expressed as mean ± SD. Data are representatives of 3 separate experiments.
CTL = control, S = sirolimus, T = tacrolimus, CsA = cyclosporin A, M = metformin, Met/S = metformin/sirolimus, Met/T = metformin/tacrolimus, Met/CsA = metformin/cyclosporin A, EMT = epithelial-mesenchymal-transition, SD = standard deviation, TGF = transforming growth factor, GAPDH = glyceraldehyde 3-phosphate dehydrogenase.
*P < 0.05 compared to control group; †P < 0.05 compared to S, M.
In vivo experiment
Tumor growth was significantly inhibited in Met/S group
The effectiveness of antitumor therapy was observed in animal models based on the reduction of tumor size. Our study revealed that tumor growth in group Met/S was significantly inhibited compare to that in control group. However, tumor growth was not significantly inhibited in CNI groups compare to that in the control when CNI was used alone or in combination with M (Fig. 1B and C).
Expression levels of mTOR related, apoptosis related, and EMT-related proteins were significantly inhibited in S and Met/S groups based on western blot using tissue samples
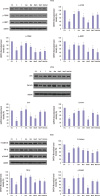
As mentioned above, the HT29 colon cancer cell line was used in animal models. After 4 weeks of treatment, all experimental models were sacrificed and tumors were dissected and the expression levels of mTOR related, apoptosis related, and EMT related proteins were determined by western blot analyses. Although the expressional level of mTOR related, apoptosis related, and EMT related proteins were affected by treatment with CsA, the differences were not statistically significant (Fig. 6A-C). However, in all tissue samples, the expressional level of mTOR related, apoptosis related, and EMT related proteins were significantly (P < 0.05) inhibited by treatment with S and Met/S. The inhibition effect of M alone was less than that of S alone.
Fig. 6
Western blot analysis for tissue samples from groups of S along and Met/S revealed significant decrease in the expression levels of all investigated proteins in HT29 cells. CsA had the weakest effect in this research. Data were representatives of animal experiment.
CTL = control, S = sirolimus, T = tacrolimus, CsA = cyclosporin A, M = metformin, Met/S = metformin/sirolimus, Met/T = metformin/tacrolimus, Met/CsA = metformin/cyclosporin A, GAPDH = glyceraldehyde 3-phosphate dehydrogenase.
*P < 0.05 compared to control group.
DISCUSSION
Immunosuppression therapy used in transplantation is associated with increased incidence of various cancers. Remarkably, it has been reported that patients who have undergone LT for primary sclerosing cholangitis appear to be at an additional increased risk for developing de novo malignancy as high as 9.6% compared to LT patients for other causes (19). Skin cancers and lymphoproliferative diseases are the most common malignancies in Western countries (3) while solid cancers including colon cancer are more common in Asia (6). De novo colon cancer is mostly diagnosed between 16 and 50 months after LT. It is associated with a worse prognosis compared to the general population (20). Therefore, the role of de novo colon cancer after LT as a health concern in liver transplant recipients is steadily increasing.
Nowadays, all LT centers have their own immunosuppression strategies. Generally, they are quite similar in the usage of CNI. There are a few guidelines for cancer surveillance or optimal IS-regimens for de novo colon cancer (21). Especially, no studies have compared various IS on de novo cancers including colon cancer which is reported in up to 0.6% in the LT population (22). Our study is the first to evaluate anti-tumor effect of various IS with or without M on 3 different colon cancer cell lines.
We found that a combination of S and M showed the best anti-tumor effect on colon cancer cell lines. In in vitro experiment, M and S showed significant and synergistic effect in suppressing cell viability and inhibiting the expression levels of mTOR pathway related, apoptosis related, and EMT related proteins in all 3 colon cancer cell lines (HT29, SW620, and HCT116). The combination of M and CNI (T, CsA) failed to show similar synergism. We observed similar results in in vivo experiment. The per os treatment with the combination of M and S for 4 weeks dramatically reduced tumor growth likely via inhibiting mTOR pathway proteins and apoptosis related proteins.
CNIs are the most potent and reliable IS in clinical settings. S has not been approved by Food and Drug Administration (FDA) because of higher incidence of acute cellular rejection and other complications associated with its use. Therefore, the most common regimen for long-term survivor is CNI monotherapy (T monotherapy). However, CNI is known to increase tumor development and growth (23). Therefore, if de novo cancer is developed in long-term survivals, we need to change the IS.
Several experimental and clinical studies have reported the benefits of mTOR inhibitors (S) compare to CNI in patients after LT in terms of nephrotoxicity and hepatocellular cancer (HCC) recurrence (242526). They can lower the incidence of new-onset diabetes after transplant (NODAT) and improve insulin requirements in patients with NODAT (27). Therefore, mTOR inhibitors are increasingly used in clinical setting. Several reports have also shown the anti-tumor effect of S on colon cancer cells (2829). However, those reports focused on treatment purpose in non-transplantation setting. Our study is the first one that focuses on the effect of various ISs on colon cancer cell lines simulating de novo colon cancer after LT.
In this study, we found that S had significant anti-tumor effect on colon cancer cell lines. Furthermore, our results demonstrated both efficacy and potential benefits of the combination of S and M in inhibiting colon cancer. Thus, a combination of S and M is recommended for patients with de novo colon cancer after LT.
M is the first line of treatment for type 2 diabetes. However, it has been shown significant anti-cancer effect both in vitro and in vivo using various cancer cell lines (3031). M is also well-known to possess therapeutic benefits for nondiabetic indications in cardiology (32), gerontology (33), and metabolic syndrome (34) as a diet to lower bodyweight even in euglycemic people without of DM. Therefore, it can be prescribed together with S without any further harmful effect.
Through this in vitro and animal study, we provided theoretical background of IS regimen for de novo colon cancer. However, further clinical study is needed to prove this result in clinical settings.
In conclusion, for de novo colon cancer after LT, conventional CNI immunosuppressive treatment could be effectively changed to mTOR-inhibitors in combination with M. This combination could be optimal in reducing tumor growth, apoptosis, and metastasis.
 XML Download