

 PDF
PDF ePub
ePub Citation
 Print
Print


INTRODUCTION
Obesity is clearly acknowledged as a risk factor for several chronic diseases, including diabetes mellitus, cardiovascular disease, and some kinds of cancer (12). In addition, epidemiologic data indicate that obesity is associated with a wide range of chronic gastrointestinal (GI) complaints, many of which overlap with functional gastrointestinal disorders (FGIDs) such as irritable bowel syndrome (IBS) or dyspepsia (345). Recently, this association raises the possibility that altered gut microbiota, especially small intestinal bacterial overgrowth (SIBO), may play a significant role in both obesity and IBS (67).
SIBO is defined as an increase in the number and/or alteration in the type of bacteria in the upper GI tract (8). Hydrogen (H2)/methane (CH4) breath tests using glucose or lactulose have been widely used as a diagnostic tool to establish SIBO. Of these breath tests using carbohydrate ingestion, an increase in H2/CH4 concentration in the exhaled breath following glucose administration has a high specificity for diagnosing SIBO. However, since glucose is rapidly absorbed in the upper gut, its usefulness is limited to diagnosing SIBO of the proximal intestine. Hence, increased response of H2/CH4 in the breath within 90 minutes after ingestion of the lactulose, which is resistant to hydrolysis by mammalian enzymes, is more commonly used to diagnose proximal and distal SIBO in patients with IBS (91011).
In humans, H2 and CH4 are produced by intestinal bacteria. Any imbalance of this intestinal microbiota, both qualitative and quantitative, might have serious health problems. For example, the over-production of CH4 gas by CH4-producing microflora could lead to an increase in weight gain and the development of obesity (12). The detection of CH4 is demonstrated to be significantly associated with a functional GI disease, constipation-predominant IBS (IBS-C) (131415). While, H2 gas forming-microflora causes non-constipation IBS (16). Some recent studies demonstrated that obesity is related to the non-constipation IBS, especially diarrhea IBS (1718). Another study reported that obesity may not predict the occurrence of non-constipation GI symptoms such as lower abdominal pain and diarrhea (19). Therefore, up to now, there have been inconsistent findings on the association of obesity and non-constipation IBS, and additionally, these studies were reported without assessing H2 gas forming SIBO.
To our best knowledge, the relationship between obesity and SIBO with H2 gas forming-microflora has not yet been studied in non-constipation IBS. Therefore, the aim of this study was to examine the relationship between obesity and SIBO as assessed by the lactulose H2 breath test (LHBT) in subjects with non-constipation IBS.
MATERIALS AND METHODS
Study subjects and design
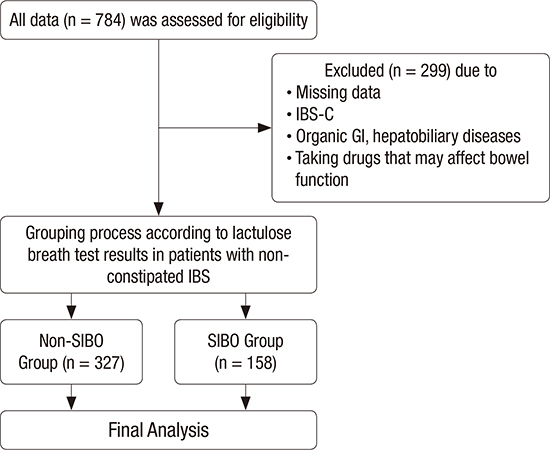
Patients with abdominal symptoms such as bloating, abdominal pain or discomfort, and abnormal bowel habit changes who visited the Health Promotion Center and the Department of Family Medicine at Ajou University Hospital, Suwon, Korea from September 2012 through July 2014 were selected as the subjects of this study. Among those with GI symptoms for this period, IBS was diagnosed as according to Rome III criteria after a detailed interview by a physician. IBS was defined recurrent abdominal pain or discomfort (at least 3 days per month in the last 3 months) with onset at least 6 months before diagnosis and association with 2 or more of the following: 1) improvement with defecation, 2) onset associated with a change in the frequency of stools, and 3) onset associated with a change in the form of stools. IBS subgroups were classified as IBS-C, diarrhea-predominant IBS (IBS-D), and mixed constipation and diarrhea IBS (IBS-M). These subjects were identified through an electronic search of the scheduling database of the clinic. We included 784 subjects, each aged over 20 years, who had undergone gastroduodenoscopy, colonoscopy, abdomen ultrasonography within the previous 2 years and, lactulose breath test (LBT) including those with current IBS symptoms at the time of the hospital visit 20). Of these, 726 patients were diagnosed with IBS; 153 patients with IBS-M (21.0%), 332 patients with IBS-D (45.7%), and 241 patients with IBS-C (33.1%).
Of the initial 784 subjects, we excluded 299 subjects who met one of the following conditions: Subjects with a history of, or symptoms consistent with, IBS-C; subjects with a history of other GI disorders (such as inflammatory bowel disease or peptic ulcer disease) and intestinal surgery (except appendectomy), or who for 1 month prior to the study used antibiotics, probiotics, or any other drug that could influence bowel function. Thus, 485 subjects were included in the final analyses (Fig. 1).
Anthropometry and data collection
The height and body weight of the participants were measured. Body mass index (BMI) was calculated as the weight divided by height squared (kg/m2). Waist circumference (WC) was measured by a trained nurse at the central part between the 12th rib and the iliac crest. The BMI groups were classified as “underweight and healthy” (BMI < 23), “overweight” (23 ≤ BMI < 25), and “obesity” (BMI ≥ 25) using Asian BMI classifications. Obesity was defined as a BMI equal to or above 25. Abdominal obesity was defined as a WC equal to or above 85 cm in women and 90 cm in men, according to the World Health Organization recommendation.
Data on alcohol consumption were collected through administration of a self-report questionnaire. Alcohol consumption in subjects was calculated and then converted to weekly alcohol consumption (grams of ethanol per week) by the graduated frequency method (21). At the time of the hospital visit, subjects were asked about their amount of moderate physical activity as follows: “During the last 7 days, on how many days did you do moderate physical activities for at least 30 minutes (e.g. bicycling at a regular pace, swimming at a regular pace)?” We used the data; and the frequency of weekly moderate physical activities was recorded. Subjects who had regularly smoked cigarettes during the past year were considered to be current smokers. Hypertension was defined as a systolic blood pressure (BP) ≥ 140 mmHg or a diastolic BP ≥ 90 mmHg, or the use of antihypertensive medication. Diabetes mellitus was defined as a fasting blood glucose ≥ 126 mg/dL or the use of oral hypoglycemic agents or insulin. Dyslipidemia was defined as a previously diagnosed hyperlipidemia and currently being on cholesterol medication.
LBT
All subjects were asked to have carbohydrate-restricted diets 1 day before the test to minimize their basal H2 excretion. Smoking and physical exercises were not allowed 2 hours prior to and during the test. Breath testing was initiated after mouth washing with 20 mL of 1% chlorhexidine solution. After an initial baseline breath sample was collected, subjects ingested 15 mL of syrup containing 10 g lactulose (Duphalac
®
; ChoongWaePharma Corporation, Seoul, Korea) taken with 200 mL of water. The breath samples were then measured thrice at 20-minute intervals during the first 1 hour and 15-minute interval 4 times during the following 1 hour. The samples were analyzed for H2 gas and CH4, using a model Breath Tracker SC Quintron gas chromatograph (Quintron Instrument Company, Milwaukee, WI, USA) and the results were recorded in parts per million (ppm). The LBT was considered positive for SIBO on the basis of the following criteria: A baseline value of H2 ≥ 20 or CH4 ≥ 10 ppm or/and a > 20 ppm increase in H2 or ≥ 10 in CH4 over the baseline within 90 minutes (101122).
Statistical analysis
All continuous variables were expressed as means ± standard deviation (SD), whereas categorical variables were presented as numbers and percentages. For intergroup comparisons, continuous variables were analyzed using the independent t-test. Categorical variables were analyzed using the χ2 test. Multivariate logistic analysis was used to evaluate correlation between obesity and SIBO and then, in order to examine the trend of positive or inverse relation between obesity and SIBO, subjects were categorized into 4 quartile groups according to BMI and WC. Analysis of variance (ANOVA) Trend analysis using polynomial contrasts was used to evaluate these associations. A P value of < 0.05 was considered statistically significant. The statistical analysis was performed using SPSS version 21.0 for Windows (SPSS Inc., Chicago, IL, USA).
RESULTS
General characteristics of the study subjects
A comparison of the characteristics of patients in both the SIBO patients and the non-SIBO subjects in non-constipation IBS is summarized in Table 1. A total of 485 patients (152 women, age [mean ± SD]: 48.0 ± 8.8 years) were included in the study. Of the 485 IBS patients, 158 (32.6%) subjects had positive results for LHBT. With respect to methanogenic infections, there were only 3 subjects among SIBO patients with a positive LHBT (data not shown). Alcohol consumption, moderate-intensity physical activity, the prevalence in diabetes mellitus, hypertension, dyslipidemia, and current smoking habits were similar between the 2 groups. However, compared to subjects without SIBO, those with SIBO had significantly lower values for BMI (24.8 ± 3.1 vs. 23.2 ± 3.2; P < 0.001) and WC (86.5 ± 8.2 vs. 82.7 ± 8.5; P < 0.001). In addition, the prevalence of obesity according to both BMI and WC levels was significantly lower in subjects with SIBO than for those in the non-SIBO group (obesity by BMI: 75.3% vs. 24.7%, P = 0.003; abdominal obesity by WC: 76.1% vs. 23.9%, P = 0.002).
Table 1
Comparisons between the SIBO group and the non-SIBO group (n = 485)
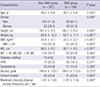
Data are expressed as a mean ± SD or number (percentage), as appropriate.
SIBO = small intestinal bacterial overgrowth, BMI = body mass index, WC = waist circumference, W = woman, M = man, HTN = hypertension, SD = standard deviation.
*P value was calculated using the independent t-test. †P value was calculated using the χ2 test.
Obesity and SIBO
We used a logistic regression model to evaluate the relationship between the existence of SIBO and obesity (as assessed with BMI and WC) (Table 2). According to the univariate analysis, the levels of BMI and WC were inversely associated with SIBO.
Table 2
Effect of obesity on SIBO as shown by univariate and multivariate analysis

SIBO = small intestinal bacterial overgrowth, OR = odds ratio, CI = confidence interval, BMI = body mass index, WC = waist circumference, W = woman, M = man.
*Multivariate analysis was performed by using binary logistic regression analysis. Adjusted for age, gender, current smoking habits, weekly frequency of moderate physical activity, diabetes mellitus, hypertension, dyslipidemia, and alcohol consumption.
In order to prove the independent inverse association between obesity and SIBO, multivariate regression analysis—incorporating age; gender; current smoking habits; the frequency of weekly moderate physical activity; the amount of alcohol consumption; and the existence of metabolic diseases such as diabetes mellitus, hypertension, and dyslipidemia—was used. After the adjustment for these potentially confounding factors, a significant negative association between obesity and SIBO has been observed. According to the analysis, the odds ratios (ORs) of SIBO were 0.396 (P = 0.018) for obesity (as defined by BMI) and 0.482 (P = 0.021) for abdominal obesity (as assessed by WC).
Subjects were then categorized into 4 quartile groups (Q1–Q4) according to BMI and WC (Table 3). We, again, examined the relationship between obesity and SIBO according to BMI and WC quartile categories. ORs decreased in an almost linear fashion as the BMI and WC quartile category increased from Q1 to Q4 (P for trend < 0.001). Consistently, compared to subjects in the lowest BMI and WC quartile, those in the highest BMI and highest WC quartile category had significantly lower odds for being at risk for SIBO after adjustment for potential confounders.
Table 3
The relationship between the BMI & WC quartiles and SIBO

BMI = body mass index, WC = waist circumference, SIBO = small intestinal bacterial overgrowth, OR = odds ratio, CI = confidence interval.
*Multivariate analysis was performed by using binary logistic regression analysis. Adjusted for age, gender, current smoking habits, weekly frequency of moderate physical activity, diabetes mellitus, hypertension, dyslipidemia, and alcohol consumption.
DISCUSSION
In this cross-sectional study, we found that subjects without H2-producing SIBO showed significantly higher levels of BMI and WC as compared to subjects with H2-producing SIBO. In addition, the prevalence of obesity (as defined according to both BMI and WC levels) were significantly lower in subjects with SIBO than among those in the non-SIBO group. Furthermore, when subjects were grouped based on BMI and WC quartile levels, increasing the quartiles of BMI and WC was significantly inversely associated with almost linear trends in SIBO. These associations were also consistent after adjustment for potential confounders. Therefore, these findings suggest that there is an inverse association between obesity and SIBO in non-constipation IBS.
The relationship between the status of obesity and SIBO has not yet been established. In this study, there was a negative correlation between obesity and SIBO of H2-gas-forming microflora. Even though it is hard for us to provide definite clarification between obesity and SIBO in non-constipation IBS, there are several possible explanations for the decreased prevalence of obesity in SIBO patients with H2-gas-forming microflora. One potential explanation for this association could be that SIBO, which was diagnosed via LHBT, can cause malabsorption and weight loss. In other words, SIBO may be accompanied by both maldigestion and malabsorption, which can lead to a variety of nutrient deficiencies and systemic manifestations. Bacteria, which are the principle offender in SIBO, might affect the enzymatic, absorptive, and metabolic actions of the macro-organism (23242526). For example, in the small gut, H2-producing microbiota with hydrolytic enzymes (e.g., sulfatases and β-glucuronidases) such as Bacteroides fragilis can deconjugate bile salts, which consequently limits the reabsorption across the mucosa (72728). The deconjugated bile acids are toxic to intestinal mucosa which results in mucosal inflammation. And then, in order to protect our body from toxins, the gut transit accelerates—which causes malabsorption of fat. In addition, when bile acids escape the enterohepatic cycle, free bile acids are excreted in the feces; this stimulates mucosal inflammation and malabsorption, leading to impaired micelle formation, fat malabsorption, and finally, fat storage reduction (293031).
Carbohydrate malabsorption may result from the intraluminal degradation of sugars by bacteria and from bacteria-related decreases in disaccharidase and brush-border hydrolase activity, and impaired monosaccharide absorption (32). Malabsorption of carbohydrates may also cause increased production of H2 gas, which is associated mainly with IBS-D (33). In addition, bacteria in the small intestine in patients with SIBO may produce more short-chain fatty acids (SCFAs). An increase in the concentration of SCFAs leads to acidification of the gut and deconjugation of bile acid (3435). This in turn may cause significant changes in water and electrolyte transport in the colon which can result in diarrhea (3637). Therefore, the prevalence of SIBO is inversely associated with obesity, which is paralleled by reduced absorption of micronutrients in non-constipated IBS.
In brief, the inverse relationship between H2-gas-forming microflora and the obesity may be due to insufficient absorption of fats and carbohydrates. Both the production of excess H2 gas and SCFAs from insufficient absorption of nutrients also affects shorter gastric transit time which results in non-constipated IBS. From these courses, subjects with SIBO tend to have a lower BMI and a lower WC.
The present study has several limitations. First of all, it is hard to prove causality since the study is retrospective and cross-sectional at a single center, which could have led to selection bias. Second, the LBT is not a gold-standard method in the diagnosis of SIBO, even though it is a great tool. LHBT has a low sensitivity and specificity in patients with rapid intestinal transit (3839). Thus, the possibility of false-positive and false-negative test results cannot be ignored. Third, there is an omission of data regarding caloric intake which is a crucial factor for obesity and IBS. However, despite these limitations, our study has numerous strengths. Not only has this research used a large-scale cohort of 485 subjects, but it has also been the first study to evaluate the relationship between obesity and SIBO. Also, this study has newly suggested that H2-gas-forming microflora play an influential role in the obesity of patients with non-constipation dominant IBS.
In summary, the present study has demonstrated that obesity (as assessed by measurement of BMI and WC) is negatively associated with SIBO with H2-gas-forming flora among subjects with non-constipated IBS. Since this study was the first of its kind to investigate the inverse association between obesity and LHBT-diagnosed SIBO in non-constipation IBS, further studies—particularly, prospective cohort studies—are needed to elucidate the relationship between obesity and SIBO.
 XML Download